MACD 크로스오버 전략

1
Follow
1780
Followers
개요
이 전략은 두 개의 다른 주기의 지수 이동 평균 ((EMA) 을 교차하여, 빠른 EMA가 아래로 올라서 천천히 EMA를 통과하면 구매 신호를 생성하고, 빠른 EMA가 위로 내려서 천천히 EMA를 통과하면 판매 신호를 생성한다. 이 전략은 다양한 금융 도구와 시간 주기에 적용될 수 있다. 예를 들어, 금은 2 시간 주기에서 가장 효과적이며, 비트코인은 일선 차트에서 가장 효과적이다.
전략 원칙
- 계산 빠른 EMA (기본주기는 12) 와 느린 EMA (기본주기는 26) 을 계산한다.
- 다중 헤드 영역을 정의합니다. (고속 EMA는 느린 EMA 위에 있고 가격이 빠른 EMA 위에 있습니다.) 그리고 빈 헤드 영역 (고속 EMA는 느린 EMA 아래에 있고 가격이 빠른 EMA 아래에 있습니다.)
- 공수 영역에서 다목적 영역으로 변환할 때 구매하고, 다목적 영역에서 공수 영역으로 변환할 때 판매한다.
- 그래프 상에서 녹색과 빨간색으로 다단계 영역과 빈단계 영역을 표시하고, 화살표로 구매 신호를 표시한다.
전략적 이점
- 간단한, 이해하기 쉬운, 초보자를 위한 <unk>.
- 다양한 금융 기구와 시간 주기에서 사용할 수 있습니다.
- 트렌드 추적 능력은 중·장기 트렌드를 포착할 수 있다.
- 매개 변수는 조정할 수 있으며,
전략적 위험
- 하지만, 이 시장은 위기시장에서 잘못된 신호가 발생하여 손실을 초래할 수 있습니다.
- 트렌드 전환 시에는 반응이 느려지므로 슬라이드 포인트가 발생할 수 있습니다.
- 잘못된 변수 선택은 정책의 효과에 영향을 미칩니다.
전략 최적화 방향
- 트렌드 필터를 추가하여, 예를 들어 ADX가 어떤 값보다 큰 경우에만 거래하여, 흔들리는 시장의 손실을 줄인다.
- 출전 시기를 최적화하여, 예를 들어 ATR을 사용하여 손실을 중지하여 단독 손실을 줄입니다.
- 매개 변수를 최적화하여 최적의 매개 변수 조합을 찾아서 안정성과 수익성을 향상시킵니다.
- MACD, RSI 등과 같은 다른 지표 보조 판단과 결합하여 신호 정확도를 향상시킵니다.
요약하다
MACD 교차 전략은 트렌드 추적을 기반으로 한 간단한 전략으로, 장점은 간단하고 실용적이며 적용 범위가 넓으며, 단점은 트렌드 전환을 파악하기가 어렵고, 매개 변수 선택이 어렵습니다. 트렌드 필터링, 입출점 최적화, 매개 변수 선택 및 기타 지표의 조합으로 전략의 성능을 향상시킬 수 있으며, 추가 연구 및 테스트가 가치가 있습니다.
Source
Pine
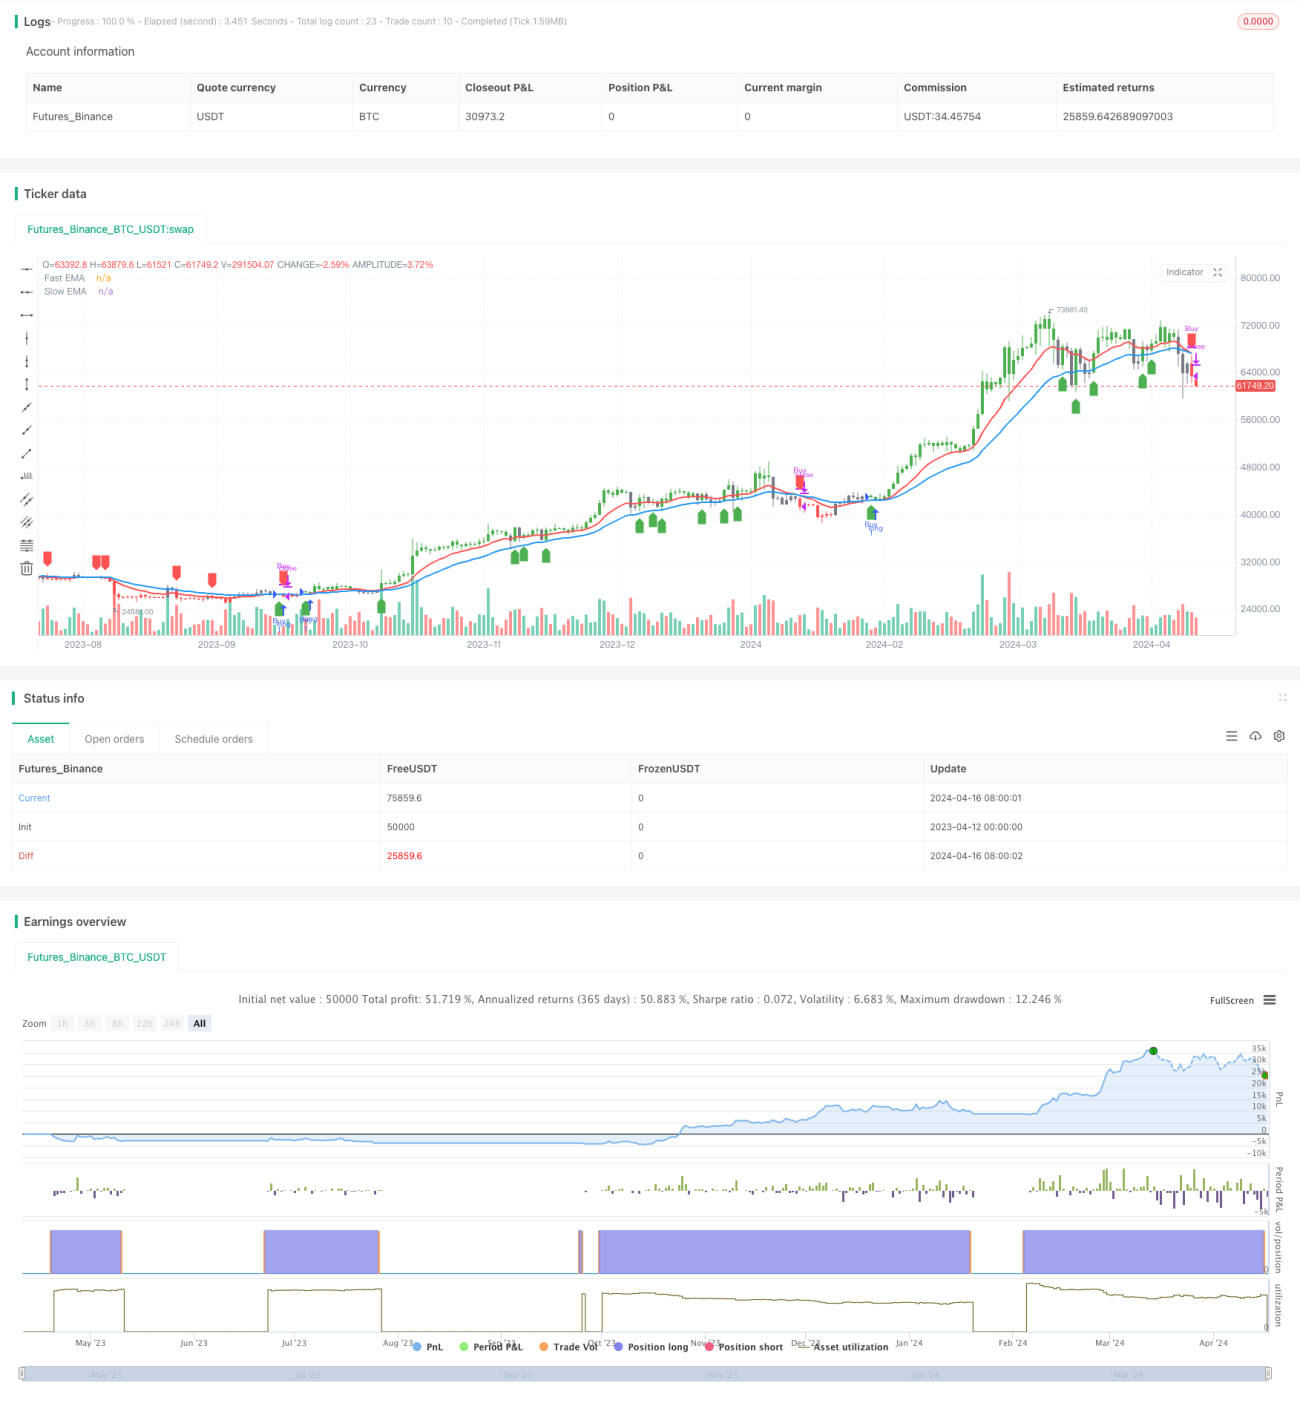
/*backtest
start: 2023-04-12 00:00:00
end: 2024-04-17 00:00:00
period: 1d
basePeriod: 1h
exchanges: [{"eid":"Futures_Binance","currency":"BTC_USDT"}]
*/

//@version=5
strategy('Advance EMA Crossover Strategy', overlay=true, precision=6)
//****************************************************************************//
// CDC Action Zone is based on a simple EMA crossover Strategy parameters
Related strategies
Comment
All comments (0)
No data
- 1