MacD Custom Indicator-Multiple Time Frame+Semua Pilihan Tersedia!
Penulis:ChaoZhang, Tarikh: 2022-05-06 20:46:48Tag:MACD
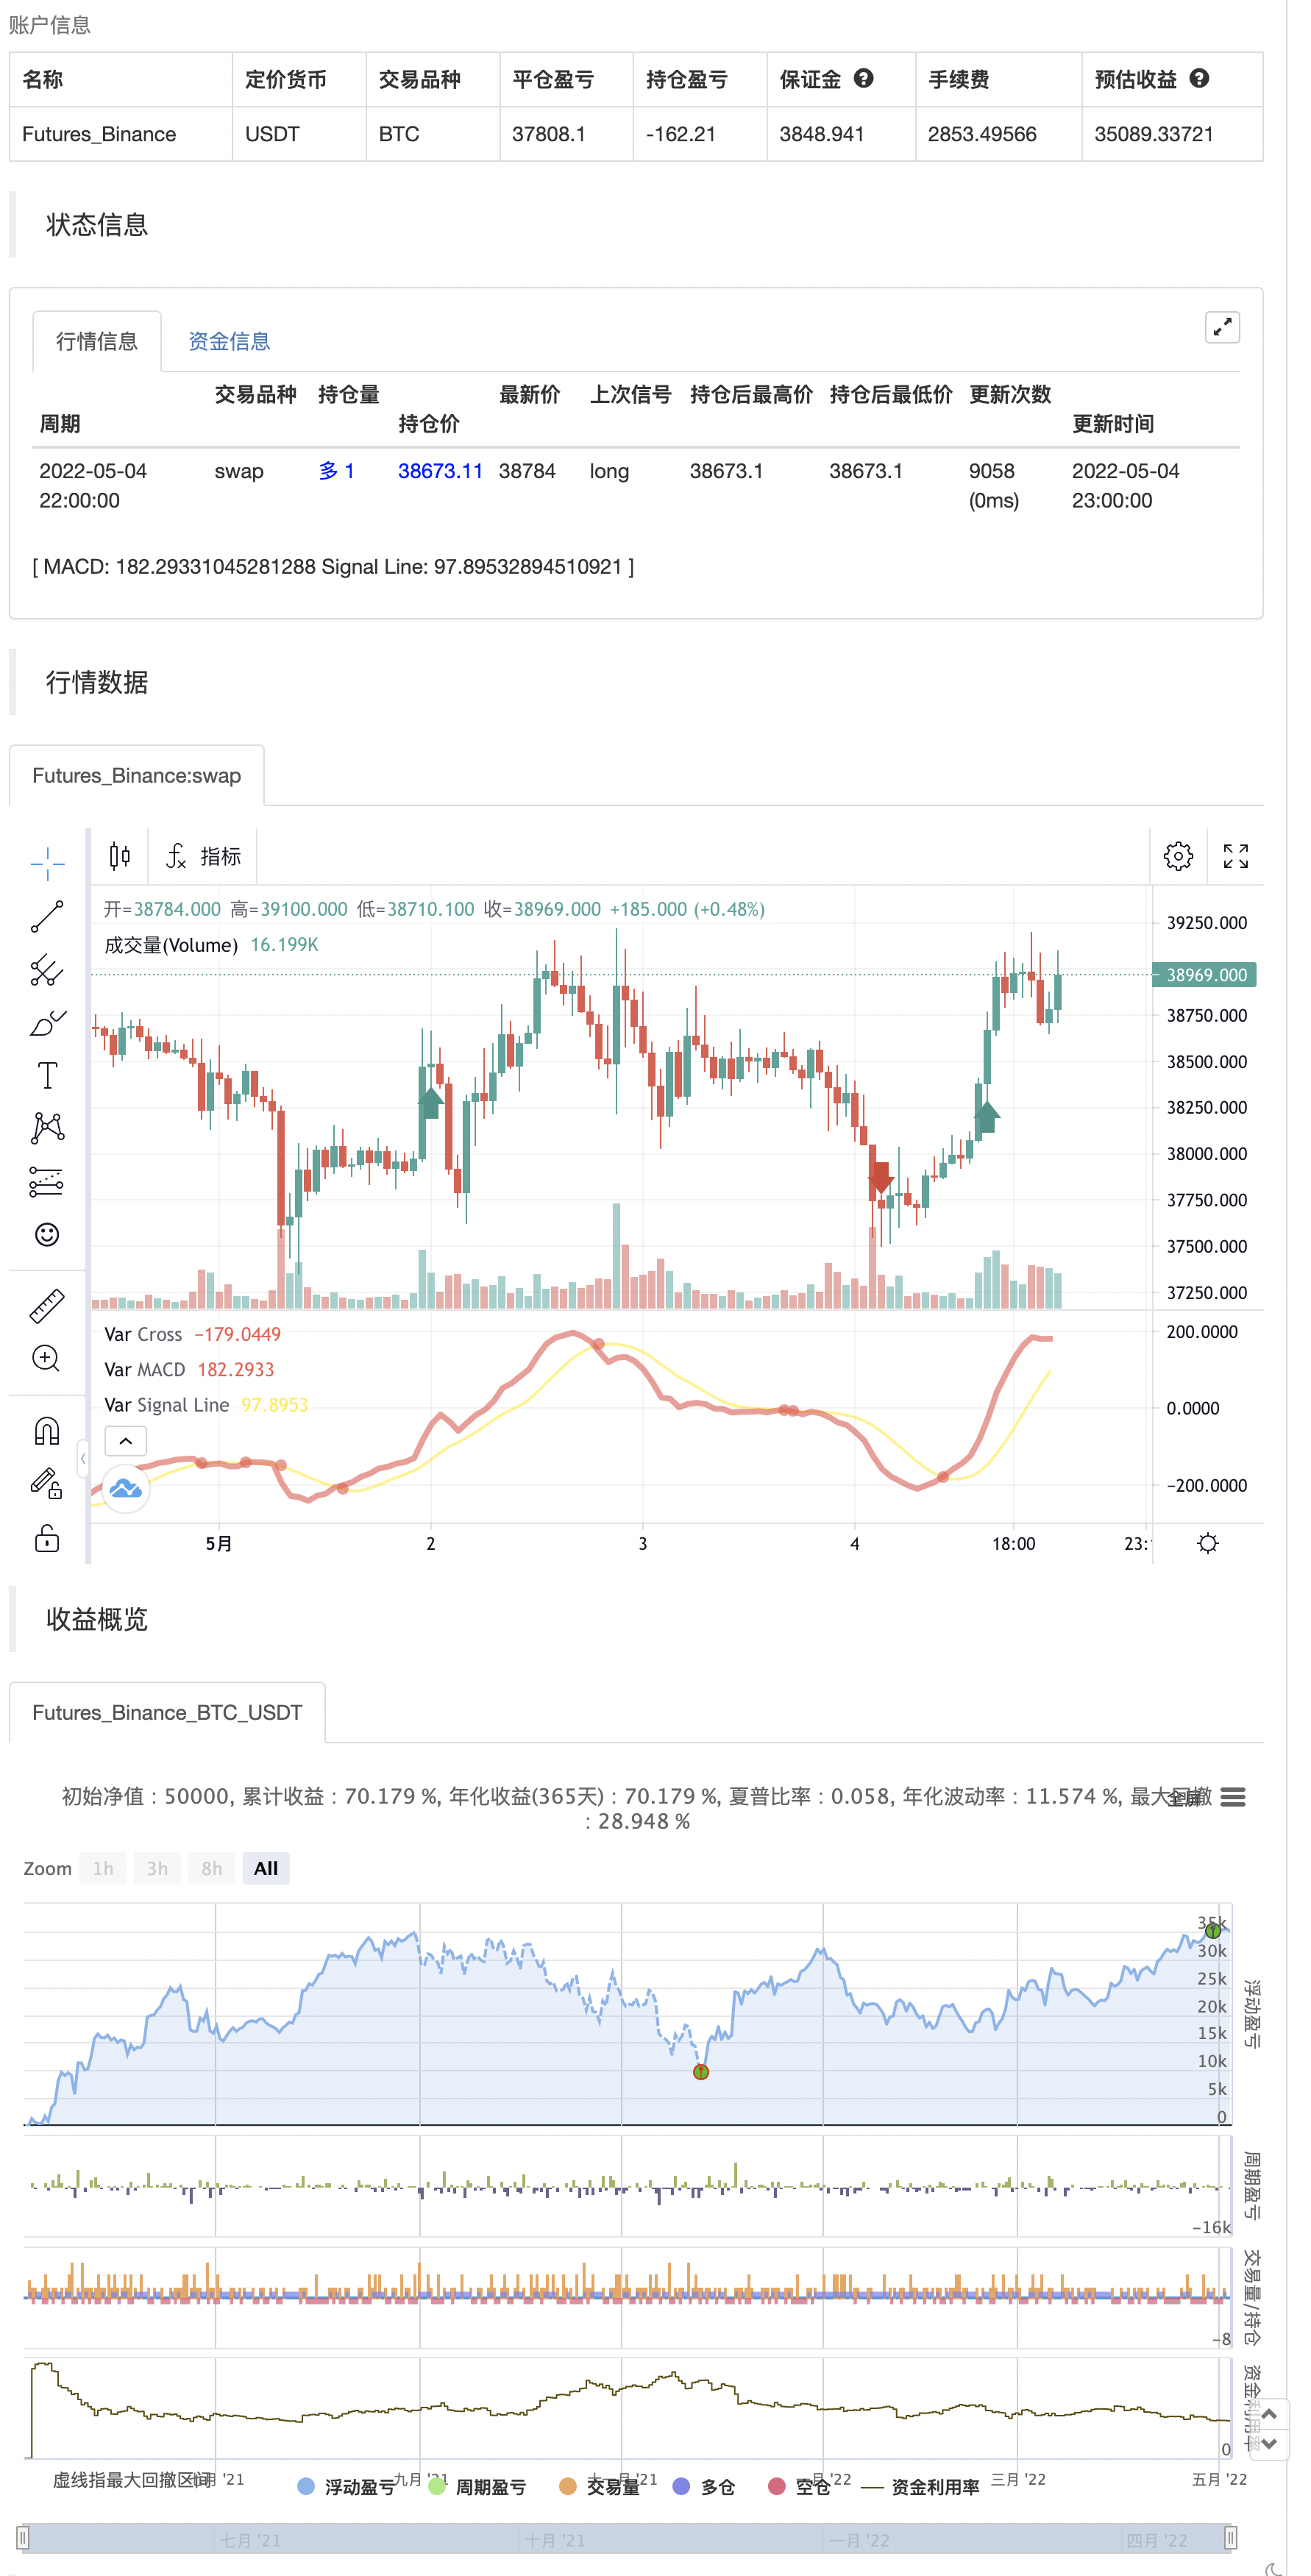
Penunjuk MACD biasa dengan histogram yang memetakan 4 warna berdasarkan arah di atas dan di bawah garis sifar
Kemas kini membolehkan Pilihan kotak semak, Tunjukkan MacD & Garis Isyarat, Tunjukkan Perubahan warna Garis MacD berdasarkan persilangan Garis Isyarat.
Tunjukkan Titik di Palang MacD dan Garis Isyarat, Histogram boleh menunjukkan 4 warna atau 1, Hidupkan dan matikan Histogram.
Terima kasih kepada orang yang luar biasa di sokongan teknikal yang saya tidak akan mengatakan nama anda supaya anda tidak dibombardir dengan e-mel
Perhatikan ciri Sokongan Tech menunjukkan kepada saya bagaimana untuk menetapkan jangka masa lalai penunjuk kepada carta Jangka masa, tetapi juga membolehkan anda memilih jangka masa yang berbeza.
By the way saya mendedahkan sepenuhnya bahawa saya benar-benar mencuri titik-titik di Macd Cross dari
Ujian semula
/*backtest
start: 2021-05-05 00:00:00
end: 2022-05-04 23:59:00
period: 1h
basePeriod: 15m
exchanges: [{"eid":"Futures_Binance","currency":"BTC_USDT"}]
*/

//Created by user ChrisMoody updated 4-10-2014
//Regular MACD Indicator with Histogram that plots 4 Colors Based on Direction Above and Below the Zero Line
//Update allows Check Box Options, Show MacD & Signal Line, Show Change In color of MacD Line based on cross of Signal Line.
//Show Dots at Cross of MacD and Signal Line, Histogram can show 4 colors or 1, Turn on and off Histogram.
//Special Thanks to that incredible person in Tech Support whoem I won't say you r name so you don't get bombarded with emails
//Note the feature Tech Support showed me on how to set the default timeframe of the indicator to the chart Timeframe, but also allow you to choose a different timeframe.
//By the way I fully disclose that I completely STOLE the Dots at the MAcd Cross from "TheLark"

study(title="CM_MacD_Ult_MTF", shorttitle="CM_Ult_MacD_MTF")
source = close
useCurrentRes = input(true, title="Use Current Chart Resolution?")
resCustom = input(title="Use Different Timeframe? Uncheck Box Above", defval="60")
smd = input(true, title="Show MacD & Signal Line? Also Turn Off Dots Below")
sd = input(true, title="Show Dots When MacD Crosses Signal Line?")
sh = input(true, title="Show Histogram?")
macd_colorChange = input(true,title="Change MacD Line Color-Signal Line Cross?")
hist_colorChange = input(true,title="MacD Histogram 4 Colors?")

res = useCurrentRes ? timeframe.period : resCustom

fastLength = input(12, minval=1), slowLength=input(26,minval=1)
signalLength=input(9,minval=1)

fastMA = ta.ema(source, fastLength)
slowMA = ta.ema(source, slowLength)

outMacD = fastMA - slowMA
outSignal = ta.sma(outMacD, signalLength)
outHist = outMacD - outSignal

//outMacD = request.security(timeframe.period, res, mymacd)
//outSignal = request.security(timeframe.period, res, signal)
//outHist = request.security(timeframe.period, res, hist)

histA_IsUp = outHist > outHist[1] and outHist > 0
histA_IsDown = outHist < outHist[1] and outHist > 0
histB_IsDown = outHist < outHist[1] and outHist <= 0
histB_IsUp = outHist > outHist[1] and outHist <= 0

//MacD Color Definitions
macd_IsAbove = outMacD >= outSignal
macd_IsBelow = outMacD < outSignal

plot_color = hist_colorChange ? histA_IsUp ? color.aqua : histA_IsDown ? color.blue : histB_IsDown ? color.red : histB_IsUp ? color.maroon :color.yellow :color.gray
macd_color = macd_colorChange ? macd_IsAbove ? color.lime : color.red : color.red
signal_color = macd_colorChange ? macd_IsAbove ? color.yellow : color.yellow : color.lime

circleYPosition = outSignal

plot(smd and outMacD ? outMacD : na, title="MACD", color=macd_color, linewidth=4)
plot(smd and outSignal ? outSignal : na, title="Signal Line", color=signal_color, style=plot.style_line ,linewidth=2)
//plot(sh and outHist ? outHist : na, title="Histogram", color=plot_color, style=histogram, linewidth=4)
plot(sd and ta.cross(outMacD, outSignal) ? circleYPosition : na, title="Cross", style=plot.style_circles, linewidth=4, color=macd_color)
//hline(0, '0 Line', linestyle=hline.style_solid, linewidth=2, color=color.white)

if outMacD > outSignal and math.abs(outMacD - outSignal) >90
    strategy.entry("entry long", strategy.long)
else if outMacD < outSignal and math.abs(outMacD - outSignal) >90
    strategy.entry("entry short", strategy.short)
- Strategi MACD Lanjutan dengan Martingale Terhad
- H1 Trend Bias + M15 Isyarat MACD + M5 Strategi Jurang Volatiliti Cepat
- MACD Dual Moving Average Crossover Strategi
- MACD RSI Ichimoku Trend Momentum Berikutan Strategi Panjang
- Strategi Dagangan Berdasarkan Persaingan Emas dan Kematian MACD Berturut-turut
- Strategi silang EMA yang dipertingkatkan dengan RSI/MACD/ATR
- Strategi Dagangan Jangka Panjang Bersama MACD dan RSI
- Strategi gabungan pelbagai penunjuk (CCI, DMI, MACD, ADX)
- Trend Multi-Indikator Mengikut Strategi
- CCI, DMI, dan Strategi Pendek Panjang Hibrid MACD
- Teori Gelombang Elliott 4-9 Impulse Wave Automatic Detection Strategi Dagangan
- SuperTrend
- Titik Pembalikan Demark
- Swing Highs/Lows & corak lilin
- TMA Overlay
- Strategi MACD + SMA 200
- Sistem CM Sling Shot
- Bollinger + RSI, Strategi Ganda v1.1
- Strategi Bollinger Bands
- Pengesan Trend yang dioptimumkan
- Pulangan Bulanan dalam Strategi PineScript
- ADX dan DI untuk v4
- Penunjuk: WaveTrend Oscillator
- Indikator Momentum Squeeze
- AlphaTrend
- Perdagangan jangka masa berbilang
- Osilator Sentimen
- Token Ando berdagang pasangan tokens yang digunakan untuk membersihkan harga pasaran
- Strategi Penyu
- Dapatkan trend anda
- Penggunaan AlphaTrend