Multi Timeframe mengambil keuntungan strategi

Penulis:ChaoZhang, Tarikh: 2023-10-30 12:02:43
Tag:

img

Ringkasan

Strategi ini bertujuan untuk melaksanakan pengurusan mengambil keuntungan di bawah pelbagai kerangka masa. Strategi ini menggunakan kedua-dua peratusan mengambil keuntungan dan tahap harga utama mengambil keuntungan berdasarkan kerangka masa yang lebih tinggi, untuk mencapai pengurusan mengambil keuntungan yang lebih tepat dan berkesan.

Logika Strategi

Strategi pertama masuk panjang apabila penunjuk Trend Gelombang melintasi.

Untuk pengurusan mengambil keuntungan, strategi menggunakan dua jenis mengambil keuntungan:

  1. Peratusan mengambil keuntungan: Tetapkan harga mengambil keuntungan berganda berdasarkan peratusan tertentu daripada harga kemasukan.

  2. Multi timeframe mengambil keuntungan: Menggambar purata bergerak pada carta harian dan 4 jam, dan menggunakan harga mereka sebagai harga mengambil keuntungan.

Untuk mengambil keuntungan peratusan, strategi menetapkan 4 mengambil keuntungan harga dengan peratusan yang berbeza.

Untuk mengambil keuntungan pelbagai jangka masa, strategi menarik 100MA dan 200MA pada carta harian dan 4 jam. Apabila harga mencapai purata bergerak ini, ia akan menutup kedudukan.

Di samping itu, harga stop loss ditetapkan. Apabila harga di bawah harga stop loss, semua kedudukan akan ditutup.

Seluruh strategi menggabungkan peratusan mengambil keuntungan dan pelbagai jangka masa mengambil keuntungan untuk mencapai pengurusan mengambil keuntungan yang lebih komprehensif dan canggih.

Kelebihan

  • Mengambil keuntungan peratusan untuk mengelakkan keuntungan yang terlalu awal atau tidak mencukupi berdasarkan peratusan tetap.

  • Menggunakan analisis pelbagai jangka masa untuk menetapkan harga keuntungan yang lebih tepat dengan tahap yang lebih baik.

  • Mengambil keuntungan berlapis-lapis membolehkan penutupan kedudukan separa dan mengurangkan risiko.

  • Menetapkan harga stop loss berkesan mengawal risiko penurunan.

  • Menggabungkan peratusan mengambil keuntungan dan pelbagai jangka masa mengambil keuntungan membuat mengambil keuntungan lebih komprehensif dan halus.

Analisis Risiko

  • Peratusan mengambil keuntungan bergantung pada tetapan parameter. tetapan yang tidak betul boleh membawa kepada awal atau lewat mengambil keuntungan.

  • Analisis jangka masa berbilang bergantung kepada purata bergerak, yang mempunyai beberapa ketinggalan.

  • Penempatan stop loss yang tidak betul boleh menyebabkan stop loss yang tidak perlu.

  • Parameter perlu dioptimumkan untuk kecocokan terbaik antara peratusan mengambil keuntungan dan pelbagai jangka masa mengambil keuntungan.

Arahan pengoptimuman

  • Uji lebih banyak purata bergerak untuk mencari yang optimum sebagai harga keuntungan utama.

  • Cuba kaedah ramalan model untuk meramalkan tahap harga utama sebagai mengambil harga keuntungan.

  • Memperkenalkan lebih banyak peraturan mengambil keuntungan seperti nisbah keuntungan yang dijangkakan, menyusul mengambil keuntungan dll untuk membuat mengambil keuntungan lebih komprehensif.

  • Uji parameter keuntungan peratusan optimum di bawah tempoh pegangan yang berbeza.

  • Mengoptimumkan parameter mengambil keuntungan melalui backtesting untuk nisbah risiko-balasan keseluruhan yang lebih baik.

Ringkasan

Strategi ini merealisasikan pengurusan keuntungan yang fleksibel dan tepat dengan menggabungkan keuntungan peratusan dan keuntungan jangka masa berbilang. Strategi ini mempunyai kelebihan seperti pemilihan harga keuntungan yang lebih baik dan keuntungan yang lebih komprehensif. Ia juga mempunyai masalah seperti penetapan parameter dan penempatan stop loss. Penambahbaikan susulan boleh dibuat dengan mengoptimumkan parameter keuntungan, menambah lebih banyak peraturan keuntungan, dan lain-lain, untuk menjadikan sistem keuntungan lebih mantap.


/*backtest
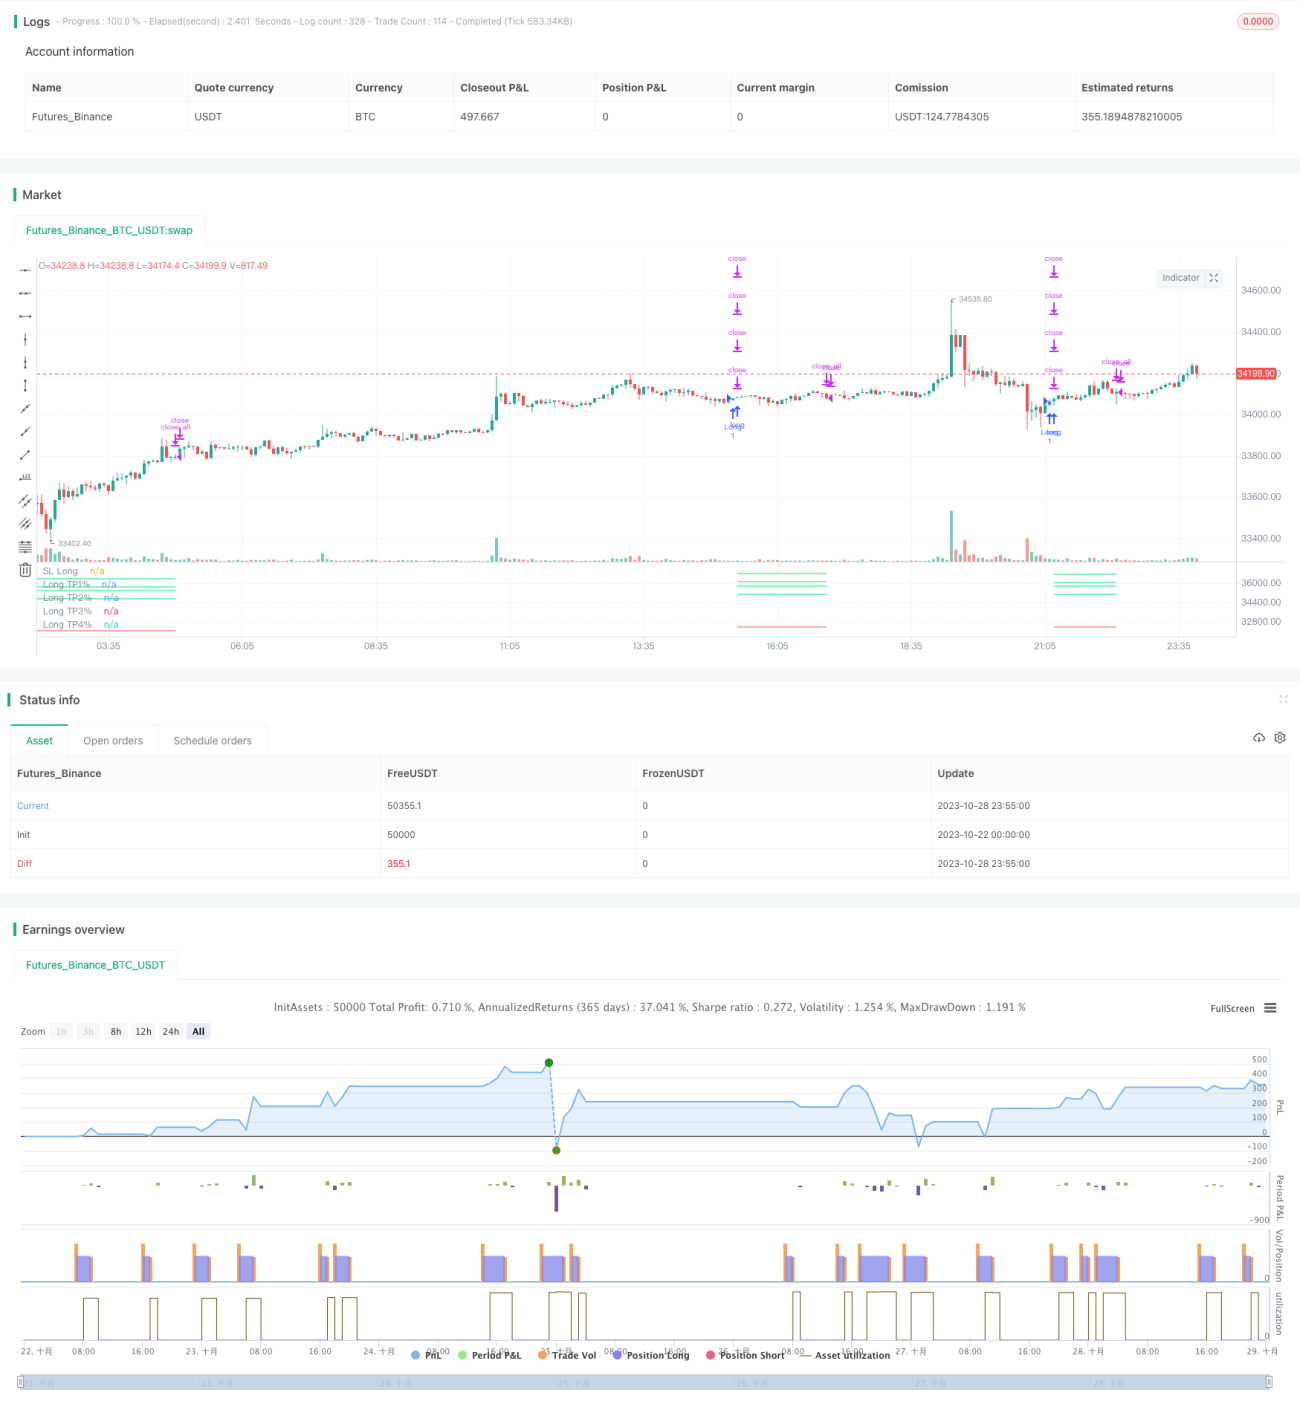
start: 2023-10-22 00:00:00
end: 2023-10-29 00:00:00
period: 5m
basePeriod: 1m
exchanges: [{"eid":"Futures_Binance","currency":"BTC_USDT"}]
*/

// This source code is subject to the terms of the Mozilla Public License 2.0 at https://mozilla.org/MPL/2.0/
// © TrendCrypto2022
//@version=5
// strategy("Take profit Multi timeframe", overlay=true, margin_long=100, margin_short=100)
takepercent  = input.bool(title="Take profit %", defval=true ,group="Set up take profit")
takemtf  = input.bool(title="Take profit Multi timeframe", defval=false ,group="Set up take profit")

//Paste your strategy at here. This is example strategy. I use WaveTrend indicator

//WaveTrend indicator
n1 = input(10, "Channel Length")
n2 = input(21, "Average Length")
oblv1 = input(60, "Over Bought Lv 1")
oblv2 = input(53, "Over Bought Lv 2")
oslv1 = input(-60, "Over Sold Lv 1")
oslv2 = input(-53, "Over Sold Lv 2")
 
ap = hlc3 
esa = ta.ema(ap, n1)
d = ta.ema(math.abs(ap - esa), n1)
ci = (ap - esa) / (0.015 * d)
tci = ta.ema(ci, n2)
 
wt1 = tci
wt2 = ta.sma(wt1,4)

//Strategy
buy = ta.crossover(wt1, wt2) and wt1 < -40
if (buy)
    strategy.entry("Long", strategy.long)


//Resistant in time D and 4H
ema_len1 = input.int(title='Ema1', defval=100, group='Take profit Mtf')
ema_len2 = input.int(title='Ema2', defval=200, group='Take profit Mtf')
src = input.source(title='Source', defval=close, group='Take profit Mtf')
tf1 = input.timeframe(title='Time frame 1', defval='240', group='Take profit Mtf')
tf2 = input.timeframe(title='Time frame 2', defval='D', group='Take profit Mtf')
htf_ma1 = ta.ema(src, ema_len1)
htf_ma2 = ta.ema(src, ema_len2)
ema1 = request.security(syminfo.tickerid, tf1, htf_ma1)
ema2 = request.security(syminfo.tickerid, tf1, htf_ma2)
ema3 = request.security(syminfo.tickerid, tf2, htf_ma1)
ema4 = request.security(syminfo.tickerid, tf2, htf_ma2)

//Plot
plotema1 = plot(ema1, color=color.new(color.silver, 0), style=plot.style_line, linewidth=1, offset=0, title='Ema100 4h', display=display.none)
plotema2 = plot(ema2, color=color.new(color.silver, 0), style=plot.style_line, linewidth=1, offset=0, title='Ema200 4h', display=display.none)
plotema3 = plot(ema3, color=color.new(color.orange, 20), style=plot.style_line, linewidth=1, offset=0, title='Ema100 D', display=display.none)
plotema4 = plot(ema4, color=color.new(color.orange, 20), style=plot.style_line, linewidth=1, offset=0, title='Ema200 D', display=display.none)

//Label take profit multitime frame
var label labelema1 = na
label.delete(labelema1)
labelema1 := label.new(x=time + 120, y=ema1, text='\n*****Ema100 4H: ' + str.tostring(math.round(ema1,4)) + '', color=color.new(#000000, 100), textcolor =  color.yellow, size=size.small, style=label.style_label_left, xloc=xloc.bar_time, yloc=yloc.price)

var label labelema2 = na
label.delete(labelema2)
labelema2 := label.new(x=time + 120, y=ema2, text='\n*****Ema200 4H: ' + str.tostring(math.round(ema2,4)) + '', color=color.new(#000000, 100), textcolor = color.yellow, size=size.small, style=label.style_label_left, xloc=xloc.bar_time, yloc=yloc.price)

var label labelema3 = na
label.delete(labelema3)
labelema3 := label.new(x=time + 120, y=ema3, text='\n*****Ema100 1D: ' + str.tostring(math.round(ema3,4)) + '', color=color.new(#000000, 100), textcolor = color.yellow, size=size.small, style=label.style_label_left, xloc=xloc.bar_time, yloc=yloc.price)

var label labelema4 = na
label.delete(labelema4)
labelema4 := label.new(x=time + 120, y=ema4, text='\n*****Ema200 1D: ' + str.tostring(math.round(ema4,4)) + '', color=color.new(#000000, 100), textcolor = color.yellow, size=size.small, style=label.style_label_left, xloc=xloc.bar_time, yloc=yloc.price)

//Set up take profit %
percent(pcnt) =>
    strategy.position_size != 0 ? math.round(pcnt / 100 * strategy.position_avg_price / syminfo.mintick) : float(na)
TP1=input.float(3, title="TP1 %", step=0.1, group="Take profit %")
TP2=input.float(5, title="TP2 %", step=1, group="Take profit %")
TP3=input.float(6, title="TP3 %", step=1, group="Take profit %")
TP4=input.float(8, title="TP4 %", step=1, group="Take profit %")

SL=input.float(5, title="Stop Loss %", step=1, group="Take profit %")
qty1=input.float(5, title="% Close At TP1", step=1, group="Take profit %")
qty2=input.float(5, title="% Close At TP2", step=1, group="Take profit %")
qty3=input.float(5, title="% Close At TP3", step=1, group="Take profit %")
qty4=input.float(5, title="% Close At TP4", step=1, group="Take profit %")
lossPnt_L = percent(SL)

//Set up take profit multi timeframe
a = array.from((ema1), (ema2), (ema3), (ema4))
tpmtf1 = array.min(a)
tpmtf2 = array.min(a, 2)
tpmtf3 = array.min(a, 3)
tpmtf4 = array.min(a, 4)
//Set up exit
long_sl_level = strategy.position_avg_price - lossPnt_L*syminfo.mintick
if takepercent == true
    strategy.exit("TP1%", "Long", qty_percent = qty1, profit = percent(TP1), loss = lossPnt_L)
    strategy.exit("TP2%", "Long", qty_percent = qty2, profit = percent(TP2), loss = lossPnt_L)
    strategy.exit("TP3%", "Long", qty_percent = qty3, profit = percent(TP3), loss = lossPnt_L)
    strategy.exit("TP4%", "Long", qty_percent = qty4, profit = percent(TP3), loss = lossPnt_L)
    strategy.close_all(when= ta.crossunder(wt1, wt2) and wt1 > 0, comment="Close All")


if takemtf == true and array.max(a, 1) > strategy.position_avg_price
    strategy.exit("TP1Mtf", "Long", qty_percent = qty1, limit = tpmtf1, stop = long_sl_level)
    strategy.exit("TP2Mtf", "Long", qty_percent = qty2, limit = tpmtf2, stop = long_sl_level)
    strategy.exit("TP3Mtf", "Long", qty_percent = qty3, limit = tpmtf3, stop = long_sl_level)
    strategy.close_all(when= ta.crossunder(wt1, wt2) and wt1 > 0, comment="Close All")

// Plot TP & SL
long_tp1_level = strategy.position_avg_price + percent(TP1)*syminfo.mintick
long_tp2_level = strategy.position_avg_price + percent(TP2)*syminfo.mintick
long_tp3_level = strategy.position_avg_price + percent(TP3)*syminfo.mintick
long_tp4_level = strategy.position_avg_price + percent(TP4)*syminfo.mintick

plot(strategy.position_size > 0 ? long_sl_level : na, color=color.red, style=plot.style_linebr, title="SL Long")

plot(strategy.position_size > 0 ? long_tp1_level : na, color=color.lime, style=plot.style_linebr, title="Long TP1%")
plot(strategy.position_size > 0 ? long_tp2_level : na, color=color.lime, style=plot.style_linebr, title="Long TP2%")
plot(strategy.position_size > 0 ? long_tp3_level : na, color=color.lime, style=plot.style_linebr, title="Long TP3%")
plot(strategy.position_size > 0 ? long_tp4_level : na, color=color.lime, style=plot.style_linebr, title="Long TP4%")

plot(strategy.position_size > 0 ? tpmtf1 : na, color=color.orange, style=plot.style_linebr, title="Long TP1Mtf", display = display.none)
plot(strategy.position_size > 0 ? tpmtf2 : na, color=color.orange, style=plot.style_linebr, title="Long TP2Mtf", display = display.none)
plot(strategy.position_size > 0 ? tpmtf3 : na, color=color.orange, style=plot.style_linebr, title="Long TP3Mtf", display = display.none)

//Label TP
if strategy.position_size > 0
    var label labellongtp1 = na
    label.delete(labellongtp1)
    labellongtp1 := label.new(x=time + 120, y=long_tp1_level, text='\nTP1: ' + str.tostring(math.round(long_tp1_level,2)) + '', color=color.new(#000000, 100), textcolor = color.lime, size=size.small, style=label.style_label_left, xloc=xloc.bar_time, yloc=yloc.price)
     
    var label labellongtp2 = na
    label.delete(labellongtp2)
    labellongtp2 := label.new(x=time + 120, y=long_tp2_level, text='\nTP2: ' + str.tostring(math.round(long_tp2_level,2)) + '', color=color.new(#000000, 100), textcolor = color.lime, size=size.small, style=label.style_label_left, xloc=xloc.bar_time, yloc=yloc.price)
     
    var label labellongtp3 = na
    label.delete(labellongtp3)
    labellongtp3 := label.new(x=time + 120, y=long_tp3_level, text='\nTP3: ' + str.tostring(math.round(long_tp3_level,2)) + '', color=color.new(#000000, 100), textcolor = color.lime, size=size.small, style=label.style_label_left, xloc=xloc.bar_time, yloc=yloc.price)
        
    var label labellongtp4 = na
    label.delete(labellongtp4)
    labellongtp4 := label.new(x=time + 120, y=long_tp4_level, text='\nTP4: ' + str.tostring(math.round(long_tp4_level,2)) + '', color=color.new(#000000, 100), textcolor = color.lime, size=size.small, style=label.style_label_left, xloc=xloc.bar_time, yloc=yloc.price)


Lebih lanjut