
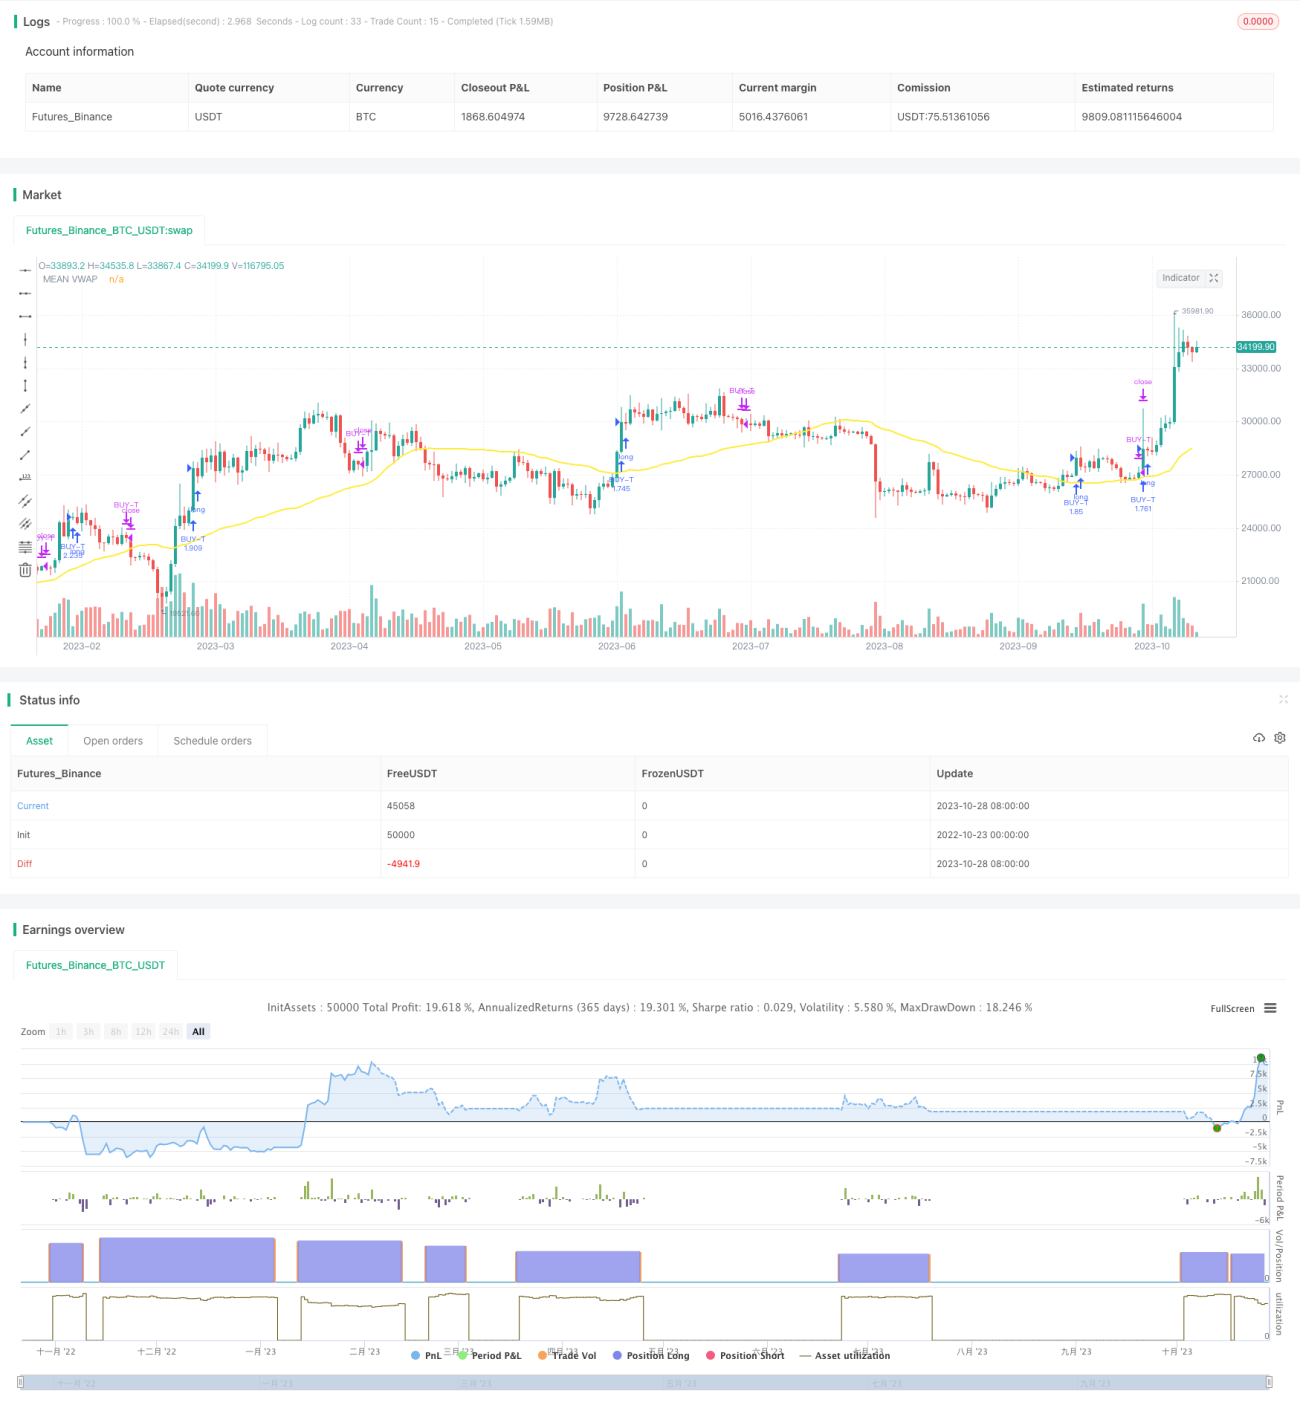
Strategi ini menggunakan prinsip persimpangan rata-rata, menggabungkan isyarat pembalikan RSI, dan algoritma penjejakan dua baris yang disesuaikan untuk melakukan perdagangan persimpangan rata-rata. Strategi ini menjejaki persimpangan rata-rata dua kitaran yang berbeza, satu persimpangan rata-rata yang cepat mengikuti trend jangka pendek, dan satu lagi persimpangan rata-rata yang perlahan mengikuti trend jangka panjang. Apabila persimpangan rata-rata cepat melintasi atas persimpangan rata-rata perlahan, ia menunjukkan trend jangka pendek ke atas, dan boleh dibeli; apabila persimpangan rata-rata cepat melintasi bawah persimpangan rata-rata perlahan, ia menunjukkan berakhirnya trend jangka pendek, dan ia harus ditutup.
Mengira purata VWAP untuk dua set parameter yang berbeza yang mewakili trend jangka panjang dan trend jangka pendek
Mengambil purata dua set garisan langit-langit dan garis asas sebagai rata-rata perlahan dan rata-rata cepat
Kaedah pengiraan Brinstrand untuk menilai penyesuaian dan penembusan
Kaedah untuk mengira TSV
Mengira RSI untuk menilai overbought dan oversold
Syarat penyertaan:
Syarat kejohanan:
Menggunakan sistem dua hala, ia boleh menangkap trend jangka pendek dan panjang pada masa yang sama.
Indeks RSI mengelakkan membeli di kawasan yang lebih banyak dan menjual di kawasan yang lebih banyak
Indeks TSV memastikan terdapat jumlah transaksi yang mencukupi untuk menyokong trend
Pencapaian Utama di Burin
Kombinasi pelbagai penunjuk yang berkesan untuk menyaring penembusan palsu
Sistem linear mudah menghasilkan isyarat yang salah dan memerlukan penapisan penunjuk tambahan
Parameter RSI perlu dioptimumkan, jika tidak, ia mungkin terlepas titik jual beli
Indeks TSV juga sensitif terhadap parameter dan perlu diuji dengan teliti
Penembusan Brin di atas landasan mungkin palsu, perlu diperiksa
Kombinasi pelbagai parameter, parameter yang sukar untuk dioptimumkan, mudah untuk dioptimumkan berlebihan
Data latihan dan ujian yang tidak mencukupi boleh menyebabkan kecocokan kurva
Uji lebih banyak parameter kitaran untuk mencari kombinasi parameter terbaik
Cuba indikator lain seperti MACD, alternatif KD atau gabungan RSI
Pengoptimuman parameter menggunakan analisis berjalan ke hadapan
Tambah strategi henti kerugian untuk mengawal kerugian tunggal
Pertimbangan untuk menggunakan model pembelajaran mesin untuk membantu penilaian isyarat
Jangan terlalu bergantung pada kombinasi parameter tunggal untuk menyesuaikan parameter untuk pasaran yang berbeza
Strategi ini menangkap trend jangka pendek melalui sistem dua garis sejajar, dan menggunakan pelbagai petunjuk penapis isyarat, seperti RSI, TSV, dan Brin. Kelebihan strategi ini adalah bahawa ia boleh beransur-ansur, menangkap gelombang kenaikan jangka panjang. Tetapi ada juga risiko isyarat palsu, perlu mengoptimumkan parameter lebih lanjut dan mengawal stop loss untuk mengurangkan risiko.
/*backtest
start: 2022-10-23 00:00:00
end: 2023-10-29 00:00:00
period: 1d
basePeriod: 1h
exchanges: [{"eid":"Futures_Binance","currency":"BTC_USDT"}]
*/
// @version=4
// Credits
// "Vwap with period" code which used in this strategy to calculate the leadLine was written by "neolao" active on https://tr.tradingview.com/u/neolao/
// "TSV" code which used in this strategy was written by "liw0" active on https://www.tradingview.com/u/liw0. The code is corrected by "vitelot" December 2018.
// "Vidya" code which used in this strategy was written by "everget" active on https://tr.tradingview.com/u/everget/
strategy("HYE Combo Market [Strategy] (Vwap Mean Reversion + Trend Hunter)", overlay = true, initial_capital = 1000, default_qty_value = 100, default_qty_type = strategy.percent_of_equity, commission_value = 0.025)
//Strategy inputs
source = input(title = "Source", defval = close, group = "Mean Reversion Strategy Inputs")
smallcumulativePeriod = input(title = "Small VWAP", defval = 8, group = "Mean Reversion Strategy Inputs")
bigcumulativePeriod = input(title = "Big VWAP", defval = 10, group = "Mean Reversion Strategy Inputs")
meancumulativePeriod = input(title = "Mean VWAP", defval = 50, group = "Mean Reversion Strategy Inputs")
percentBelowToBuy = input(title = "Percent below to buy %", defval = 2, group = "Mean Reversion Strategy Inputs")
rsiPeriod = input(title = "Rsi Period", defval = 2, group = "Mean Reversion Strategy Inputs")
rsiEmaPeriod = input(title = "Rsi Ema Period", defval = 5, group = "Mean Reversion Strategy Inputs")
rsiLevelforBuy = input(title = "Maximum Rsi Level for Buy", defval = 30, group = "Mean Reversion Strategy Inputs")
slowtenkansenPeriod = input(9, minval=1, title="Slow Tenkan Sen VWAP Line Length", group = "Trend Hunter Strategy Inputs")
slowkijunsenPeriod = input(13, minval=1, title="Slow Kijun Sen VWAP Line Length", group = "Trend Hunter Strategy Inputs")
fasttenkansenPeriod = input(3, minval=1, title="Fast Tenkan Sen VWAP Line Length", group = "Trend Hunter Strategy Inputs")
fastkijunsenPeriod = input(7, minval=1, title="Fast Kijun Sen VWAP Line Length", group = "Trend Hunter Strategy Inputs")
BBlength = input(20, minval=1, title= "Bollinger Band Length", group = "Trend Hunter Strategy Inputs")
BBmult = input(2.0, minval=0.001, maxval=50, title="Bollinger Band StdDev", group = "Trend Hunter Strategy Inputs")
tsvlength = input(20, minval=1, title="TSV Length", group = "Trend Hunter Strategy Inputs")
tsvemaperiod = input(7, minval=1, title="TSV Ema Length", group = "Trend Hunter Strategy Inputs")
length = input(title="Vidya Length", type=input.integer, defval=20, group = "Trend Hunter Strategy Inputs")
src = input(title="Vidya Source", type=input.source, defval= hl2 , group = "Trend Hunter Strategy Inputs")
// Vidya Calculation
getCMO(src, length) =>
mom = change(src)
upSum = sum(max(mom, 0), length)
downSum = sum(-min(mom, 0), length)
out = (upSum - downSum) / (upSum + downSum)
out
cmo = abs(getCMO(src, length))
alpha = 2 / (length + 1)
vidya = 0.0
vidya := src * alpha * cmo + nz(vidya[1]) * (1 - alpha * cmo)
// Make input options that configure backtest date range
startDate = input(title="Start Date", type=input.integer,
defval=1, minval=1, maxval=31, group = "Strategy Date Range")
startMonth = input(title="Start Month", type=input.integer,
defval=1, minval=1, maxval=12, group = "Strategy Date Range")
startYear = input(title="Start Year", type=input.integer,
defval=2000, minval=1800, maxval=2100, group = "Strategy Date Range")
endDate = input(title="End Date", type=input.integer,
defval=31, minval=1, maxval=31, group = "Strategy Date Range")
endMonth = input(title="End Month", type=input.integer,
defval=12, minval=1, maxval=12, group = "Strategy Date Range")
endYear = input(title="End Year", type=input.integer,
defval=2021, minval=1800, maxval=2100, group = "Strategy Date Range")
inDateRange = true
// Mean Reversion Strategy Calculation
typicalPriceS = (high + low + close) / 3
typicalPriceVolumeS = typicalPriceS * volume
cumulativeTypicalPriceVolumeS = sum(typicalPriceVolumeS, smallcumulativePeriod)
cumulativeVolumeS = sum(volume, smallcumulativePeriod)
smallvwapValue = cumulativeTypicalPriceVolumeS / cumulativeVolumeS
typicalPriceB = (high + low + close) / 3
typicalPriceVolumeB = typicalPriceB * volume
cumulativeTypicalPriceVolumeB = sum(typicalPriceVolumeB, bigcumulativePeriod)
cumulativeVolumeB = sum(volume, bigcumulativePeriod)
bigvwapValue = cumulativeTypicalPriceVolumeB / cumulativeVolumeB
typicalPriceM = (high + low + close) / 3
typicalPriceVolumeM = typicalPriceM * volume
cumulativeTypicalPriceVolumeM = sum(typicalPriceVolumeM, meancumulativePeriod)
cumulativeVolumeM = sum(volume, meancumulativePeriod)
meanvwapValue = cumulativeTypicalPriceVolumeM / cumulativeVolumeM
rsiValue = rsi(source, rsiPeriod)
rsiEMA = ema(rsiValue, rsiEmaPeriod)
buyMA = ((100 - percentBelowToBuy) / 100) * bigvwapValue[0]
inTrade = strategy.position_size > 0
notInTrade = strategy.position_size <= 0
if(crossunder(smallvwapValue, buyMA) and rsiEMA < rsiLevelforBuy and close < meanvwapValue and inDateRange and notInTrade)
strategy.entry("BUY-M", strategy.long)
if(close > meanvwapValue or not inDateRange)
strategy.close("BUY-M")
// Trend Hunter Strategy Calculation
// Slow Tenkan Sen Calculation
typicalPriceTS = (high + low + close) / 3
typicalPriceVolumeTS = typicalPriceTS * volume
cumulativeTypicalPriceVolumeTS = sum(typicalPriceVolumeTS, slowtenkansenPeriod)
cumulativeVolumeTS = sum(volume, slowtenkansenPeriod)
slowtenkansenvwapValue = cumulativeTypicalPriceVolumeTS / cumulativeVolumeTS
// Slow Kijun Sen Calculation
typicalPriceKS = (high + low + close) / 3
typicalPriceVolumeKS = typicalPriceKS * volume
cumulativeTypicalPriceVolumeKS = sum(typicalPriceVolumeKS, slowkijunsenPeriod)
cumulativeVolumeKS = sum(volume, slowkijunsenPeriod)
slowkijunsenvwapValue = cumulativeTypicalPriceVolumeKS / cumulativeVolumeKS
// Fast Tenkan Sen Calculation
typicalPriceTF = (high + low + close) / 3
typicalPriceVolumeTF = typicalPriceTF * volume
cumulativeTypicalPriceVolumeTF = sum(typicalPriceVolumeTF, fasttenkansenPeriod)
cumulativeVolumeTF = sum(volume, fasttenkansenPeriod)
fasttenkansenvwapValue = cumulativeTypicalPriceVolumeTF / cumulativeVolumeTF
// Fast Kijun Sen Calculation
typicalPriceKF = (high + low + close) / 3
typicalPriceVolumeKF = typicalPriceKS * volume
cumulativeTypicalPriceVolumeKF = sum(typicalPriceVolumeKF, fastkijunsenPeriod)
cumulativeVolumeKF = sum(volume, fastkijunsenPeriod)
fastkijunsenvwapValue = cumulativeTypicalPriceVolumeKF / cumulativeVolumeKF
// Slow LeadLine Calculation
lowesttenkansen_s = lowest(slowtenkansenvwapValue, slowtenkansenPeriod)
highesttenkansen_s = highest(slowtenkansenvwapValue, slowtenkansenPeriod)
lowestkijunsen_s = lowest(slowkijunsenvwapValue, slowkijunsenPeriod)
highestkijunsen_s = highest(slowkijunsenvwapValue, slowkijunsenPeriod)
slowtenkansen = avg(lowesttenkansen_s, highesttenkansen_s)
slowkijunsen = avg(lowestkijunsen_s, highestkijunsen_s)
slowleadLine = avg(slowtenkansen, slowkijunsen)
// Fast LeadLine Calculation
lowesttenkansen_f = lowest(fasttenkansenvwapValue, fasttenkansenPeriod)
highesttenkansen_f = highest(fasttenkansenvwapValue, fasttenkansenPeriod)
lowestkijunsen_f = lowest(fastkijunsenvwapValue, fastkijunsenPeriod)
highestkijunsen_f = highest(fastkijunsenvwapValue, fastkijunsenPeriod)
fasttenkansen = avg(lowesttenkansen_f, highesttenkansen_f)
fastkijunsen = avg(lowestkijunsen_f, highestkijunsen_f)
fastleadLine = avg(fasttenkansen, fastkijunsen)
// BBleadLine Calculation
BBleadLine = avg(fastleadLine, slowleadLine)
// Bollinger Band Calculation
basis = sma(BBleadLine, BBlength)
dev = BBmult * stdev(BBleadLine, BBlength)
upper = basis + dev
lower = basis - dev
// TSV Calculation
tsv = sum(close>close[1]?volume*(close-close[1]):close<close[1]?volume*(close-close[1]):0,tsvlength)
tsvema = ema(tsv, tsvemaperiod)
// Rules for Entry & Exit
if(fastleadLine > fastleadLine[1] and slowleadLine > slowleadLine[1] and tsv > 0 and tsv > tsvema and close > upper and close > vidya and inDateRange and notInTrade)
strategy.entry("BUY-T", strategy.long)
if((fastleadLine < fastleadLine[1] and slowleadLine < slowleadLine[1]) or not inDateRange)
strategy.close("BUY-T")
// Plots
plot(meanvwapValue, title="MEAN VWAP", linewidth=2, color=color.yellow)
//plot(vidya, title="VIDYA", linewidth=2, color=color.green)
//colorsettingS = input(title="Solid Color Slow Leadline", defval=false, type=input.bool)
//plot(slowleadLine, title = "Slow LeadLine", color = colorsettingS ? color.aqua : slowleadLine > slowleadLine[1] ? color.green : color.red, linewidth=3)
//colorsettingF = input(title="Solid Color Fast Leadline", defval=false, type=input.bool)
//plot(fastleadLine, title = "Fast LeadLine", color = colorsettingF ? color.orange : fastleadLine > fastleadLine[1] ? color.green : color.red, linewidth=3)
//p1 = plot(upper, "Upper BB", color=#2962FF)
//p2 = plot(lower, "Lower BB", color=#2962FF)
//fill(p1, p2, title = "Background", color=color.blue)
//plot(smallvwapValue, color=#13C425, linewidth=2)
//plot(bigvwapValue, color=#CA1435, linewidth=2)