Strategi penjejakan arah aliran jangka pendek berasaskan Bollinger Bands

Gambaran keseluruhan
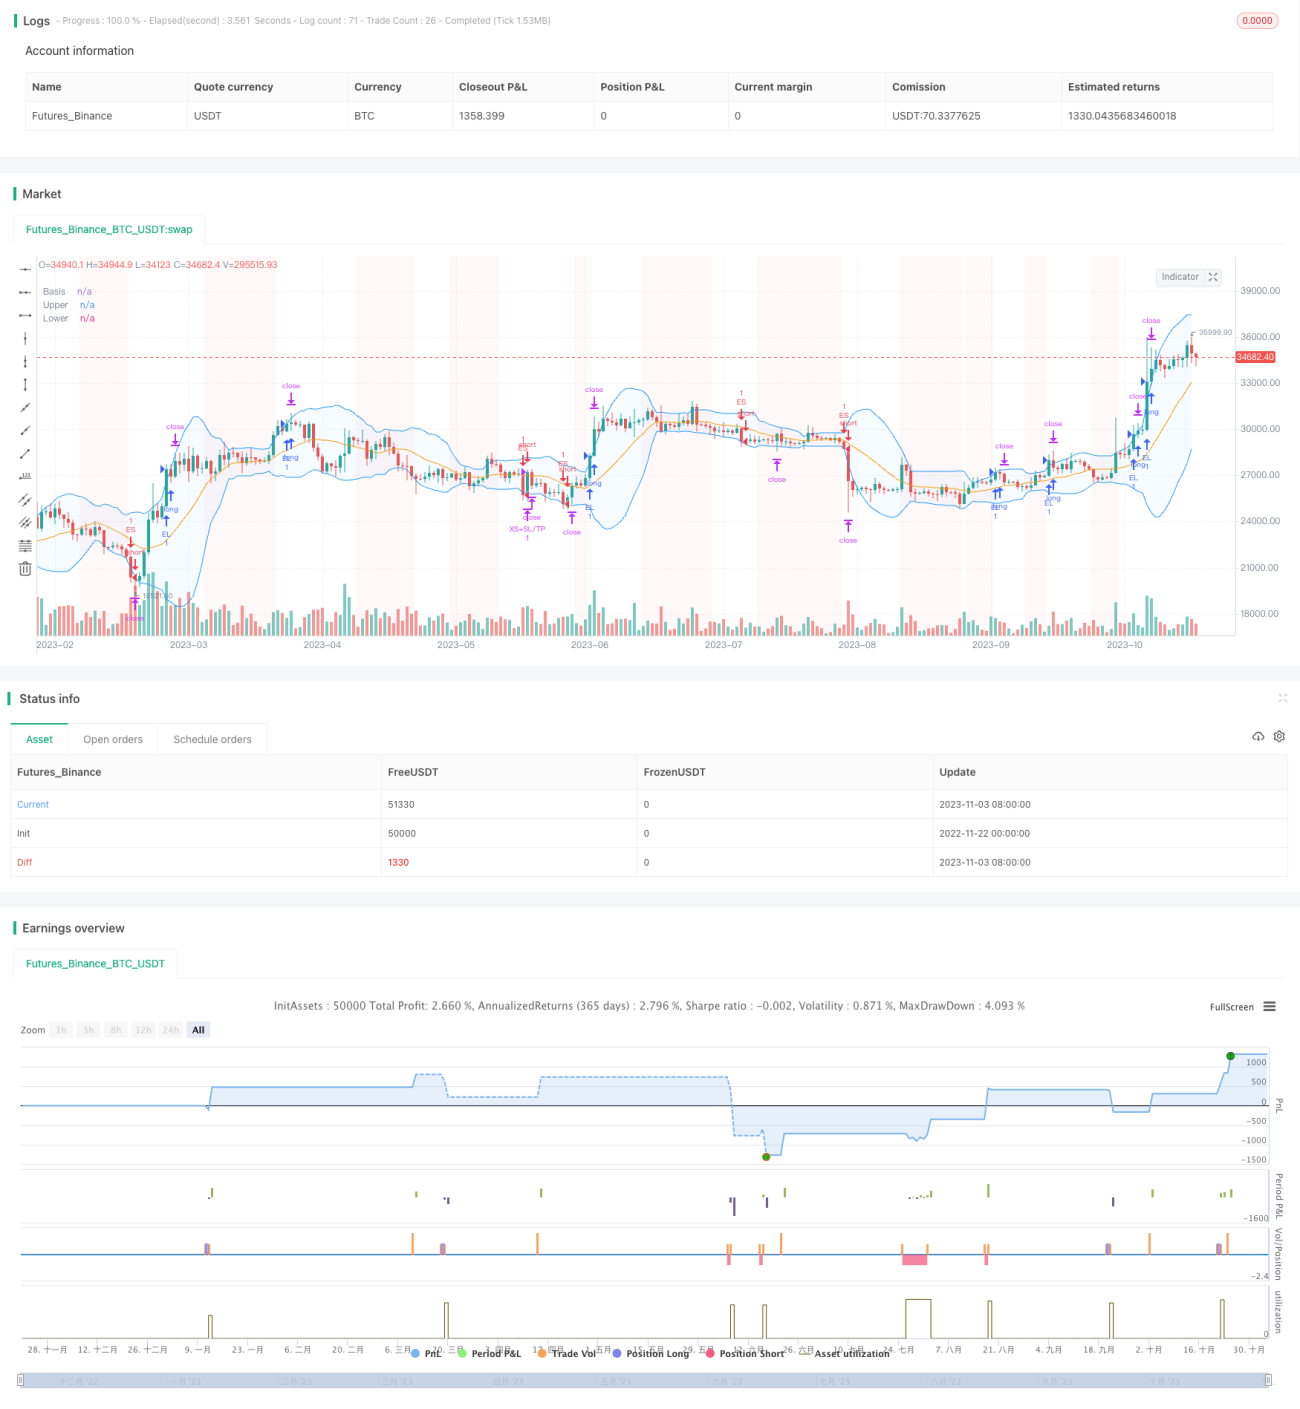
Strategi Brin Belt Breakout adalah strategi jangka pendek yang mengikuti trend berdasarkan indikator Brin Belt. Ia boleh melakukan operasi dalam kedua-dua arah, baik dalam bentuk multihead dan kosong, dan digunakan untuk kontrak tunai dan kekal, terutamanya dalam keadaan trend.
Strategi ini mempunyai konfigurasi yang tinggi, yang membolehkan pengguna untuk menetapkan parameter jangka dan penyimpangan, penapis trend, penapis turun naik, penapis arah perdagangan, penapis kadar perubahan, dan penapis tarikh. Selain itu, ia juga menetapkan stop loss, stop loss dan tracking stop loss untuk kedudukan multihead dan kosong, memastikan pendekatan pengurusan risiko yang komprehensif.
Prinsip Strategi
Indikator utama strategi ini adalah Brin Belt. Brin Belt terdiri daripada tiga garis tengah, atas, dan bawah, yang mewakili garis purata harga, batas atas dan bawah pergerakan. Apabila harga menembusi arah atas, buat lebih banyak; apabila harga menembusi arah bawah, buat lebih banyak.
Selain itu, beberapa penapis tambahan telah disediakan untuk mengelakkan perdagangan Noise. Penapis ini termasuk:
-
Penapis trend: harga lebih tinggi daripada purata bergerak dan harga lebih rendah daripada purata bergerak;
-
Penapis turun naik: berdagang hanya apabila turun naik meningkat;
-
Penapis arah dagangan: pilih hanya melakukan lebih, hanya melakukan lebih, atau berdagang dua hala mengikut sifat tanda;
-
Penapis kadar perubahan: harga hanya masuk apabila kadar perubahan mencapai tahap tertentu berbanding harga penutupan hari dagangan sebelumnya;
-
Penapis Tarikh: Tetapan julat masa untuk pengukuran semula.
Sinyal dagangan dihasilkan apabila semua syarat penapisan dipenuhi. Stop, stop loss dan tracking stop loss memastikan pengurusan risiko. Di samping itu, tetapan kerugian maksimum dalam sehari mengelakkan penarikan balik yang besar dalam sehari.
Analisis kelebihan
Strategi ini mempunyai kelebihan berikut:
-
Ia menggunakan BRI sebagai isyarat perdagangan utama dan mempunyai kebolehpercayaan yang tinggi.
-
Reka bentuk penapis berbilang untuk mengelakkan kesilapan transaksi dan berkonsentrasi;
-
Hentikan, Hentikan Kerosakan, dan Lacak Kerosakan secara menyeluruh dan fleksibel;
-
Tetapan kerugian maksimum dalam satu hari yang berkesan mengawal penarikan balik dalam satu hari.
-
Ia sesuai untuk pasaran yang sedang berkembang dan mempunyai potensi pendapatan yang besar.
Analisis risiko
Strategi ini juga mempunyai risiko:
-
Kesan Brin Belt mudah terbentuk di bahagian kepala dan bahagian bawah, yang boleh menyebabkan kerosakan;
-
Dalam pasaran yang sempit, penapis mungkin terlalu ketat dan terlepas peluang untuk berdagang;
-
Ia boleh menyebabkan kerosakan langsung di atas paras paras penangguhan;
-
Dalam keadaan yang melampau, kerugian besar tidak dapat dielakkan sepenuhnya.
Untuk menghadapi risiko di atas, syarat penapisan boleh dikurangkan dengan sewajarnya, atau campur tangan buatan menutup beberapa kedudukan, mengurangkan jarak hentikan kerugian dan sebagainya.
Arah pengoptimuman
Strategi ini boleh dipertimbangkan untuk dioptimumkan dalam beberapa aspek:
-
Mencuba kombinasi parameter yang berbeza untuk mencari ruang parameter yang terbaik;
-
Menambah model pembelajaran mesin untuk mengoptimumkan parameter secara dinamik;
-
Penyelidikan cara yang lebih berkesan untuk menghentikan kerosakan, seperti menghentikan masa, menghentikan amplitudo;
-
Mengambil tindakan proaktif dalam keadaan yang melampau, digabungkan dengan penunjuk emosi;
-
Menggabungkan produk yang berkaitan, untuk membuat penilaian statistik.
ringkaskan
Strategi Brin Belt Breakout adalah strategi mengikuti trend garis pendek yang dipercayai. Ia menggunakan indikator Brin Belt sebagai isyarat dan menetapkan pelbagai penapis untuk memastikan kebolehpercayaan isyarat. Pada masa yang sama, mekanisme kawalan risiko dan kawalan risiko menyeluruh mengawal risiko.
- 1