Purata Pergerakan dan Strategi Indeks Kekuatan Relatif

Gambaran keseluruhan
Strategi Indeks Jangkaus Rata-rata Bergerak (Moving Average Relative Strength Index Strategy) adalah strategi perdagangan kuantitatif yang menggunakan purata bergerak dan indeks kekuatan relatif sebagai isyarat perdagangan. Strategi ini menghasilkan isyarat perdagangan dengan membandingkan nilai purata bergerak harga dan indeks kekuatan relatif untuk menangkap peluang dalam trend pasaran.
Prinsip Strategi
Strategi ini berdasarkan kepada dua indikator:
- Purata bergerak sederhana ((SMA): mencerminkan trend purata harga.
- RSI (Relative Strength Index): Mencerminkan kelemahan harga.
Strategi ini berbunyi:
Apabila garisan penunjuk RSI di bawah purata bergerak adalah kawasan jual beli, ia dianggap sebagai saham yang diremehkan, menghasilkan isyarat beli; apabila garisan penunjuk RSI di atas purata bergerak adalah kawasan jual beli, ia dianggap sebagai saham yang diremehkan, menghasilkan isyarat jual beli.
Iaitu, purata bergerak mencerminkan nilai saksama saham hingga tahap tertentu, dan RSI mewakili keadaan kuat dan lemah saham sekarang. RSI lebih tinggi atau lebih rendah daripada purata bergerak bermaksud peluang untuk berbalik.
Secara khusus, strategi ini menghasilkan isyarat perdagangan melalui langkah-langkah berikut:
- Mengira nilai RSI saham, dan purata bergerak mudah
- Perbandingan RSI dengan purata bergerak
- Apabila RSI melintasi purata bergerak, ia menghasilkan isyarat jual
- Apabila RSI melintasi purata bergerak di bawah, ia menghasilkan isyarat beli.
- Tetapkan titik hentian dan bergerak hentian untuk mengawal risiko
Kelebihan Strategik
Strategi ini menggabungkan penilaian trend pada purata bergerak dan penilaian overbought dan oversold pada RSI, dan menggunakan kelebihan indikator yang berbeza untuk menilai titik perubahan pasaran.
Kelebihan utama:
- Rata-rata Bergerak Berkesan Untuk Menunjukkan Trend Harga
- Indeks RSI boleh mencerminkan kegemilangan
- Gabungan Dua Indikator Untuk Menentukan Titik Peralihan Pasar Dengan Lebih Tepat
- Anda boleh menetapkan titik berhenti untuk mengawal risiko
Risiko Strategik
Strategi ini mempunyai beberapa risiko:
- Kebarangkalian untuk menghasilkan isyarat yang salah yang boleh menyebabkan kerugian yang tidak perlu
- Apabila keadaan bergolak, penangguhan boleh ditembusi dan menyebabkan kerugian yang lebih besar.
- Penetapan parameter yang tidak betul juga boleh menjejaskan prestasi polisi
Untuk mengawal risiko, anda boleh mengoptimumkannya dengan:
- Menyesuaikan parameter purata bergerak dan RSI untuk menjadikan isyarat penunjuk lebih dipercayai
- Melepaskan titik hentian yang sesuai untuk mengelakkan hentian yang terlalu kerap dicetuskan
- Penghentian yang lebih fleksibel menggunakan penghentian bergerak seperti DYNAMIC
Arah pengoptimuman strategi
Strategi ini boleh dioptimumkan dengan cara berikut:
- Uji kombinasi parameter dari pelbagai kitaran untuk mencari parameter terbaik
- Menambah penapisan untuk penunjuk lain, seperti penunjuk kuantiti, untuk meningkatkan kebolehpercayaan isyarat
- Mengoptimumkan strategi penangguhan kerugian untuk menjadikannya lebih dinamik dan munasabah
- Menubuhkan mekanisme pengoptimuman parameter adaptasi dengan menggabungkan teknologi seperti pembelajaran mendalam
- Tambah modul pengurusan kedudukan untuk menyesuaikan kedudukan secara dinamik mengikut keadaan pasaran
Strategi ini boleh terus meningkatkan kestabilan dan keuntungan melalui optimasi parameter, optimasi penunjuk, dan pengendalian risiko.
ringkaskan
Strategi purata bergerak dan indikator yang agak kuat menggunakan penilaian trend harga dan penilaian overbought dan oversold, dapat menentukan titik perubahan pasaran dengan berkesan dan menangkap peluang untuk berbalik. Strategi ini mudah digunakan, boleh dikawal risiko, dan merupakan strategi perdagangan kuantitatif yang praktikal. Dengan pengoptimuman berterusan, anda boleh mendapatkan kesan yang lebih baik.
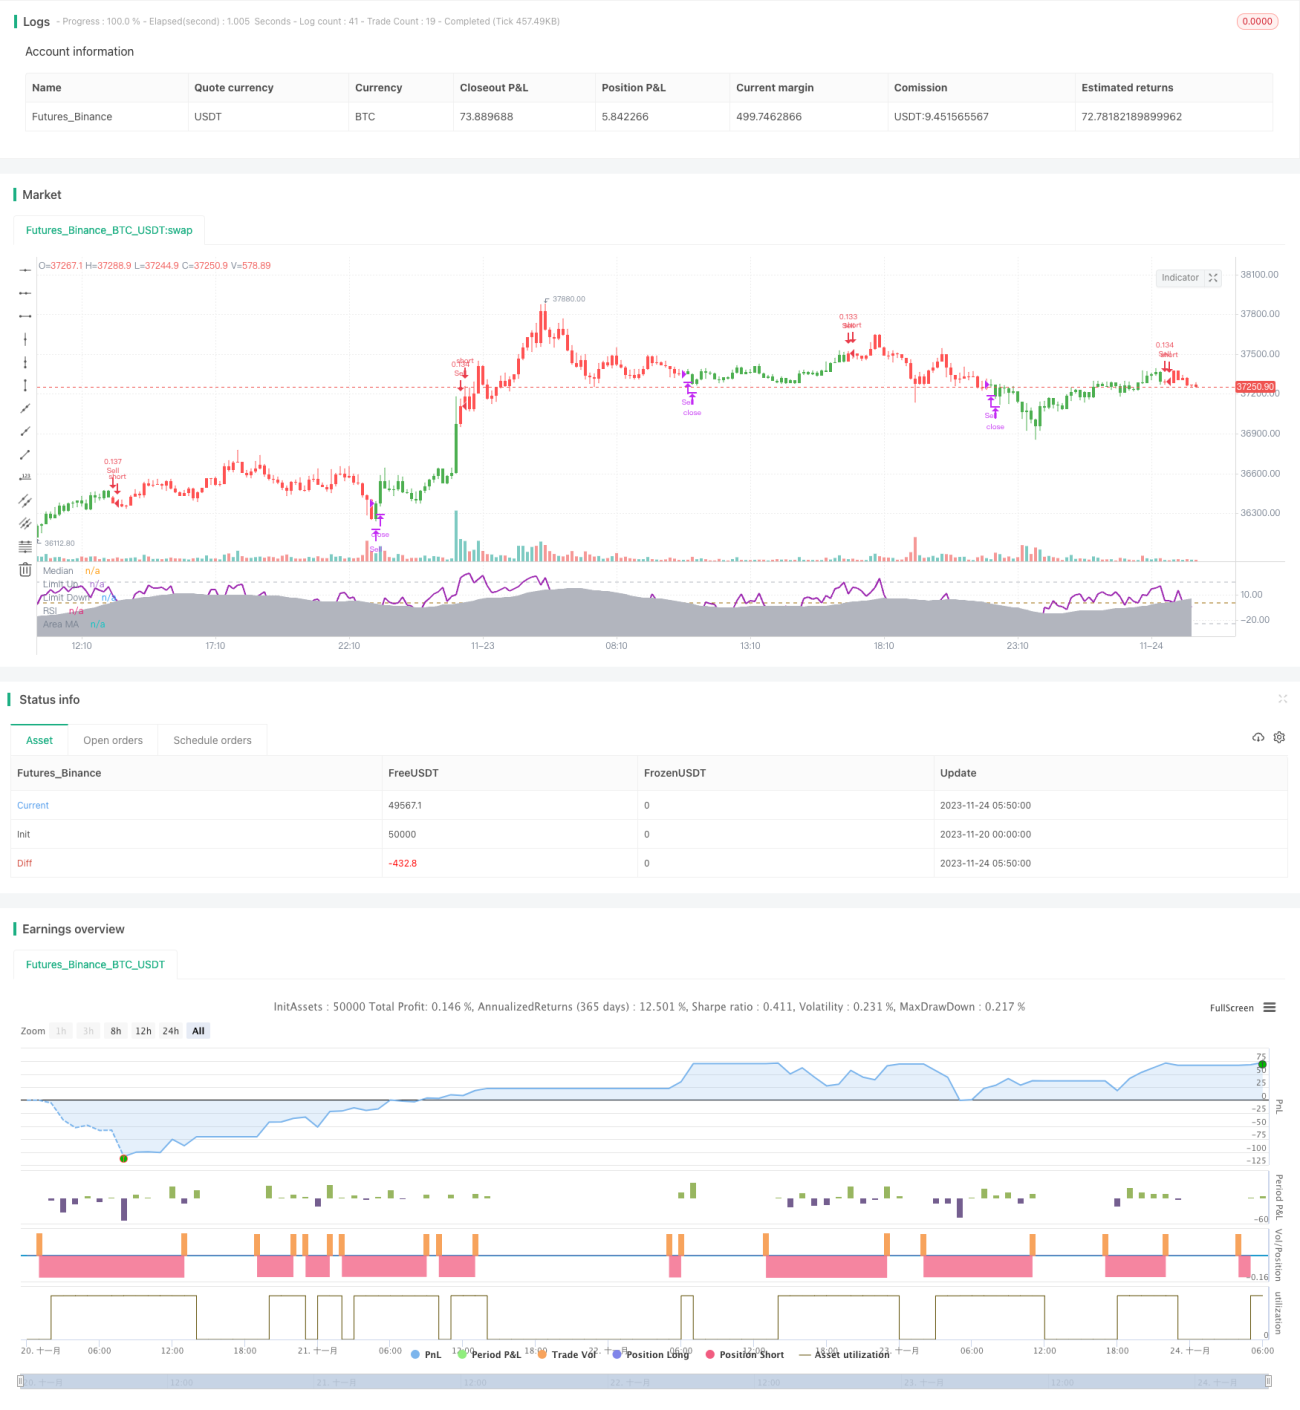
/*backtest
start: 2023-11-20 00:00:00
end: 2023-11-24 06:00:00
period: 10m
basePeriod: 1m
exchanges: [{"eid":"Futures_Binance","currency":"BTC_USDT"}]
*/

//@version=2

strategy(title = "RSI versus SMA", shorttitle = "RSI vs SMA", overlay = false, pyramiding = 0, default_qty_type = strategy.percent_of_equity, default_qty_value = 10, currency = currency.GBP)
- 1