Berdasarkan strategi arah aliran yang melanda dinamik
Gambaran keseluruhan
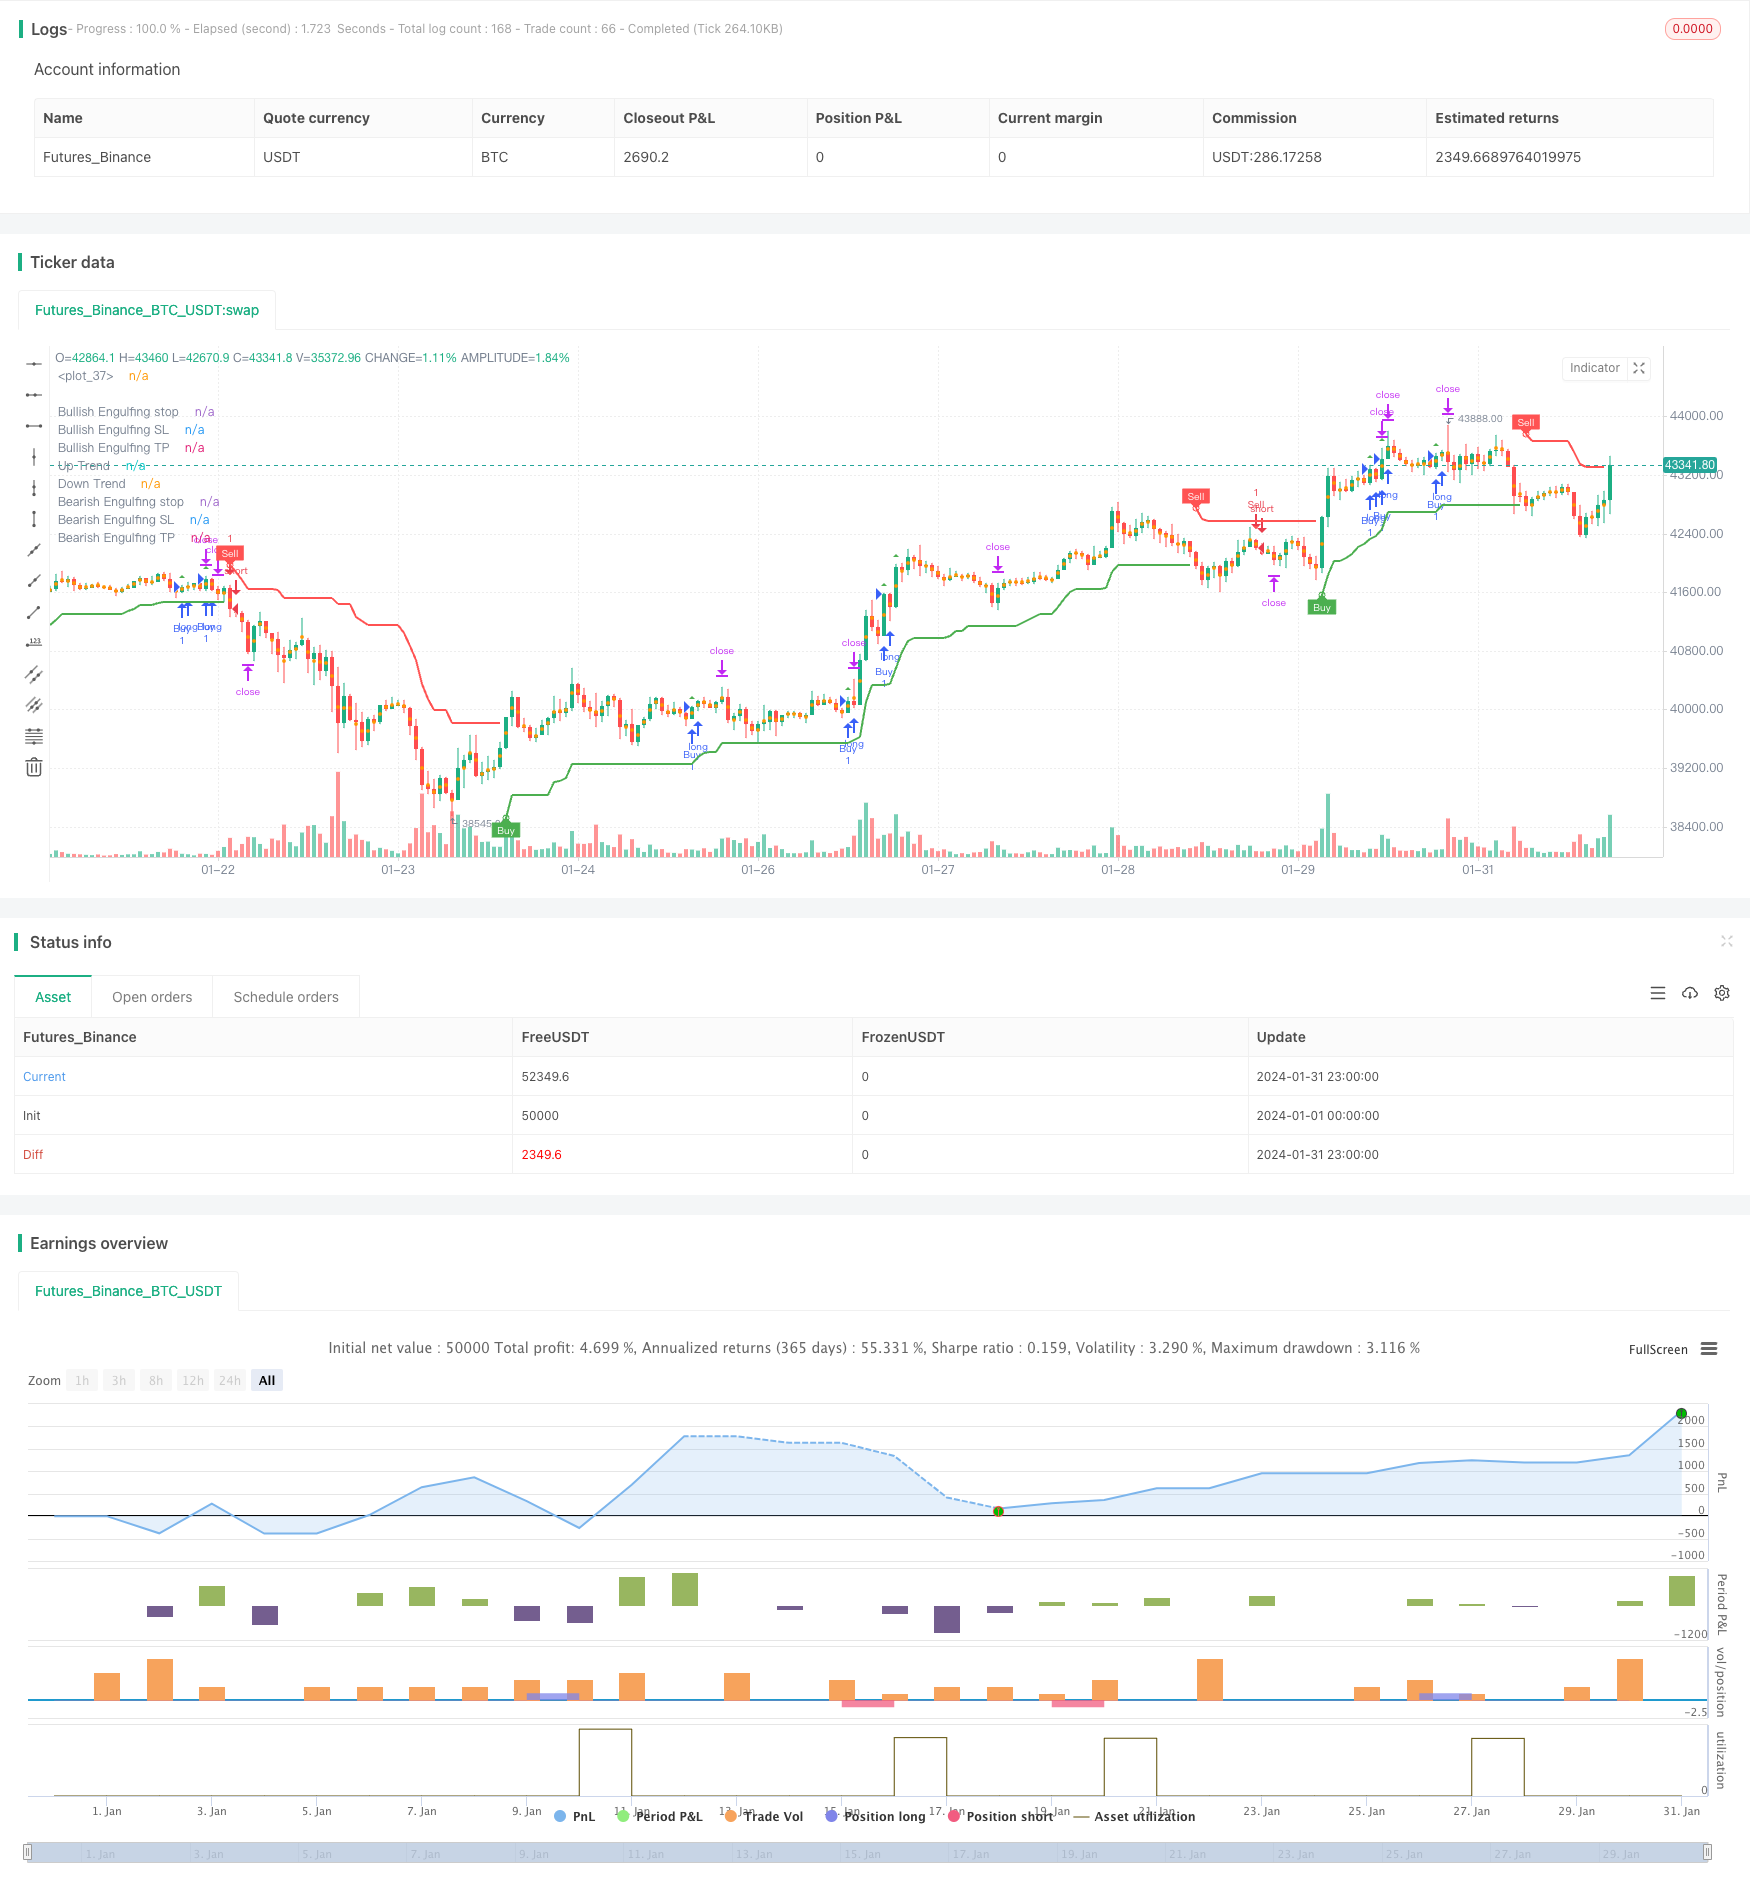
Strategi trend pemakan dinamik adalah strategi yang berdagang mengikut arah trend berdasarkan bentuk pemakan. Strategi ini menggunakan jangkauan rata-rata turun naik sebenar (ATR) untuk mengenal pasti turun naik pasaran, indikator super trend untuk menentukan arah trend pasaran, melakukan banyak operasi penyingkiran apabila sesuai dengan bentuk pemakan dan sesuai dengan arah trend.
Prinsip Strategi
- Mengira ATR, untuk mengukur kadar turun naik pasaran.
- Mengira indikator super trend untuk menentukan arah trend utama pasaran.
- Mendefinisikan pasaran berbilang dan pasaran kosong.
- Kenali bentuk pengambilan berbilang kepala (dalam trend naik) dan pengambilan kosong (dalam trend turun) yang sesuai dengan arah trend.
- Stop loss dan stop loss dikira mengikut bentuk pengambilan.
- Melakukan operasi tambahan atau kosong apabila anda mengenal pasti corak menelan dan sesuai dengan arah trend.
- Apabila harga menyentuh titik hentian atau titik hentian, anda akan melakukan kedudukan kosong.
- Tanda bentuk menelan dalam carta.
Analisis kelebihan strategi
Strategi ini mempunyai kelebihan berikut:
- Menambah kualiti isyarat perdagangan dengan menggabungkan corak pengapungan dan pengenalan trend.
- Ia boleh mengesan titik-titik perubahan trend, dan bertindak dengan tepat.
- Tanda-tanda pengosongan lebih jelas dan mudah untuk menguasai masa operasi.
- Strategi Stop Loss Swallow adalah strategi yang mengikuti trend dan mengawal risiko.
- Kerangka kod jelas, mudah dioptimumkan dan diperbaiki.
Analisis risiko strategi
Strategi ini mempunyai beberapa risiko:
- Pencerobohan mungkin palsu, kesalahan pengiktirafan boleh menyebabkan kerugian.
- Ia sukar untuk memahami parameter format seperti saiz volum, panjang masa dan sebagainya.
- Mekanisme penilaian trend tidak sempurna dan boleh menyebabkan operasi yang tidak sesuai dengan trend.
- Tetapan stop loss dan stop loss bergantung kepada pengalaman dan mungkin terlalu subjektif.
- Kesan bergantung kepada pengoptimuman parameter, yang memerlukan banyak pengesahan data sejarah.
Risiko-risiko tersebut boleh dikawal dan diperbaiki dengan cara berikut:
- Gabungan dengan petunjuk teknikal lain menapis isyarat penembusan palsu.
- Menggunakan kaedah pengiraan parameter yang lebih mantap, seperti ATR yang disesuaikan.
- Meningkatkan kebolehpercayaan mekanisme penilaian trend, seperti memperkenalkan model pembelajaran mesin.
- Menggunakan kaedah seperti algoritma genetik untuk mencari kombinasi parameter terbaik.
- Uji ulang dalam tetingkap masa yang lebih lama untuk memastikan parameter stabil.
Arah pengoptimuman strategi
Strategi ini mempunyai banyak ruang untuk pengoptimuman:
- Model pembelajaran mesin boleh diperkenalkan untuk meningkatkan ketepatan penghakiman trend.
- Menggabungkan kaedah baru untuk mengenal pasti bentuk untuk meningkatkan pengiktirafan bentuk yang dimakan.
- Mengoptimumkan titik hentian anda secara dinamik dengan menggunakan strategi hentian hentian terkini.
- Strategi penembusan yang lebih sesuai untuk operasi garis pendek boleh dibangunkan berdasarkan data frekuensi tinggi.
- Ia boleh digunakan untuk penyesuaian parameter dan pengoptimuman untuk pelbagai jenis.
ringkaskan
Secara keseluruhannya, strategi trend pemakan dinamik digabungkan dengan penilaian trend yang tepat dengan bentuk pemakan yang ketara, membentuk strategi perdagangan yang masuk akal dengan ketepatan isyarat masuk, hentikan dan hentikan kerugian. Dalam proses penerapan, kestabilan dan keuntungan strategi dapat ditingkatkan lagi dengan pengoptimuman parameter, kawalan risiko dan pengenalan teknologi baru.
/*backtest
start: 2024-01-01 00:00:00
end: 2024-01-31 23:59:59
period: 1h
basePeriod: 15m
exchanges: [{"eid":"Futures_Binance","currency":"BTC_USDT"}]
*/

// This source code is subject to the terms of the Mozilla Public License 2.0 at https://mozilla.org/MPL/2.0/
// © Malikdrajat


//@version=4
strategy("Engulfing with Trend", overlay=true)

Periods = input(title="ATR Period", type=input.integer, defval=10)
src = input(hl2, title="Source")
Multiplier = input(title="ATR Multiplier", type=input.float, step=0.1, defval=3.0)
changeATR= input(title="Change ATR Calculation Method ?", type=input.bool, defval=true)
showsignals = input(title="Show Buy/Sell Signals ?", type=input.bool, defval=true)
highlighting = input(title="Highlighter On/Off ?", type=input.bool, defval=true)

atr2 = sma(tr, Periods)
atr= changeATR ? atr(Periods) : atr2

up=src-(Multiplier*atr)
up1 = nz(up[1],up)
up := close[1] > up1 ? max(up,up1) : up
dn=src+(Multiplier*atr)
dn1 = nz(dn[1], dn)
dn := close[1] < dn1 ? min(dn, dn1) : dn

trend = 1
trend := nz(trend[1], trend)
trend := trend == -1 and close > dn1 ? 1 : trend == 1 and close < up1 ? -1 : trend

upPlot = plot(trend == 1 ? up : na, title="Up Trend", style=plot.style_linebr, linewidth=2, color=color.green)
buySignal = trend == 1 and trend[1] == -1
plotshape(buySignal ? up : na, title="UpTrend Begins", location=location.absolute, style=shape.circle, size=size.tiny, color=color.green, transp=0)
plotshape(buySignal and showsignals ? up : na, title="Buy", text="Buy", location=location.absolute, style=shape.labelup, size=size.tiny, color=color.green, textcolor=color.white, transp=0)
dnPlot = plot(trend == 1 ? na : dn, title="Down Trend", style=plot.style_linebr, linewidth=2, color=color.red)
sellSignal = trend == -1 and trend[1] == 1
plotshape(sellSignal ? dn : na, title="DownTrend Begins", location=location.absolute, style=shape.circle, size=size.tiny, color=color.red, transp=0)
plotshape(sellSignal and showsignals ? dn : na, title="Sell", text="Sell", location=location.absolute, style=shape.labeldown, size=size.tiny, color=color.red, textcolor=color.white, transp=0)
mPlot = plot(ohlc4, title="", style=plot.style_circles, linewidth=0)
longFillColor = highlighting ? (trend == 1 ? color.green : color.white) : color.white
shortFillColor = highlighting ? (trend == -1 ? color.red : color.white) : color.white
fill(mPlot, upPlot, title="UpTrend Highligter", color=longFillColor)
fill(mPlot, dnPlot, title="DownTrend Highligter", color=shortFillColor)
alertcondition(buySignal, title="SuperTrend Buy", message="SuperTrend Buy!")
alertcondition(sellSignal, title="SuperTrend Sell", message="SuperTrend Sell!")
changeCond = trend != trend[1]
alertcondition(changeCond, title="SuperTrend Direction Change", message="SuperTrend has changed direction!")

// Define Downtrend and Uptrend conditions
downtrend = trend == -1
uptrend = trend == 1


// Engulfing
boringThreshold = input(25, title="Boring Candle Threshold (%)", minval=1, maxval=100, step=1)
engulfingThreshold = input(50, title="Engulfing Candle Threshold (%)", minval=1, maxval=100, step=1)
stopLevel = input(200, title="Stop Level (Pips)", minval=1)


// Boring Candle (Inside Bar) and Engulfing Candlestick Conditions
isBoringCandle = abs(open[1] - close[1]) * 100 / abs(high[1] - low[1]) <= boringThreshold
isEngulfingCandle = abs(open - close) * 100 / abs(high - low) <= engulfingThreshold

// Bullish and Bearish Engulfing Conditions
bullEngulfing = uptrend and close[1] < open[1] and close > open[1] and not isBoringCandle and not isEngulfingCandle
bearEngulfing = downtrend and close[1] > open[1] and close < open[1] and not isBoringCandle and not isEngulfingCandle

// Stop Loss, Take Profit, and Entry Price Calculation
bullStop = close + (stopLevel * syminfo.mintick)
bearStop = close - (stopLevel * syminfo.mintick)
bullSL = low
bearSL = high
bullTP = bullStop + (bullStop - low)
bearTP = bearStop - (high - bearStop)

// Entry Conditions
enterLong = bullEngulfing and uptrend
enterShort = bearEngulfing and downtrend

// Exit Conditions
exitLong = crossover(close, bullTP) or crossover(close, bullSL)
exitShort = crossover(close, bearTP) or crossover(close, bearSL)

// Check if exit conditions are met by the next candle
exitLongNextCandle = exitLong and (crossover(close[1], bullTP[1]) or crossover(close[1], bullSL[1]))
exitShortNextCandle = exitShort and (crossover(close[1], bearTP[1]) or crossover(close[1], bearSL[1]))

// Strategy Execution
strategy.entry("Buy", strategy.long, when=enterLong )
strategy.entry("Sell", strategy.short, when=enterShort )

// Exit Conditions for Long (Buy) Positions
if (bullEngulfing and not na(bullTP) and not na(bullSL))
    strategy.exit("Exit Long", from_entry="Buy", stop=bullSL, limit=bullTP)

// Exit Conditions for Short (Sell) Positions
if (bearEngulfing and not na(bearTP) and not na(bearSL))
    strategy.exit("Exit Short", from_entry="Sell", stop=bearSL, limit=bearTP)

// Plot Shapes and Labels
plotshape(bullEngulfing, style=shape.triangleup, location=location.abovebar, color=color.green)
plotshape(bearEngulfing, style=shape.triangledown, location=location.abovebar, color=color.red)

// Determine OP, SL, and TP
plot(bullEngulfing ? bullStop : na, title="Bullish Engulfing stop", color=color.red, linewidth=3, style=plot.style_linebr)
plot(bearEngulfing ? bearStop : na, title="Bearish Engulfing stop", color=color.red, linewidth=3, style=plot.style_linebr)
plot(bullEngulfing ? bullSL : na, title="Bullish Engulfing SL", color=color.red, linewidth=3, style=plot.style_linebr)
plot(bearEngulfing ? bearSL : na, title="Bearish Engulfing SL", color=color.red, linewidth=3, style=plot.style_linebr)
plot(bullEngulfing ? bullTP : na, title="Bullish Engulfing TP", color=color.green, linewidth=3, style=plot.style_linebr)
plot(bearEngulfing ? bearTP : na, title="Bearish Engulfing TP", color=color.green, linewidth=3, style=plot.style_linebr)