
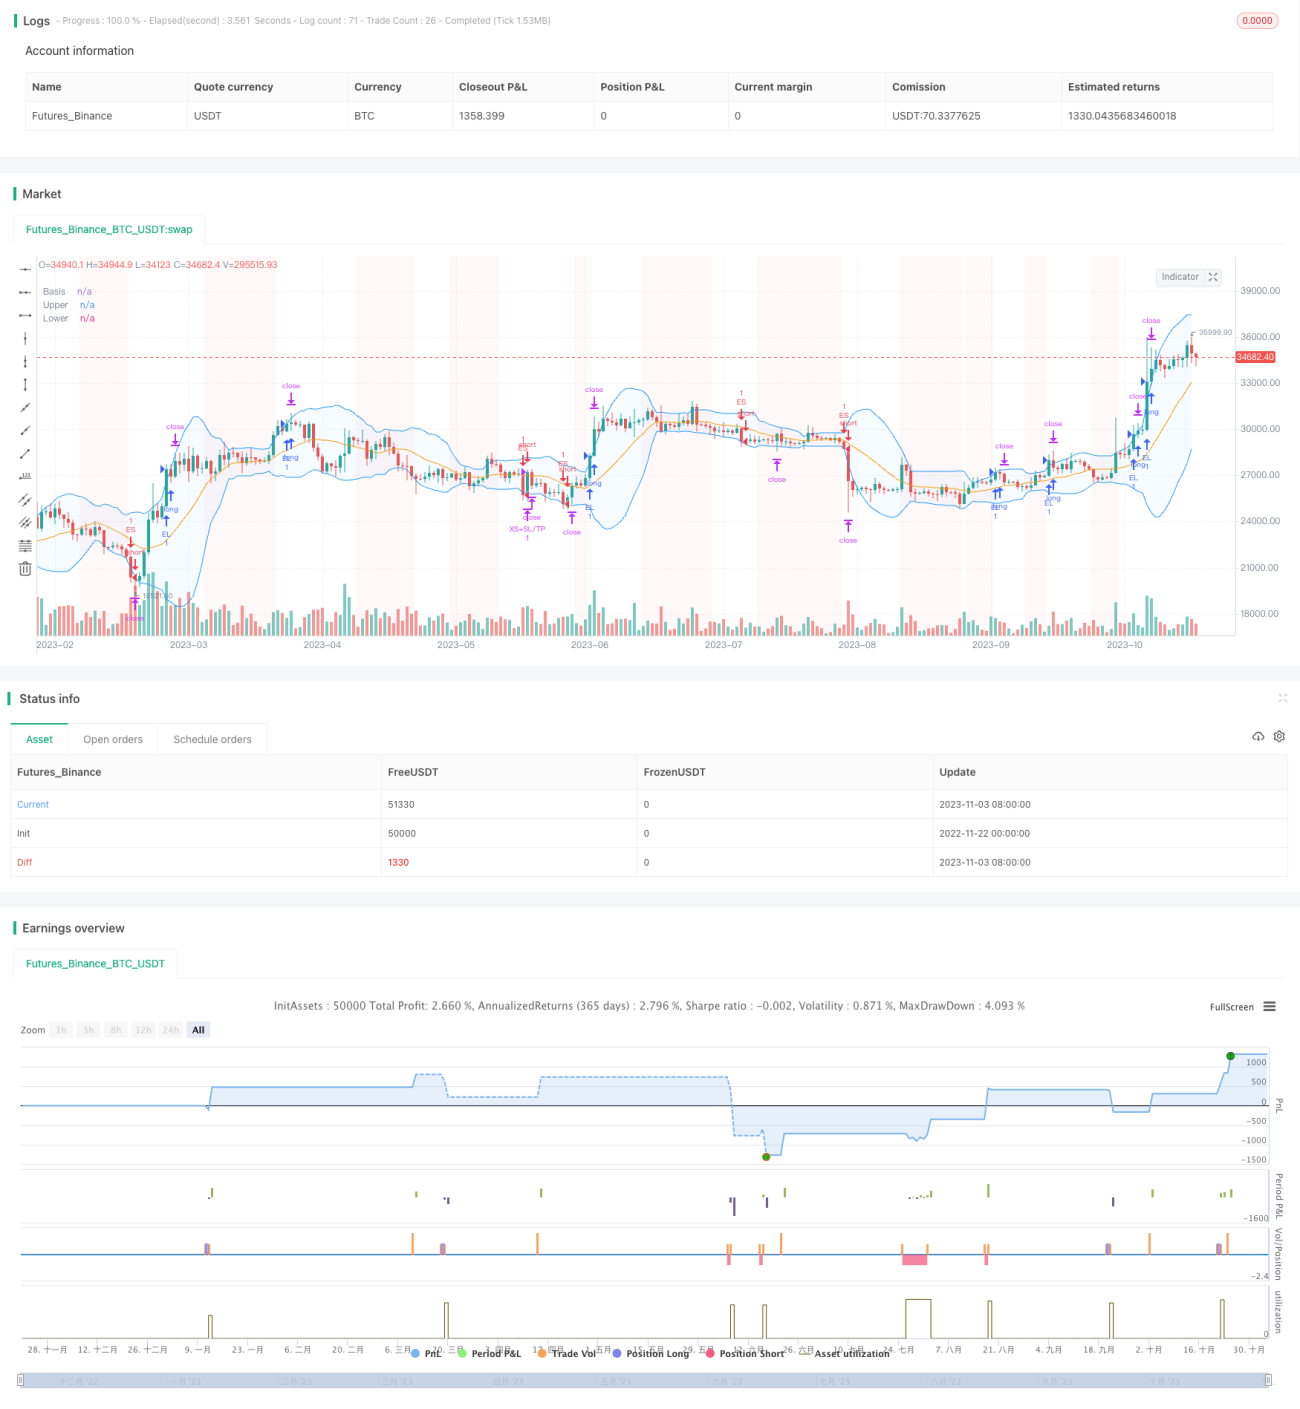
A estratégia de ruptura da faixa de Brin é uma estratégia de acompanhamento de tendências de curto prazo baseada no indicador da faixa de Brin. Pode executar operações em ambos os sentidos, seja em ativos ou em ativos baldios. Aplica-se a contratos de caixa e permanentes, especialmente em situações de tendência.
A estratégia possui alta configurabilidade, permitindo que o usuário configure os parâmetros de período e desvio da faixa de Bryn, filtros de tendência, filtros de volatilidade, filtros de direção de negociação, filtros de taxa de variação e filtros de data. Além disso, ele também configura stop loss, stop loss e stop loss de rastreamento para posições multihead e emptyhead, garantindo uma abordagem abrangente de gerenciamento de risco.
O indicador central da estratégia é a faixa de Brin. A faixa de Brin é composta por três linhas no meio, no topo e no fundo, que representam a linha média do preço, o limite superior e o limite inferior da oscilação. Quando o preço entra no topo, faça mais; quando o preço entra no fundo, faça menos.
Além disso, a estratégia tem vários filtros auxiliares para evitar transações de Noise. Estes filtros incluem:
Filtros de tendência: os preços estão acima da média móvel e abaixo da média móvel;
Filtro de volatilidade: negocie apenas quando a volatilidade aumenta;
Filtros de direção de negociação: opção de fazer apenas mais, fazer apenas menos ou negociar em ambos os sentidos, de acordo com os atributos do indicador;
Filtro de taxa de variação: os preços entram apenas quando atingem um determinado nível de variação em relação ao preço de fechamento do dia de negociação anterior;
Filtro de data: configuração do intervalo de tempo para a retrospecção.
O sinal de negociação é gerado quando todas as condições de filtragem são atendidas. O stop loss e o stop loss de rastreamento garantem a gestão de risco. Além disso, a configuração de perda máxima diária evita a retirada de um grande retorno diário.
A estratégia tem as seguintes vantagens:
O uso de um indicador bem-sucedido, o Binance, como sinal central de negociação, é altamente confiável.
O design de filtros múltiplos evita transações erradas e é altamente configurável;
“O que é que eu tenho que fazer?”
A configuração de perda máxima diária controla a retirada efetiva de um dia.
O mercado de tendências, com grande potencial de lucro.
A estratégia também tem riscos:
A ruptura do cinturão de Brin é propensa à formação de falsas rupturas na cabeça e na base, podendo causar danos;
Os filtros podem ser muito rígidos e perder oportunidades de negociação no mercado de liquidação;
Os grandes saltos podem causar danos diretos ao ultrapassar a linha de suspensão;
Em casos extremos, é impossível evitar grandes perdas.
Para os riscos acima mencionados, as condições de filtragem podem ser relaxadas adequadamente, ou a intervenção manual pode fechar algumas posições, reduzir a distância de parada, etc.
A estratégia pode ser melhorada nos seguintes aspectos:
Tentar diferentes combinações de parâmetros para encontrar o melhor intervalo de parâmetros;
Aumentar os modelos de aprendizagem de máquina para a otimização dinâmica dos parâmetros;
Pesquisar métodos mais eficazes de perda de tempo, como perda de tempo, perda de amplitude, etc.
A intervenção em situações extremas, combinada com indicadores emocionais;
Arbitragem estatística em combinação com produtos relevantes.
A estratégia de ruptura da faixa de Brin é uma estratégia de acompanhamento de tendências de curta duração e de confiança. Ela usa o indicador de Brin como sinal e configura filtros múltiplos para garantir a confiabilidade do sinal. Ao mesmo tempo, um mecanismo abrangente de stop loss e controle de risco controla o risco.
/*backtest
start: 2022-11-22 00:00:00
end: 2023-11-04 05:20:00
period: 1d
basePeriod: 1h
exchanges: [{"eid":"Futures_Binance","currency":"BTC_USDT"}]
*/
//@version=5
strategy("Bollinger Bands - Breakout Strategy",overlay=true
)
// Define the length of the Bollinger Bands
bbLengthInput = input.int (15,title="Length", group="Bollinger Bands", inline="BB")
bbDevInput = input.float (2.0,title="StdDev", group="Bollinger Bands", inline="BB")
// Define the settings for the Trend Filter
trendFilterInput = input.bool(false, title="Above/Below", group = "Trend Filter", inline="Trend")
trendFilterPeriodInput = input(223,title="", group = "Trend Filter", inline="Trend")
trendFilterType = input.string (title="", defval="EMA",options=["EMA","SMA","RMA", "WMA"], group = "Trend Filter", inline="Trend")
volatilityFilterInput = input.bool(true,title="StdDev", group = "Volatility Filter", inline="Vol")
volatilityFilterStDevLength = input(15,title="",group = "Volatility Filter", inline="Vol")
volatilityStDevMaLength = input(15,title=">MA",group = "Volatility Filter", inline="Vol")
// ROC Filter
// f_security function by LucF for PineCoders available here: https://www.tradingview.com/script/cyPWY96u-How-to-avoid-repainting-when-using-security-PineCoders-FAQ/
f_security(_sym, _res, _src, _rep) => request.security(_sym, _res, _src[not _rep and barstate.isrealtime ? 1 : 0])[_rep or barstate.isrealtime ? 0 : 1]
high_daily = f_security(syminfo.tickerid, "D", high, false)
roc_enable = input.bool(false, "", group="ROC Filter from CloseD", inline="roc")
roc_threshold = input.float(1, "Treshold", step=0.5, group="ROC Filter from CloseD", inline="roc")
closed = f_security(syminfo.tickerid,"1D",close, false)
roc_filter= roc_enable ? (close-closed)/closed*100 > roc_threshold : true
// Trade Direction Filter
// tradeDirectionInput = input.string("Auto",options=["Auto", "Long&Short","Long Only", "Short Only"], title="Trade", group="Direction Filter", tooltip="Auto: if a PERP is detected (in the symbol description), trade long and short\n Otherwise as per user-input")
// tradeDirection = switch tradeDirectionInput
// "Auto" => str.contains(str.lower(syminfo.description), "perp") or str.contains(str.lower(syminfo.description), ".p") ? strategy.direction.all : strategy.direction.long
// "Long&Short" => strategy.direction.all
// "Long Only" => strategy.direction.long
// "Short Only" => strategy.direction.short
// => strategy.direction.all
// strategy.risk.allow_entry_in(tradeDirection)
// Calculate and plot the Bollinger Bands
[bbMiddle, bbUpper, bbLower] = ta.bb (close, bbLengthInput, bbDevInput)
plot(bbMiddle, "Basis", color=color.orange)
bbUpperPlot = plot(bbUpper, "Upper", color=color.blue)
bbLowerrPlot = plot(bbLower, "Lower", color=color.blue)
fill(bbUpperPlot, bbLowerrPlot, title = "Background", color=color.new(color.blue, 95))
// Calculate and view Trend Filter
float tradeConditionMa = switch trendFilterType
"EMA" => ta.ema(close, trendFilterPeriodInput)
"SMA" => ta.sma(close, trendFilterPeriodInput)
"RMA" => ta.rma(close, trendFilterPeriodInput)
"WMA" => ta.wma(close, trendFilterPeriodInput)
// Default used when the three first cases do not match.
=> ta.wma(close, trendFilterPeriodInput)
trendConditionLong = trendFilterInput ? close > tradeConditionMa : true
trendConditionShort = trendFilterInput ? close < tradeConditionMa : true
plot(trendFilterInput ? tradeConditionMa : na, color=color.yellow)
// Calculate and view Volatility Filter
stdDevClose = ta.stdev(close,volatilityFilterStDevLength)
volatilityCondition = volatilityFilterInput ? stdDevClose > ta.sma(stdDevClose,volatilityStDevMaLength) : true
bbLowerCrossUnder = ta.crossunder(close, bbLower)
bbUpperCrossOver = ta.crossover(close, bbUpper)
bgcolor(volatilityCondition ? na : color.new(color.red, 95))
// Date Filter
start = input(timestamp("2017-01-01"), "Start", group="Date Filter")
finish = input(timestamp("2050-01-01"), "End", group="Date Filter")
date_filter = true
// Entry and Exit Conditions
entryLongCondition = bbUpperCrossOver and trendConditionLong and volatilityCondition and date_filter and roc_filter
entryShortCondition = bbLowerCrossUnder and trendConditionShort and volatilityCondition and date_filter and roc_filter
exitLongCondition = bbLowerCrossUnder
exitShortCondition = bbUpperCrossOver
// Orders
if entryLongCondition
strategy.entry("EL", strategy.long)
if entryShortCondition
strategy.entry("ES", strategy.short)
if exitLongCondition
strategy.close("EL")
if exitShortCondition
strategy.close("ES")
// Long SL/TP/TS
xl_ts_percent = input.float(2,step=0.5, title= "TS", group="Exit Long", inline="LTS", tooltip="Trailing Treshold %")
xl_to_percent = input.float(0.5, step=0.5, title= "TO", group="Exit Long", inline="LTS", tooltip="Trailing Offset %")
xl_ts_tick = xl_ts_percent * close/syminfo.mintick/100
xl_to_tick = xl_to_percent * close/syminfo.mintick/100
xl_sl_percent = input.float (2, step=0.5, title="SL",group="Exit Long", inline="LSLTP")
xl_tp_percent = input.float(9, step=0.5, title="TP",group="Exit Long", inline="LSLTP")
xl_sl_price = strategy.position_avg_price * (1-xl_sl_percent/100)
xl_tp_price = strategy.position_avg_price * (1+xl_tp_percent/100)
strategy.exit("XL+SL/TP", "EL", stop=xl_sl_price, limit=xl_tp_price, trail_points=xl_ts_tick, trail_offset=xl_to_tick,comment_loss= "XL-SL", comment_profit = "XL-TP",comment_trailing = "XL-TS")
// Short SL/TP/TS
xs_ts_percent = input.float(2,step=0.5, title= "TS",group="Exit Short", inline ="STS", tooltip="Trailing Treshold %")
xs_to_percent = input.float(0.5, step=0.5, title= "TO",group="Exit Short", inline ="STS", tooltip="Trailing Offset %")
xs_ts_tick = xs_ts_percent * close/syminfo.mintick/100
xs_to_tick = xs_to_percent * close/syminfo.mintick/100
xs_sl_percent = input.float (2, step=0.5, title="SL",group="Exit Short", inline="ESSLTP", tooltip="Stop Loss %")
xs_tp_percent = input.float(9, step=0.5, title="TP",group="Exit Short", inline="ESSLTP", tooltip="Take Profit %")
xs_sl_price = strategy.position_avg_price * (1+xs_sl_percent/100)
xs_tp_price = strategy.position_avg_price * (1-xs_tp_percent/100)
strategy.exit("XS+SL/TP", "ES", stop=xs_sl_price, limit=xs_tp_price, trail_points=xs_ts_tick, trail_offset=xs_to_tick,comment_loss= "XS-SL", comment_profit = "XS-TP",comment_trailing = "XS-TS")
max_intraday_loss = input.int(10, title="Max Intraday Loss (Percent)", group="Risk Management")
//strategy.risk.max_intraday_loss(max_intraday_loss, strategy.percent_of_equity)
// Monthly Returns table, modified from QuantNomad. Please put calc_on_every_tick = true to plot it.
monthly_table(int results_prec, bool results_dark) =>
new_month = month(time) != month(time[1])
new_year = year(time) != year(time[1])
eq = strategy.equity
bar_pnl = eq / eq[1] - 1
cur_month_pnl = 0.0
cur_year_pnl = 0.0
// Current Monthly P&L
cur_month_pnl := new_month ? 0.0 :
(1 + cur_month_pnl[1]) * (1 + bar_pnl) - 1
// Current Yearly P&L
cur_year_pnl := new_year ? 0.0 :
(1 + cur_year_pnl[1]) * (1 + bar_pnl) - 1
// Arrays to store Yearly and Monthly P&Ls
var month_pnl = array.new_float(0)
var month_time = array.new_int(0)
var year_pnl = array.new_float(0)
var year_time = array.new_int(0)
last_computed = false
if (not na(cur_month_pnl[1]) and (new_month or barstate.islast))
if (last_computed[1])
array.pop(month_pnl)
array.pop(month_time)
array.push(month_pnl , cur_month_pnl[1])
array.push(month_time, time[1])
if (not na(cur_year_pnl[1]) and (new_year or barstate.islast))
if (last_computed[1])
array.pop(year_pnl)
array.pop(year_time)
array.push(year_pnl , cur_year_pnl[1])
array.push(year_time, time[1])
last_computed := barstate.islast ? true : nz(last_computed[1])
// Monthly P&L Table
var monthly_table = table(na)
cell_hr_bg_color = results_dark ? #0F0F0F : #F5F5F5
cell_hr_text_color = results_dark ? #D3D3D3 : #555555
cell_border_color = results_dark ? #000000 : #FFFFFF
// ell_hr_bg_color = results_dark ? #0F0F0F : #F5F5F5
// cell_hr_text_color = results_dark ? #D3D3D3 : #555555
// cell_border_color = results_dark ? #000000 : #FFFFFF
if (barstate.islast)
monthly_table := table.new(position.bottom_right, columns = 14, rows = array.size(year_pnl) + 1, bgcolor=cell_hr_bg_color,border_width=1,border_color=cell_border_color)
table.cell(monthly_table, 0, 0, syminfo.tickerid + " " + timeframe.period, text_color=cell_hr_text_color, bgcolor=cell_hr_bg_color)
table.cell(monthly_table, 1, 0, "Jan", text_color=cell_hr_text_color, bgcolor=cell_hr_bg_color)
table.cell(monthly_table, 2, 0, "Feb", text_color=cell_hr_text_color, bgcolor=cell_hr_bg_color)
table.cell(monthly_table, 3, 0, "Mar", text_color=cell_hr_text_color, bgcolor=cell_hr_bg_color)
table.cell(monthly_table, 4, 0, "Apr", text_color=cell_hr_text_color, bgcolor=cell_hr_bg_color)
table.cell(monthly_table, 5, 0, "May", text_color=cell_hr_text_color, bgcolor=cell_hr_bg_color)
table.cell(monthly_table, 6, 0, "Jun", text_color=cell_hr_text_color, bgcolor=cell_hr_bg_color)
table.cell(monthly_table, 7, 0, "Jul", text_color=cell_hr_text_color, bgcolor=cell_hr_bg_color)
table.cell(monthly_table, 8, 0, "Aug", text_color=cell_hr_text_color, bgcolor=cell_hr_bg_color)
table.cell(monthly_table, 9, 0, "Sep", text_color=cell_hr_text_color, bgcolor=cell_hr_bg_color)
table.cell(monthly_table, 10, 0, "Oct", text_color=cell_hr_text_color, bgcolor=cell_hr_bg_color)
table.cell(monthly_table, 11, 0, "Nov", text_color=cell_hr_text_color, bgcolor=cell_hr_bg_color)
table.cell(monthly_table, 12, 0, "Dec", text_color=cell_hr_text_color, bgcolor=cell_hr_bg_color)
table.cell(monthly_table, 13, 0, "Year", text_color=cell_hr_text_color, bgcolor=cell_hr_bg_color)
for yi = 0 to array.size(year_pnl) - 1
table.cell(monthly_table, 0, yi + 1, str.tostring(year(array.get(year_time, yi))), text_color=cell_hr_text_color, bgcolor=cell_hr_bg_color)
y_color = array.get(year_pnl, yi) > 0 ? color.lime : array.get(year_pnl, yi) < 0 ? color.red : color.gray
table.cell(monthly_table, 13, yi + 1, str.tostring(math.round(array.get(year_pnl, yi) * 100, results_prec)), bgcolor = y_color)
for mi = 0 to array.size(month_time) - 1
m_row = year(array.get(month_time, mi)) - year(array.get(year_time, 0)) + 1
m_col = month(array.get(month_time, mi))
m_color = array.get(month_pnl, mi) > 0 ? color.lime : array.get(month_pnl, mi) < 0 ? color.red : color.gray
table.cell(monthly_table, m_col, m_row, str.tostring(math.round(array.get(month_pnl, mi) * 100, results_prec)), bgcolor = m_color)
results_prec = input(2, title = "Precision", group="Results Table")
results_dark = input.bool(defval=true, title="Dark Mode", group="Results Table")
monthly_table(results_prec, results_dark)