Estratégia de negociação de média móvel de amplo espectro oscilante
Visão geral
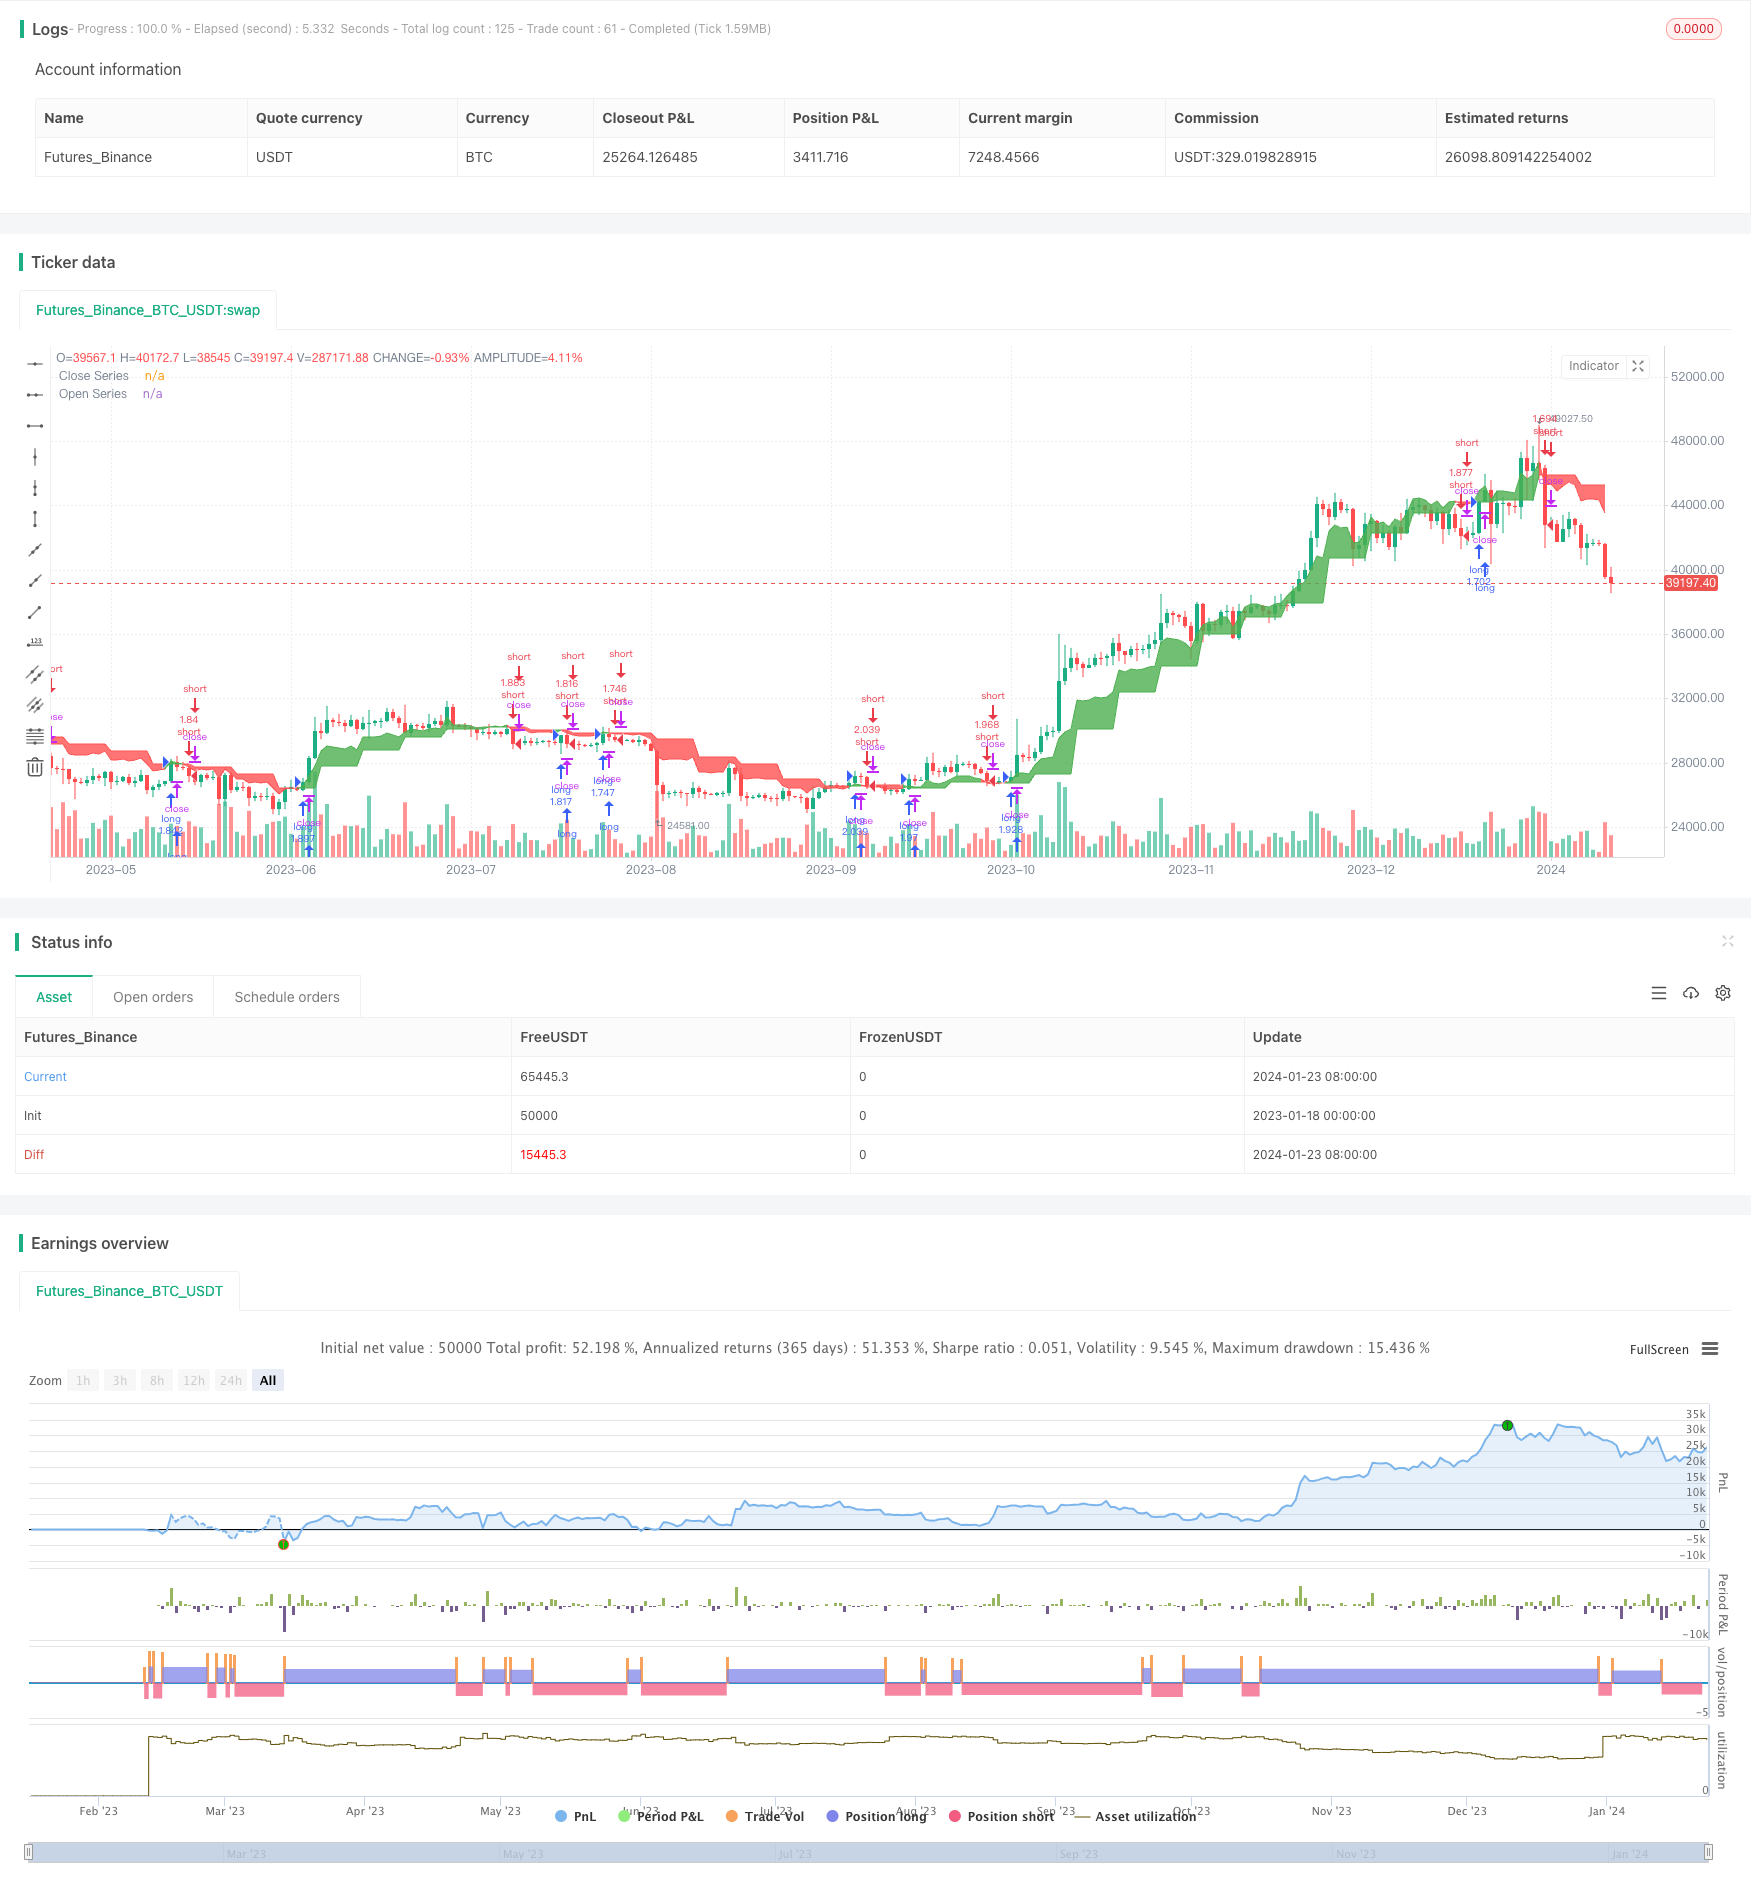
A estratégia baseia-se em uma média móvel de espectro amplo, formando um sinal de negociação através de um forquilho de ouro de uma média móvel rápida e lenta. A média móvel de espectro amplo abrange vários tipos, desde médias móveis simples até médias móveis oscilantes, e pode ser ajustada livremente por parâmetros, com uma forte adaptabilidade.
Princípio da estratégia
A estratégia usa uma função de média móvel variável, que pode gerar 12 tipos diferentes de média móvel. O princípio básico é calcular a média móvel rápida (Close MA) e a média móvel lenta (Open MA), que geram um sinal de compra quando a linha rápida atravessa a linha lenta e um sinal de venda quando a linha rápida atravessa a linha lenta. Ao mesmo tempo, configure um parâmetro de parada automática.
A lógica chave é gerar duas médias móveis através de funções variantes:closeSeries = variant(basisType, close, basisLen, offsetSigma, offsetALMA)eopenSeries = variant(basisType, open, basisLen, offsetSigma, offsetALMA)A função variante contém 12 tipos diferentes de métodos de medição de médias, que podem ser selecionados livremente através do parâmetro baseType. Assim, é possível combinar médias móveis de amplo espectro.
A lógica básica de geração de sinais de transação é:longCond = xlong e shortCond = xshort“O que eu faço é fazer mais na linha rápida e fazer menos na linha lenta”.
A regra de entrada da estratégia é fazer um extra-cancelamento quando a condição de longCond ou shortCond é satisfeita. A regra de parada de perda é parar ou parar quando o preço se move para atingir o número predeterminado de pontos de parada de perda.
Análise de vantagens
A maior vantagem da estratégia é a liberdade de combinar vários tipos diferentes de médias móveis. Em diferentes mercados, com diferentes ciclos, qual média móvel é mais adequada é incerto, a estratégia oferece uma poderosa capacidade de personalização. O usuário pode determinar o melhor conjunto de parâmetros por meio de testes repetidos, para criar o melhor projeto para um determinado mercado.
Outra vantagem é que a lógica da estratégia é simples e clara, mas oferece funções poderosas. É fácil para o usuário entender e usar a estratégia.
Análise de Riscos
O maior risco desta estratégia é que a própria média móvel de espectro amplo tem um certo atraso. Quando ocorre uma ruptura anormal dos preços, isso pode causar grandes perdas. Além disso, se os parâmetros forem escolhidos inadequadamente, isso pode levar a uma frequência de negociação excessiva ou a um excesso de sinais.
Para reduzir o risco, recomenda-se combinar outros indicadores para avaliar a eficácia do sinal e evitar falsas rupturas. Além disso, a otimização e a retrospectiva dos parâmetros também são necessárias, e é necessário testar repetidamente para encontrar a melhor combinação de parâmetros.
Direção de otimização
A estratégia tem as seguintes principais melhorias:
- Testar mais tipos de combinações de médias móveis para encontrar a melhor combinação
- Adicionar filtros para evitar falsos sinais, como por exemplo, a combinação de indicadores de volume de transação
- Optimizar os parâmetros de comprimento das médias móveis para encontrar o melhor parâmetro
- Optimizar o tamanho da posição e parâmetros de stop loss
- Experimente diferentes variedades e ciclos
Otimizando as várias direções acima, é possível melhorar continuamente o desempenho das estratégias no campo.
Resumir
A estratégia de negociação baseada em médias móveis de espectro amplo permite uma alta flexibilidade. Oferece uma poderosa funcionalidade de personalização, permitindo ao usuário escolher e combinar livremente diferentes tipos de médias. A lógica da estratégia é simples e clara, fácil de usar, mas também oferece um amplo espaço de otimização.
/*backtest
start: 2023-01-18 00:00:00
end: 2024-01-24 00:00:00
period: 1d
basePeriod: 1h
exchanges: [{"eid":"Futures_Binance","currency":"BTC_USDT"}]
*/

//@version=4
//

strategy(title="Long/Short", shorttitle="Banana Maker", overlay=true, pyramiding=0, default_qty_type=strategy.percent_of_equity, default_qty_value=100, calc_on_every_tick=false)


// === INPUTS ===
useRes = input(defval=true, title="Use Alternate Resolution?")
intRes = input(defval=7, title="Multiplier for Alernate Resolution")
stratRes = timeframe.ismonthly ? tostring(timeframe.multiplier * intRes, "###M") :
   timeframe.isweekly ? tostring(timeframe.multiplier * intRes, "###W") :
   timeframe.isdaily ? tostring(timeframe.multiplier * intRes, "###D") :
   timeframe.isintraday ? tostring(timeframe.multiplier * intRes, "####") : '60'
basisType = input(defval="DEMA", title="MA Type: ", options=["SMA", "EMA", "DEMA", "TEMA", "WMA", "VWMA", "SMMA", "HullMA", "LSMA", "ALMA", "SSMA", "TMA"])
basisLen = input(defval=8, title="MA Period", minval=1)
offsetSigma = input(defval=6, title="Offset for LSMA / Sigma for ALMA", minval=0)
offsetALMA = input(defval=0.85, title="Offset for ALMA", minval=0, step=0.01)
scolor = input(false, title="Show coloured Bars to indicate Trend?")
delayOffset = input(defval=0, title="Delay Open/Close MA (Forces Non-Repainting)", minval=0, step=1)
tradeType = input("BOTH", title="What trades should be taken : ", options=["LONG", "SHORT", "BOTH", "NONE"])
// === /INPUTS ===

// Constants colours that include fully non-transparent option.
green100 = #008000FF
lime100 = #6ad279
red100 = #FF0000FF
blue100 = #0000FFFF
aqua100 = #00FFFFFF
darkred100 = #8B0000FF
gray100 = #808080FF

// === BASE FUNCTIONS ===
variant(type, src, len, offSig, offALMA) =>
    v1 = sma(src, len)  // Simple
    v2 = ema(src, len)  // Exponential
    v3 = 2 * v2 - ema(v2, len)  // Double Exponential
    v4 = 3 * (v2 - ema(v2, len)) + ema(ema(v2, len), len)  // Triple Exponential
    v5 = wma(src, len)  // Weighted
    v6 = vwma(src, len)  // Volume Weighted
    v7 = 0.0
    sma_1 = sma(src, len)  // Smoothed
    v7 := na(v7[1]) ? sma_1 : (v7[1] * (len - 1) + src) / len
    v8 = wma(2 * wma(src, len / 2) - wma(src, len), round(sqrt(len)))  // Hull
    v9 = linreg(src, len, offSig)  // Least Squares
    v10 = alma(src, len, offALMA, offSig)  // Arnaud Legoux
    v11 = sma(v1, len)  // Triangular (extreme smooth)
    // SuperSmoother filter
    // © 2013  John F. Ehlers
    a1 = exp(-1.414 * 3.14159 / len)
    b1 = 2 * a1 * cos(1.414 * 3.14159 / len)
    c2 = b1
    c3 = -a1 * a1
    c1 = 1 - c2 - c3
    v12 = 0.0
    v12 := c1 * (src + nz(src[1])) / 2 + c2 * nz(v12[1]) + c3 * nz(v12[2])
    type == "EMA" ? v2 : type == "DEMA" ? v3 :
       type == "TEMA" ? v4 : type == "WMA" ? v5 : type == "VWMA" ? v6 :
       type == "SMMA" ? v7 : type == "HullMA" ? v8 : type == "LSMA" ? v9 :
       type == "ALMA" ? v10 : type == "TMA" ? v11 : type == "SSMA" ? v12 : v1

// security wrapper for repeat calls* NEEDS REFINEMENT- backtesting this shows repaint. need new wrapper
reso(exp, use, res) =>
    security_1 = security(syminfo.tickerid, res, exp, gaps=barmerge.gaps_off, lookahead=barmerge.lookahead_on)
    use ? security_1 : exp


// === /BASE FUNCTIONS ===

// === SERIES SETUP ===
closeSeries = variant(basisType, close[delayOffset], basisLen, offsetSigma, offsetALMA)
openSeries = variant(basisType, open[delayOffset], basisLen, offsetSigma, offsetALMA)
// === /SERIES ===

// === PLOTTING ===

// alt resulution
closeSeriesAlt = reso(closeSeries, useRes, stratRes)
openSeriesAlt = reso(openSeries, useRes, stratRes)
//
trendColour = closeSeriesAlt > openSeriesAlt ? color.green : color.red
bcolour = closeSeries > openSeriesAlt ? lime100 : red100
barcolor(scolor ? bcolour : na, title="Bar Colours")
closeP = plot(closeSeriesAlt, title="Close Series", color=trendColour, linewidth=0, style=plot.style_line, transp=1)
openP = plot(openSeriesAlt, title="Open Series", color=trendColour, linewidth=0, style=plot.style_line, transp=1)
fill(closeP, openP, color=trendColour, transp=80)

// === /PLOTTING ===
//

//
// === ALERT conditions

xlong = crossover(closeSeriesAlt, openSeriesAlt)
xshort = crossunder(closeSeriesAlt, openSeriesAlt)
longCond = xlong  // alternative: longCond[1]? false : (xlong or xlong[1]) and close>closeSeriesAlt and close>=open
shortCond = xshort  // alternative: shortCond[1]? false : (xshort or xshort[1]) and close<closeSeriesAlt and close<=open


// === /ALERT conditions. needs work in study mode. the banana maker is the study script.
// Create alert for cross, shunt back 1 if source is not 'open', this should prevent repaint issue.
//shunt = RSIsrc == open ? 0 : 1
//shunt = 0
//c_alert = (buy[shunt]==1 or sell[shunt]==1)
//alertcondition(c_alert, title="QQECROSS Alert", message="QQECROSS Alert")
// show only when alert condition is met and bar closed.
//plotshape(c_alert,title= "Alert Indicator Closed", location=location.bottom, color=sell[shunt]==1?red:green, transp=0, style=shape.circle)

//Repaint city, study mode will help but wont trigger the alerts


// === STRATEGY ===
// stop loss
slPoints = input(defval=0, title="Initial Stop Loss Points (zero to disable)", minval=0)
tpPoints = input(defval=0, title="Initial Target Profit Points (zero for disable)", minval=0)
// Include bar limiting algorithm
ebar = input(defval=1000, title="Number of Bars for Back Testing", minval=0)
dummy = input(false, title="- SET to ZERO for Daily or Longer Timeframes")
//
// Calculate how many mars since last bar
tdays = (timenow - time) / 60000.0  // number of minutes since last bar
tdays := timeframe.ismonthly ? tdays / 1440.0 / 5.0 / 4.3 / timeframe.multiplier :
   timeframe.isweekly ? tdays / 1440.0 / 5.0 / timeframe.multiplier :
   timeframe.isdaily ? tdays / 1440.0 / timeframe.multiplier :
   tdays / timeframe.multiplier  // number of bars since last bar
//
//set up exit parameters
TP = tpPoints > 0 ? tpPoints : na
SL = slPoints > 0 ? slPoints : na

// Make sure we are within the bar range, Set up entries and exit conditions
if (ebar == 0 or tdays <= ebar) and tradeType != "NONE"
    strategy.entry("long", strategy.long, when=longCond == true and tradeType != "SHORT")
    strategy.entry("short", strategy.short, when=shortCond == true and tradeType != "LONG")
    strategy.close("long", when=shortCond == true and tradeType == "LONG")
    strategy.close("short", when=longCond == true and tradeType == "SHORT")
    strategy.exit("XL", from_entry="long", profit=TP, loss=SL)
    strategy.exit("XS", from_entry="short", profit=TP, loss=SL)


// === /STRATEGY ===
// eof