Com base na estratégia de tendência dinâmica envolvente
Visão geral
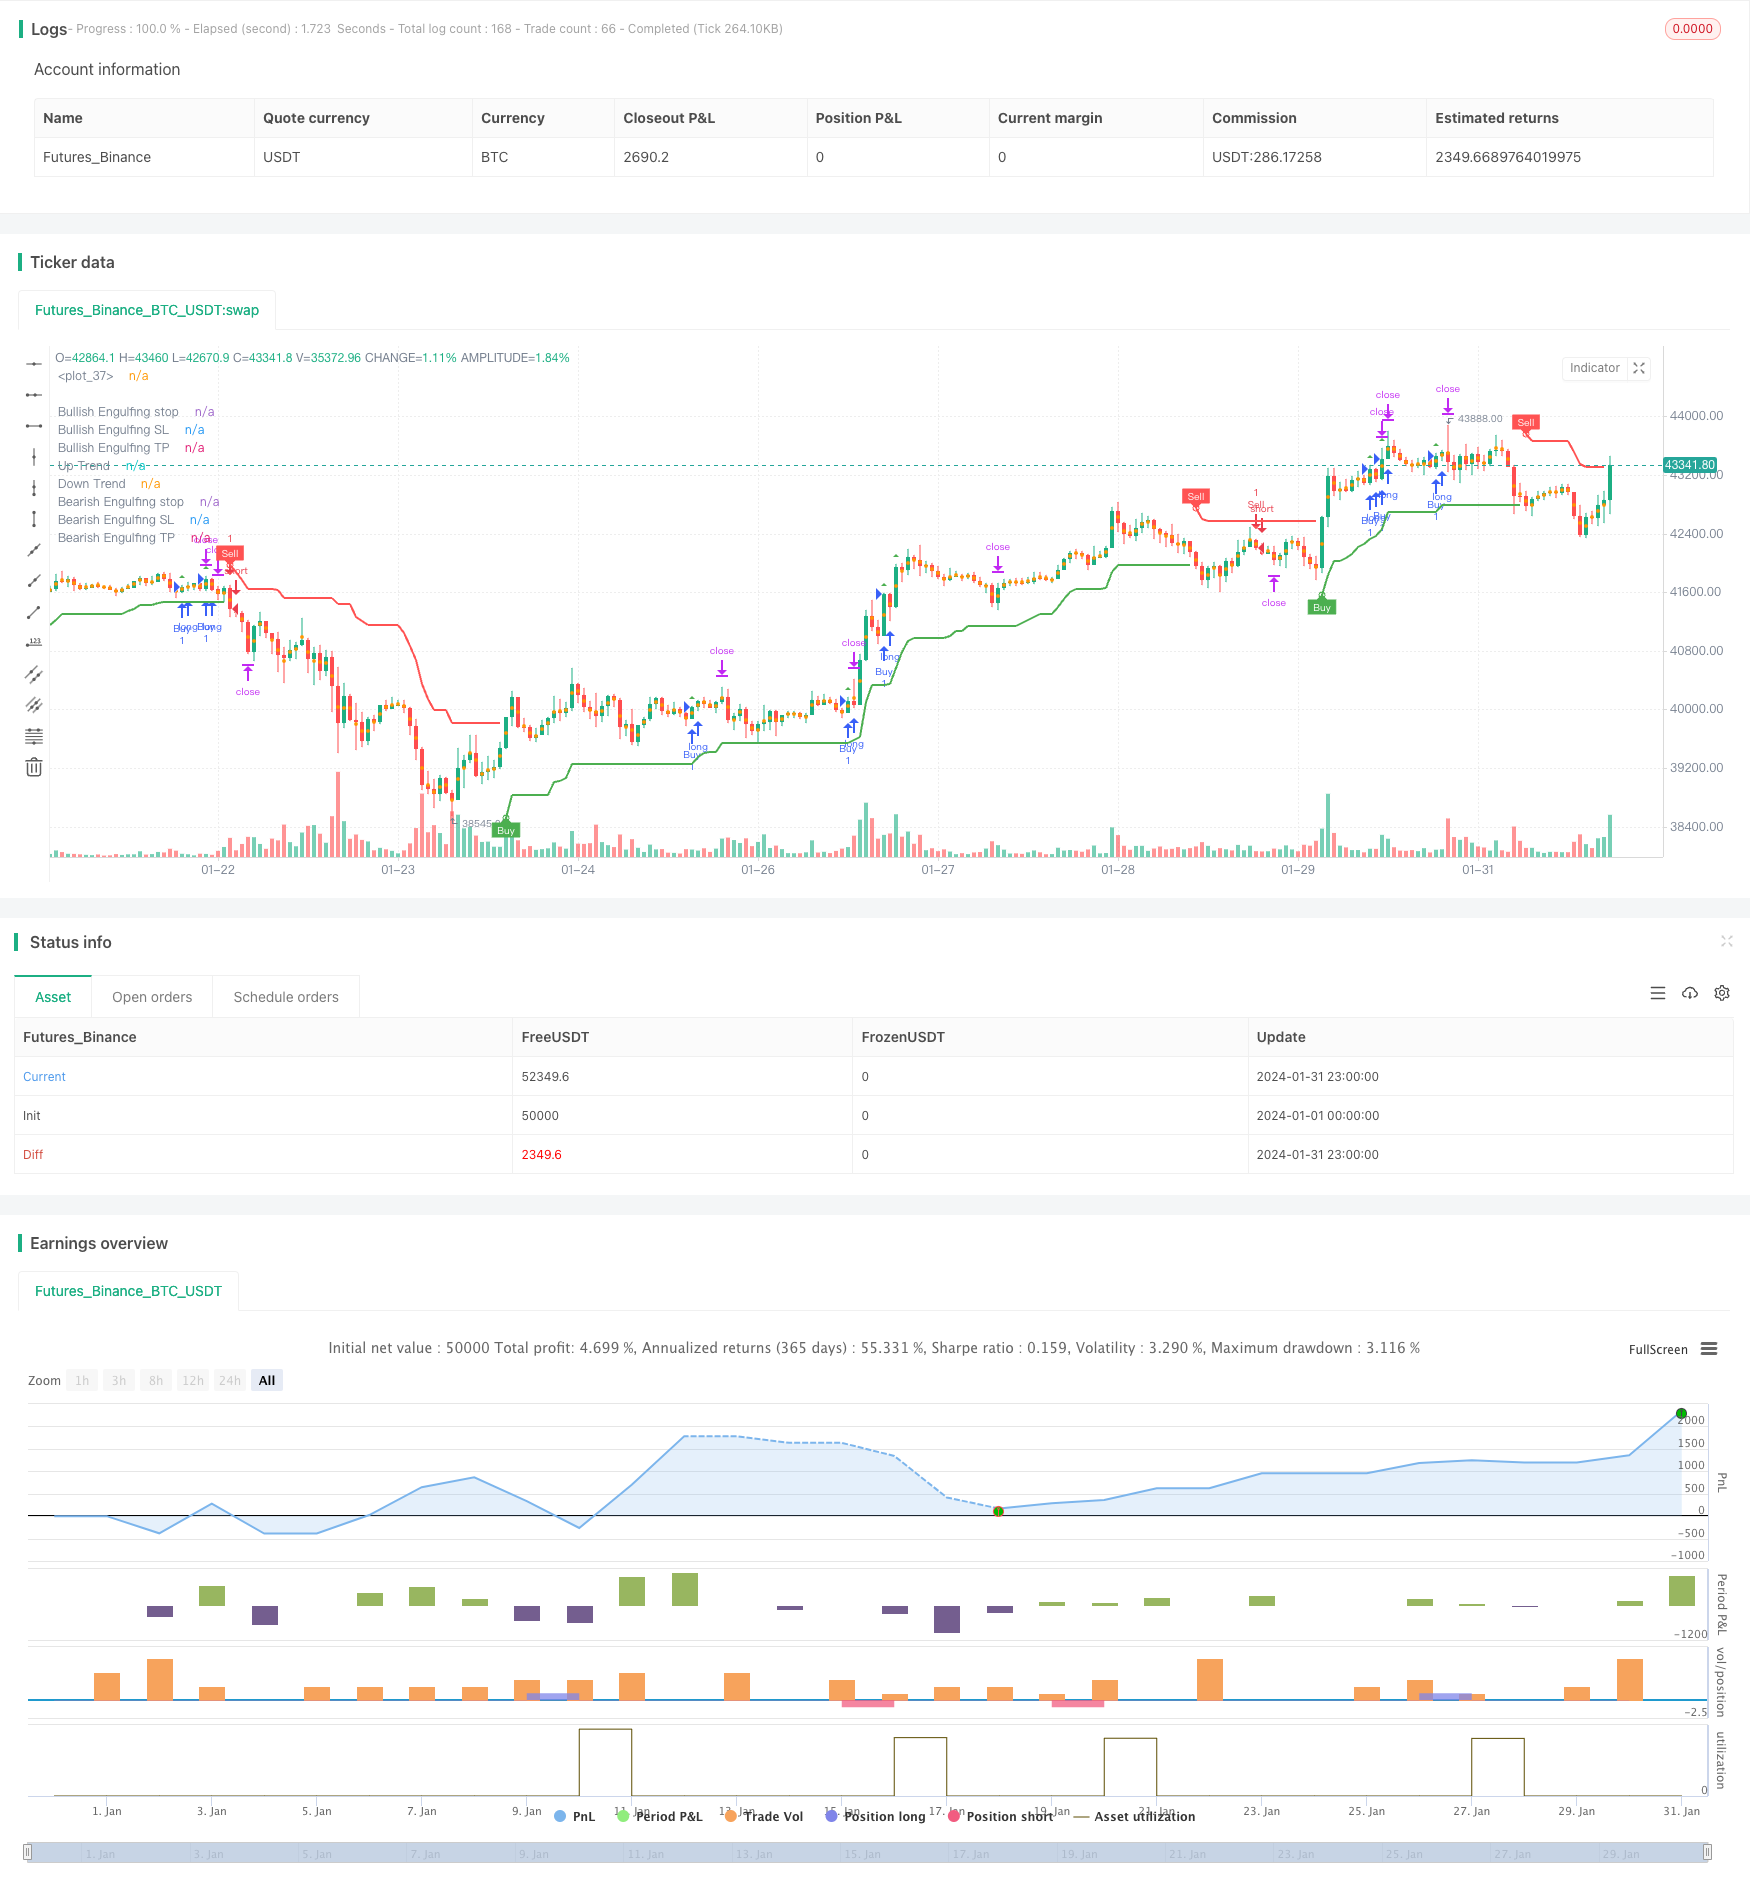
A estratégia de engorda dinâmica é uma estratégia de negociação na direção da tendência com base na forma de engorda. A estratégia usa a variabilidade do mercado para identificar a variabilidade do intervalo de flutuação real média (ATR), o indicador de super tendência para determinar a direção da tendência do mercado, fazendo uma operação de tomada de posse quando coincide com a forma de engorda e coincide com a direção da tendência.
Princípio da estratégia
- Calcule o ATR, que é usado para medir a volatilidade do mercado.
- Calcular indicadores de super tendências para determinar a direção das principais tendências do mercado.
- Definir as condições de mercado de títulos múltiplos e de mercado de títulos vazios.
- Identificar as formas de absorção multicapital (em alta) e absorção vazia (em baixa) em conformidade com a direção da tendência.
- Stop loss e stop loss são calculados de acordo com a forma de ingestão.
- Quando se identifica uma forma de absorção e coincide com a direção da tendência, a operação de fazer mais ou fazer menos é realizada.
- Quando o preço toca em um ponto de parada ou de perda, é feita uma parada.
- Identifique a forma de deglutição no gráfico.
Análise de vantagens estratégicas
A estratégia tem as seguintes vantagens:
- Combinando a absorção de formas com a identificação de tendências de sinais de negociação, para melhorar a qualidade do sinal.
- A capacidade de identificar os pontos de inflexão das tendências e de operar de forma direcionada.
- Os sinais são mais claros e fáceis de entender.
- A estratégia de Stop Loss Engulfamento segue a tendência e controla o risco.
- A estrutura do código é clara e fácil de otimizar e melhorar.
Análise de risco estratégico
A estratégia também apresenta alguns riscos:
- A forma de engolir pode ser uma falsa ruptura, e a identificação errada pode causar prejuízos.
- Dificuldade em entender os parâmetros do formato de engolir, como o tamanho do volume, a duração do tempo, etc.
- O mecanismo de avaliação de tendências é imperfeito e pode levar a operações que não correspondem a tendências.
- A configuração de stop loss e stop loss depende da experiência e pode ser muito subjetiva.
- O efeito depende da otimização de parâmetros, que requer uma grande quantidade de verificação de dados históricos.
Os riscos acima mencionados podem ser controlados e melhorados através dos seguintes métodos:
- Em combinação com outros indicadores técnicos, filtra os falsos sinais de ruptura.
- Utilizando métodos de cálculo de parâmetros mais robustos, como o ATR adaptado.
- Aumentar a fiabilidade dos mecanismos de avaliação de tendências, como a introdução de modelos de aprendizagem de máquina.
- O uso de algoritmos genéticos e outros meios para encontrar a melhor combinação de parâmetros.
- Retestando em uma janela de tempo mais longa para garantir a estabilidade dos parâmetros.
Direção de otimização da estratégia
A estratégia tem muito espaço para otimização:
- A introdução de modelos de aprendizagem de máquina pode melhorar a precisão do julgamento de tendências.
- Combinação de novos métodos de identificação de formas para melhorar a identificação de formas de engolir.
- Otimizar o ponto de parada e perda usando a estratégia de parada e perda mais recente.
- Pode-se desenvolver estratégias de ruptura de engorda baseadas em dados de alta frequência mais adequadas para operações de linha curta.
- Pode ser aplicado em diferentes variedades para ajuste e otimização de parâmetros.
Resumir
Em geral, a estratégia de engordar tendências dinâmicas, combinada com o julgamento de tendências com precisão, forma uma estratégia de negociação razoável. No processo de aplicação, a estabilidade e a lucratividade da estratégia podem ser aumentadas ainda mais através da otimização de parâmetros, controle de risco e introdução de novas tecnologias.
/*backtest
start: 2024-01-01 00:00:00
end: 2024-01-31 23:59:59
period: 1h
basePeriod: 15m
exchanges: [{"eid":"Futures_Binance","currency":"BTC_USDT"}]
*/

// This source code is subject to the terms of the Mozilla Public License 2.0 at https://mozilla.org/MPL/2.0/
// © Malikdrajat


//@version=4
strategy("Engulfing with Trend", overlay=true)

Periods = input(title="ATR Period", type=input.integer, defval=10)
src = input(hl2, title="Source")
Multiplier = input(title="ATR Multiplier", type=input.float, step=0.1, defval=3.0)
changeATR= input(title="Change ATR Calculation Method ?", type=input.bool, defval=true)
showsignals = input(title="Show Buy/Sell Signals ?", type=input.bool, defval=true)
highlighting = input(title="Highlighter On/Off ?", type=input.bool, defval=true)

atr2 = sma(tr, Periods)
atr= changeATR ? atr(Periods) : atr2

up=src-(Multiplier*atr)
up1 = nz(up[1],up)
up := close[1] > up1 ? max(up,up1) : up
dn=src+(Multiplier*atr)
dn1 = nz(dn[1], dn)
dn := close[1] < dn1 ? min(dn, dn1) : dn

trend = 1
trend := nz(trend[1], trend)
trend := trend == -1 and close > dn1 ? 1 : trend == 1 and close < up1 ? -1 : trend

upPlot = plot(trend == 1 ? up : na, title="Up Trend", style=plot.style_linebr, linewidth=2, color=color.green)
buySignal = trend == 1 and trend[1] == -1
plotshape(buySignal ? up : na, title="UpTrend Begins", location=location.absolute, style=shape.circle, size=size.tiny, color=color.green, transp=0)
plotshape(buySignal and showsignals ? up : na, title="Buy", text="Buy", location=location.absolute, style=shape.labelup, size=size.tiny, color=color.green, textcolor=color.white, transp=0)
dnPlot = plot(trend == 1 ? na : dn, title="Down Trend", style=plot.style_linebr, linewidth=2, color=color.red)
sellSignal = trend == -1 and trend[1] == 1
plotshape(sellSignal ? dn : na, title="DownTrend Begins", location=location.absolute, style=shape.circle, size=size.tiny, color=color.red, transp=0)
plotshape(sellSignal and showsignals ? dn : na, title="Sell", text="Sell", location=location.absolute, style=shape.labeldown, size=size.tiny, color=color.red, textcolor=color.white, transp=0)
mPlot = plot(ohlc4, title="", style=plot.style_circles, linewidth=0)
longFillColor = highlighting ? (trend == 1 ? color.green : color.white) : color.white
shortFillColor = highlighting ? (trend == -1 ? color.red : color.white) : color.white
fill(mPlot, upPlot, title="UpTrend Highligter", color=longFillColor)
fill(mPlot, dnPlot, title="DownTrend Highligter", color=shortFillColor)
alertcondition(buySignal, title="SuperTrend Buy", message="SuperTrend Buy!")
alertcondition(sellSignal, title="SuperTrend Sell", message="SuperTrend Sell!")
changeCond = trend != trend[1]
alertcondition(changeCond, title="SuperTrend Direction Change", message="SuperTrend has changed direction!")

// Define Downtrend and Uptrend conditions
downtrend = trend == -1
uptrend = trend == 1


// Engulfing
boringThreshold = input(25, title="Boring Candle Threshold (%)", minval=1, maxval=100, step=1)
engulfingThreshold = input(50, title="Engulfing Candle Threshold (%)", minval=1, maxval=100, step=1)
stopLevel = input(200, title="Stop Level (Pips)", minval=1)


// Boring Candle (Inside Bar) and Engulfing Candlestick Conditions
isBoringCandle = abs(open[1] - close[1]) * 100 / abs(high[1] - low[1]) <= boringThreshold
isEngulfingCandle = abs(open - close) * 100 / abs(high - low) <= engulfingThreshold

// Bullish and Bearish Engulfing Conditions
bullEngulfing = uptrend and close[1] < open[1] and close > open[1] and not isBoringCandle and not isEngulfingCandle
bearEngulfing = downtrend and close[1] > open[1] and close < open[1] and not isBoringCandle and not isEngulfingCandle

// Stop Loss, Take Profit, and Entry Price Calculation
bullStop = close + (stopLevel * syminfo.mintick)
bearStop = close - (stopLevel * syminfo.mintick)
bullSL = low
bearSL = high
bullTP = bullStop + (bullStop - low)
bearTP = bearStop - (high - bearStop)

// Entry Conditions
enterLong = bullEngulfing and uptrend
enterShort = bearEngulfing and downtrend

// Exit Conditions
exitLong = crossover(close, bullTP) or crossover(close, bullSL)
exitShort = crossover(close, bearTP) or crossover(close, bearSL)

// Check if exit conditions are met by the next candle
exitLongNextCandle = exitLong and (crossover(close[1], bullTP[1]) or crossover(close[1], bullSL[1]))
exitShortNextCandle = exitShort and (crossover(close[1], bearTP[1]) or crossover(close[1], bearSL[1]))

// Strategy Execution
strategy.entry("Buy", strategy.long, when=enterLong )
strategy.entry("Sell", strategy.short, when=enterShort )

// Exit Conditions for Long (Buy) Positions
if (bullEngulfing and not na(bullTP) and not na(bullSL))
    strategy.exit("Exit Long", from_entry="Buy", stop=bullSL, limit=bullTP)

// Exit Conditions for Short (Sell) Positions
if (bearEngulfing and not na(bearTP) and not na(bearSL))
    strategy.exit("Exit Short", from_entry="Sell", stop=bearSL, limit=bearTP)

// Plot Shapes and Labels
plotshape(bullEngulfing, style=shape.triangleup, location=location.abovebar, color=color.green)
plotshape(bearEngulfing, style=shape.triangledown, location=location.abovebar, color=color.red)

// Determine OP, SL, and TP
plot(bullEngulfing ? bullStop : na, title="Bullish Engulfing stop", color=color.red, linewidth=3, style=plot.style_linebr)
plot(bearEngulfing ? bearStop : na, title="Bearish Engulfing stop", color=color.red, linewidth=3, style=plot.style_linebr)
plot(bullEngulfing ? bullSL : na, title="Bullish Engulfing SL", color=color.red, linewidth=3, style=plot.style_linebr)
plot(bearEngulfing ? bearSL : na, title="Bearish Engulfing SL", color=color.red, linewidth=3, style=plot.style_linebr)
plot(bullEngulfing ? bullTP : na, title="Bullish Engulfing TP", color=color.green, linewidth=3, style=plot.style_linebr)
plot(bearEngulfing ? bearTP : na, title="Bearish Engulfing TP", color=color.green, linewidth=3, style=plot.style_linebr)