Стратегия тренда Супер Ишимоку

Обзор
Стратегия супер-одна - это стратегия торговли трендом, основанная на торговых решениях на основе показателей супер-одна. Эта стратегия использует линию преобразования, базовую линию и связь облачных полос супер-одной индикатора для определения направления текущей тенденции и в сочетании с отклонением цены для входа.
Стратегия супер-одна применяется в основном для торговли трендами на средних и длинных линиях, чтобы получить прибыль в более крупных тенденциях. Эта стратегия также обладает сильной способностью распознавать тенденции.
Стратегический принцип
Стратегия Hyper One основывается на следующих факторах, определяющих направление торговли:
-
**Отношения между конверсионной и базовой линиями:**Когда конверсионная линия была вверх, она была вверх, когда она была вниз, она была вниз.
-
**Цвета облачных полос:**Когда облака зеленые, смотрите вверх, когда красные - вниз.
-
**Цены изменились:**Для того, чтобы попасть на рынок, необходимо вернуть цены за пределами конверсионной линии и базовой линии.
В частности, стратегические торговые сигналы:
Позвони мне.
- Переводная линия выше базовой
- Цены выше конверсионной и базовой линий
- Трансформационная линия и эталонная линия выше облачного пояса
- Цены возвращаются ниже конверсионной и базовой линий
Сигналы отпуска:
- Трансформационная линия ниже базовой
- Цены ниже конверсионной и базовой линий
- Трансформационная линия и эталонная линия ниже облачной полосы
- Цены на обратном пути и выше базовой линии
При одновременном удовлетворении сигнала "делай больше / пусто", открытие позиции производится в соответствии с положением позиции.
Анализ преимуществ
Стратегия "Больше одного" имеет следующие преимущества:
-
Высокая точность определения направления тренда с использованием комбинации более одного показателя
-
Конверсионная линия и эталонная линия позволяют четко определить средне- и краткосрочные тенденции, а облачная полоса - долгосрочные тенденции
-
Условия, требующие, чтобы цена вернулась на поворотную линию, чтобы избежать убытков от ложных прорывов
-
Контроль риска использует наивысшую минимальную цену, установленную в течение последнего периода, чтобы эффективно контролировать одиночные потери
-
Уровень доходов и убытков более разумный.
-
Используется в различных циклах, подходит для торговли средними и длинными линиями
-
Стратегическая концепция ясна и понятна, есть много возможностей для оптимизации параметров
-
Успешно работает в различных рыночных условиях
Анализ рисков
Также существуют следующие риски:
-
В условиях волатильности рынка стоп-лосс может быть частым, что влияет на эффективность прибыли.
-
Невозможность вовремя изменить позицию при быстром изменении тренда может привести к убыткам
-
Установленный рентабельность не подходит для всех сортов и требует корректировки параметров для различных стандартов
-
Возможно, прибыль будет ограничена, если после прорыва в облачную полосу будет ограниченное пространство для подъема.
-
Параметры индикатора требуют повторного тестирования и оптимизации, не подходят для частого регулирования параметров
Риски можно снизить следующими способами:
-
Оптимизация параметров, чтобы они были более подходящими для различных циклов и разновидностей
-
В сочетании с другими показателями, фильтруйте входные сигналы, чтобы избежать ложных прорывов на волатильных рынках.
-
Динамическая настройка стоп-позиции, снижающая вероятность того, что стоп-потеря будет вызвана
-
Тестирование различных параметров прибыли и убытка
-
Использование методов, таких как графические формы, для определения силы трендового сигнала
Направление оптимизации
Стратегия "Больше одного" может быть оптимизирована в следующих аспектах:
-
Оптимизация параметров конверсионной и базовой линий, чтобы они соответствовали особенностям торгуемых сортов
-
Оптимизация параметров облачных поясов для более точного определения долгосрочных тенденций
-
Оптимизированные алгоритмы остановки, такие как установка остановки или динамическая остановка в соответствии с ATR
-
Фильтрация сигнала в сочетании с другими показателями, более широкие условия фильтрации, снижение вероятности ошибочного входа в игру
-
Оптимизация прибыльно-убыточных параметров, адаптация стратегии к различным сортам и циклическим особенностям
-
Мартингельский подход к управлению позициями, адаптированный к частоте колебаний рынка
-
Оптимизация параметров с использованием методов машинного обучения для повышения стабильности
-
Настройка различных торговых периодов для адаптации к особенностям рынка в ночное время и в промежуточное время
Подвести итог
В целом, стратегия супер-одна очень подходит для торговли средне- и долгосрочными тенденциями. Ее преимущества в определении направления тенденции в использовании показателей супер-одна очевидны, в то же время введение в сочетании с ценовой реверсией может эффективно предотвратить ошибочное введение.
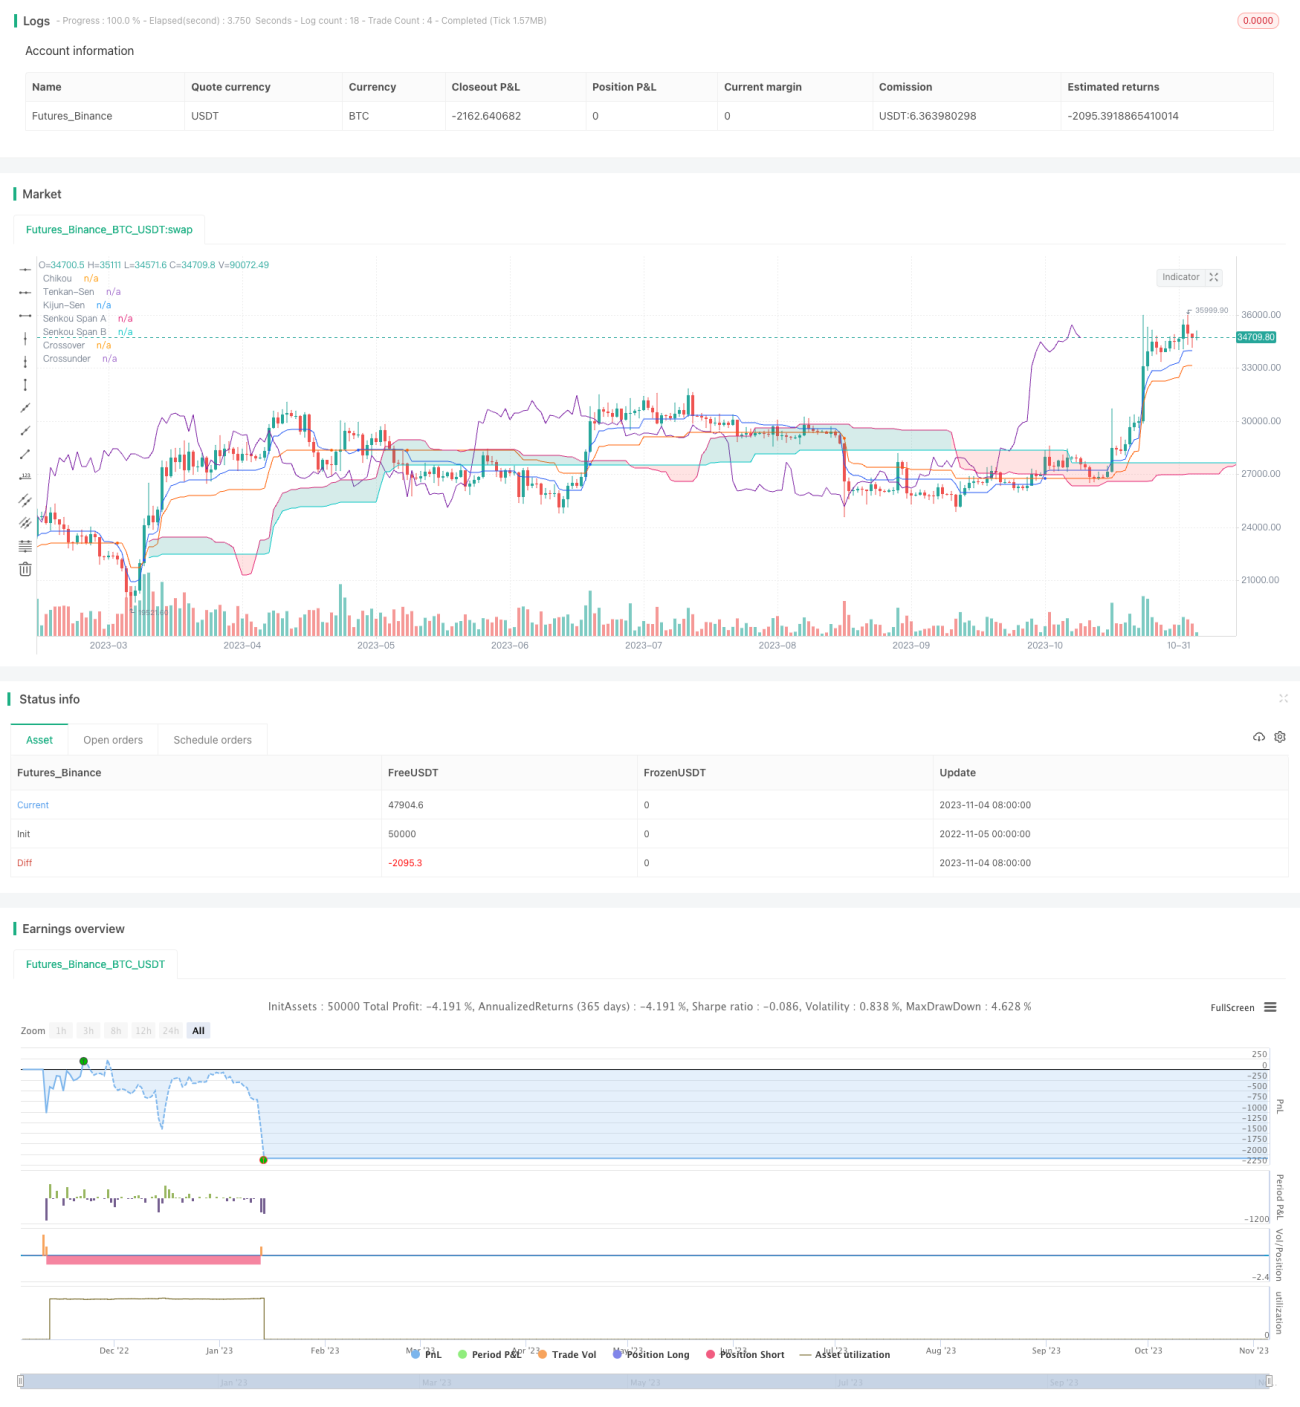
/*backtest
start: 2022-11-05 00:00:00
end: 2023-11-05 00:00:00
period: 1d
basePeriod: 1h
exchanges: [{"eid":"Futures_Binance","currency":"BTC_USDT"}]
*/

// Strategy based on the the SuperIchi indicator.
//
// Strategy was designed for the purpose of back testing.
// See strategy documentation for info on trade entry logic.- 1