Стратегия пересечения двухстороннего тренда после скользящей средней

1
Follow
1779
Followers
Обзор
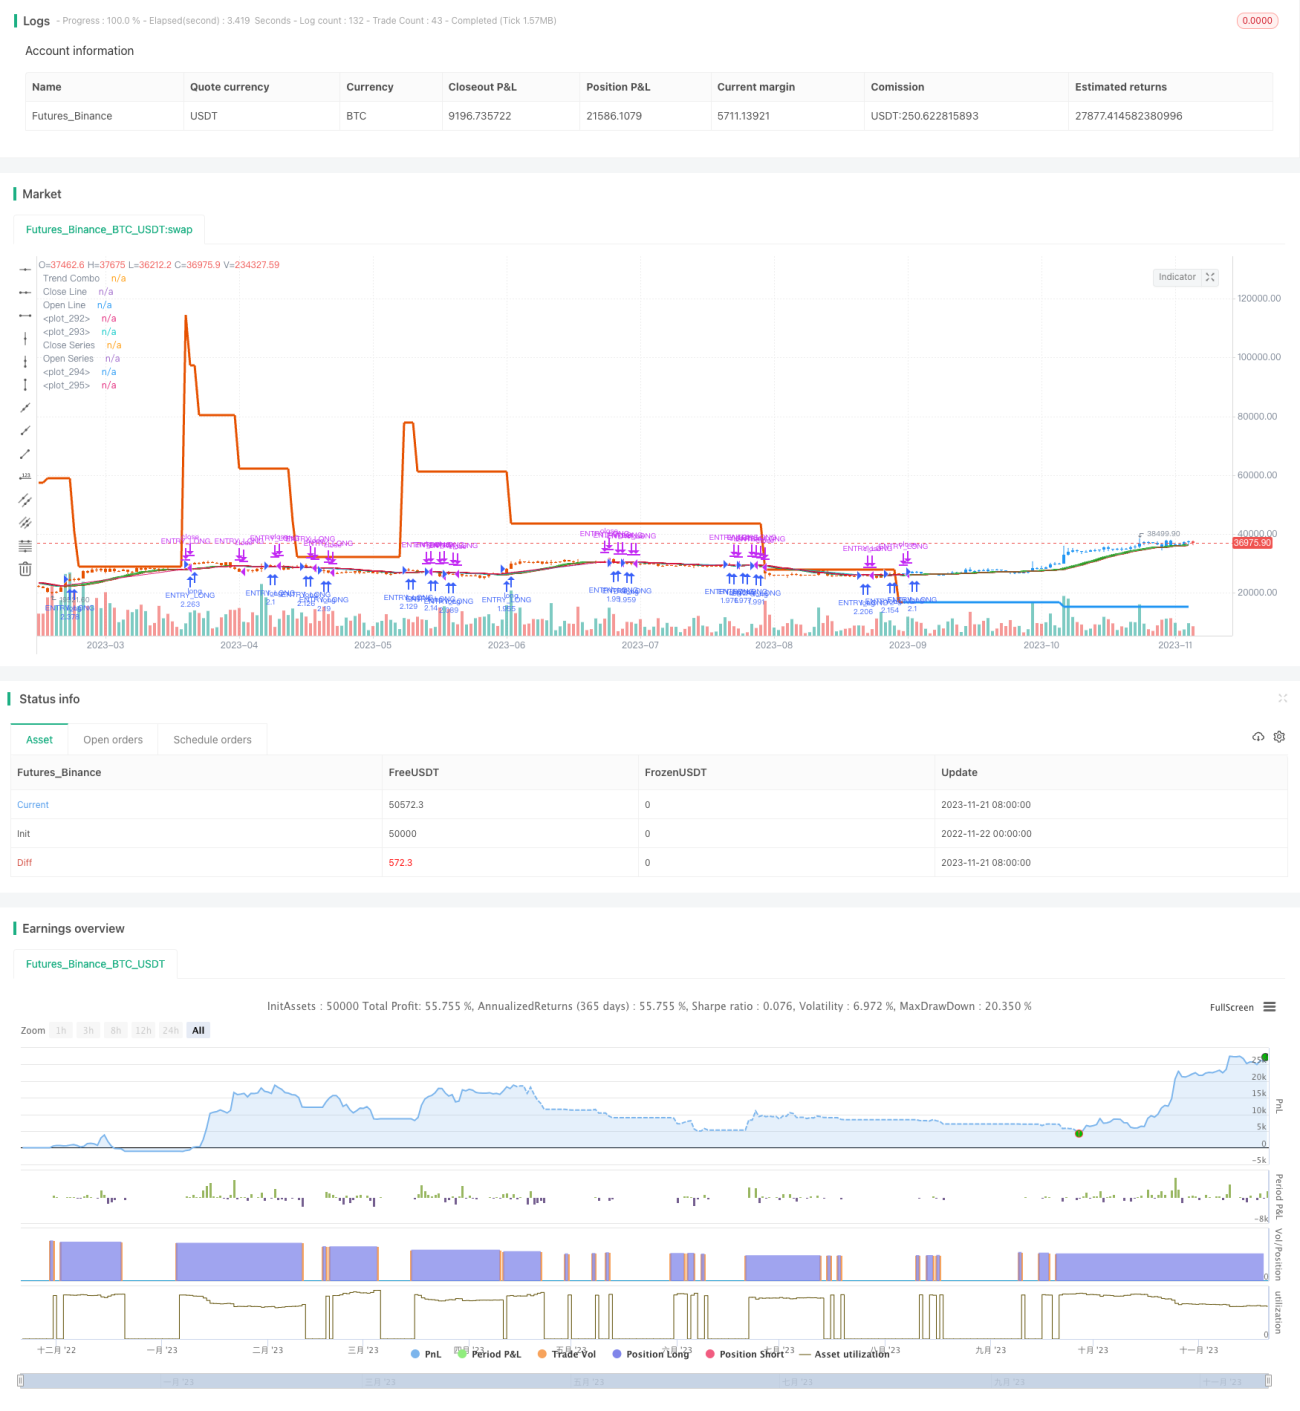
Эта стратегия реализует кросс-трейдинговую стратегию, которая позволяет автоматически отслеживать ценовые тенденции путем вычисления двунаправленных скользящих скользящих средних в сочетании с трендовыми индикаторами. Эта стратегия предназначена для отслеживания длительных тенденций и получения большей прибыли в сильных тенденциях.
Стратегический принцип
- Вычислить двунаправленное скольжение цены, включая средние цены открытия и средние цены закрытия.
- Показатель ценового тренда с использованием соответствующих коэффициентов и ATR.
- По сравнению с двусторонним скользящим средним, который используется в качестве индикатора ценовых тенденций, можно получить обобщенный анализ тенденций.
- При открытии средней цены и закрытии средней цены, когда происходит золотой форк, делается больше; при наступлении мертвой форк, когда происходит равновесие.
- При этом в сочетании с трендовым индикатором, только тогда, когда трендовый индикатор одновременно делает много, можно открыть позицию, чтобы сделать больше, и только тогда, когда трендовый индикатор одновременно делает пустое, можно открыть позицию, чтобы сделать пустое.
Стратегические преимущества
- Двунаправленные скользящие средние отслеживают ценовые тенденции более плавно и стабильно.
- В сочетании с трендовыми индикаторами, можно лучше определить направление тренда и избежать ошибочных сделок.
- Поскольку в Китае используются "золотые" и "мертвые" форки для определения конкретного времени сделки, то это становится более понятным.
- Свободный выбор может быть скорректирован с помощью параметров, чтобы адаптироваться к более широким рыночным условиям.
- В то же время, многие индикаторы проверяются друг с другом, что позволяет снизить количество ложных сигналов.
Стратегический риск
- Риск пропускать обратный поворот в точке переворота тренда. Можно снизить его, скорректировав цикличность скользящей средней.
- Двунаправленные скользящие средние сами по себе имеют большую отсталость и нуждаются в взаимной проверке с трендовыми показателями.
- Неправильный цикл скользящих средних может привести к слишком высокой частоте торгов или пропуску хорошего времени торгов.
- Необходимо многократно тестировать параметры оптимизации для адаптации к различным циклам и рыночным условиям.
Направление оптимизации стратегии
- Тест на более широкий спектр показателей скользящих средних
- Попробуйте другие типы трендовых индикаторов.
- Параметры оптимизации движущихся средних и трендовых индикаторов.
- Попробуйте комбинировать его с другими показателями, например, с показателями волатильности.
- Повышение стратегии по сдерживанию убытков.
Подвести итог
Эта стратегия прогнозирует ценовые тенденции с нескольких измерений и после оптимизации параметров может стабильно отслеживать длинные тенденции. Однако следует соблюдать осторожность, чтобы предотвратить чрезмерную оптимизацию и измерение. В целом, эта стратегия позволяет отслеживать длинные тенденции с меньшим риском и заслуживает дальнейшего изучения и применения.
Source
Pine
Strategy parameters
Related strategies
Comment
All comments (0)
No data
- 1