Стратегия отслеживания краткосрочного тренда на основе полос Боллинджера


Дата создания: 2023-11-23 17:01:12 Последнее изменение: 2023-11-23 17:01:12
Копировать: 0 Количество просмотров: 706
1
Подписаться
1617
Подписчики

Стратегия отслеживания краткосрочного тренда на основе полос Боллинджера

Обзор

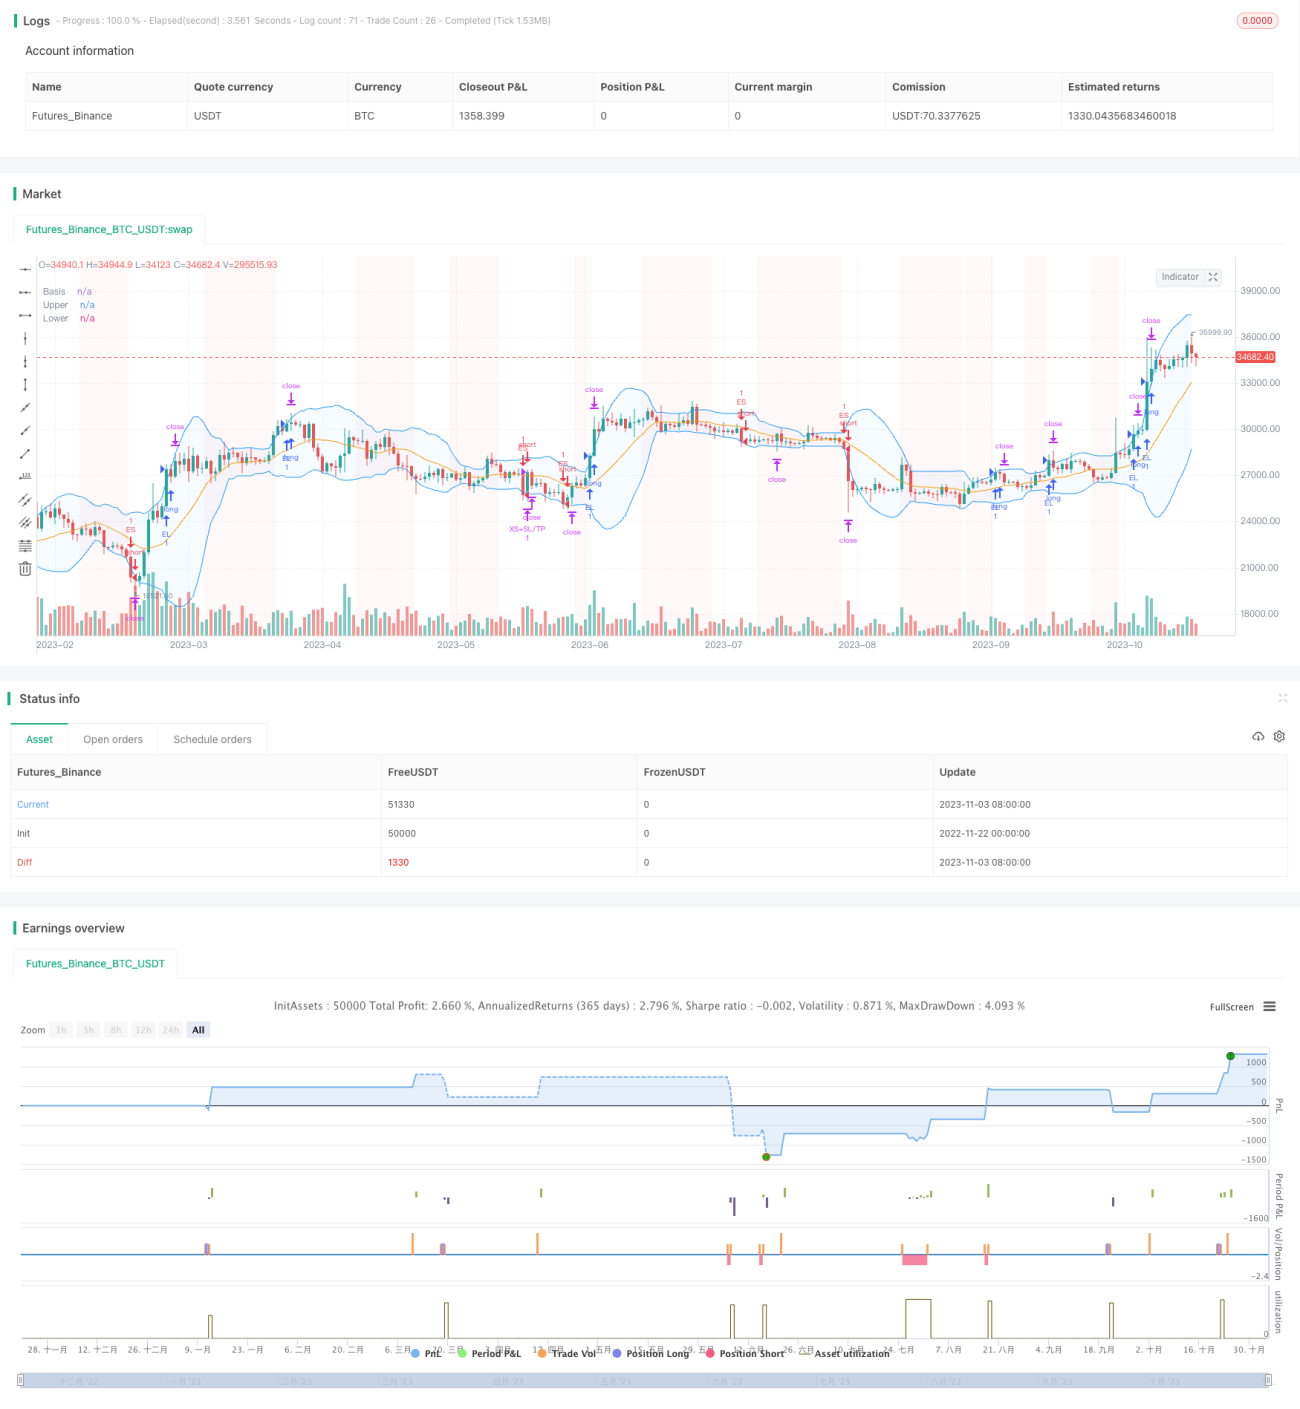
Брин-бест-стратегия - это краткосрочная стратегия, основанная на индикаторе Брин-бест. Она может выполнять операции в обоих направлениях, как в многоголовном, так и в пустом направлении. Она применяется к контрактам на наличные деньги и долгосрочным контрактам, особенно в трендовых ситуациях.

Стратегия имеет высокую конфигурацию, позволяя пользователям устанавливать параметры порыва и отклонения по ленте Брин, фильтры тренда, фильтры волатильности, фильтры направления торговли, фильтры скорости изменения и фильтры даты. Кроме того, она также устанавливает стоп-потери, стоп-остановки и отслеживает стоп-потери для многоголовых и пустых позиций, обеспечивая комплексный подход к управлению риском.

Стратегический принцип

Центральным показателем стратегии является полоса бурин. Полоса бурин состоит из трех линий: средней, верхней и нижней, которые представляют собой среднюю линию цены, верхнюю границу колебаний и нижнюю границу колебаний. Когда цена пробивается вверх, делайте больше; когда цена пробивается вниз, делайте больше.

Кроме того, в стратегии есть несколько вспомогательных фильтров, которые предотвращают торговлю Noise. Эти фильтры включают:

  1. Тренд-фильтр: цена выше скользящего среднего и ниже скользящего среднего;

  2. Волатильность фильтра: торгуйте только при увеличении волатильности;

  3. Фильтр направленности торговли: выберите только плюс, только минус или двунаправленную торговлю в зависимости от свойств знака;

  4. Фильтр изменения курса: цена входит, когда она достигает определенного уровня изменения курса по сравнению с ценой закрытия предыдущего торгового дня;

  5. Фильтр даты: настройка интервала времени для отсчета.

Появление торгового сигнала, когда все условия фильтрации выполнены. Стоп, стоп-лосс и слежение за стоп-лосс обеспечивают управление рисками. Кроме того, установка максимального убытка в течение суток позволяет избежать однодневного резкого вывода.

Анализ преимуществ

Эта стратегия имеет следующие преимущества:

  1. В качестве основного торгового сигнала используется созданный индекс BRI, который обладает высокой надежностью.

  2. Многофильтровый дизайн, позволяющий избежать ошибочных сделок, имеет высокую конфигурацию;

  3. Обеспечение полноценного и гибкого предотвращения, ликвидации и отслеживания убытков;

  4. Настройка максимального убытка в сутки эффективно контролирует однодневный отвод.

  5. В этом случае вы можете получить прибыль от продажи акций.

Анализ рисков

Однако эта стратегия также несет в себе определенные риски:

  1. Прорыв в поясе Брин может привести к ложным прорывам в голове и в нижней части тела, что может привести к повреждению.

  2. Например, в некоторых странах, например, в Китае, в Китае, в Китае, в Китае, в Китае, в Китае, в Китае, в Китае.

  3. Большие взлеты могут привести к непосредственному прорыву линии остановки убытков;

  4. В крайнем случае, невозможно полностью избежать огромных потерь.

В связи с вышеупомянутыми рисками, можно соответствующим образом ослабить условия фильтрации, или искусственным вмешательством закрыть некоторые позиции, снизить стоп-рассвет и т. д.

Направление оптимизации

Эта стратегия может быть оптимизирована в следующих аспектах:

  1. Попробуйте различные комбинации параметров, чтобы найти оптимальный диапазон параметров.

  2. Добавление моделей машинного обучения для динамической оптимизации параметров;

  3. Изучение более эффективных методов остановки потерь, таких как остановка времени, остановка амплитуды и т. д.;

  4. Вместе с эмоциональными показателями, активное вмешательство в экстремальные ситуации;

  5. Статистический арбитраж в сочетании с соответствующими продуктами.

Подвести итог

Стратегия прорыва в буринской полосе - это проверенная и надежная стратегия следования за короткими линиями тренда. Она использует индикатор буринской полосы в качестве сигнала и устанавливает множество фильтров, обеспечивающих надежность сигнала. В то же время, всеобъемлющий механизм остановки убытков и контроля риска контролирует риск.

Исходный код стратегии
/*backtest
start: 2022-11-22 00:00:00
end: 2023-11-04 05:20:00
period: 1d
basePeriod: 1h
exchanges: [{"eid":"Futures_Binance","currency":"BTC_USDT"}]
*/


//@version=5
strategy("Bollinger Bands - Breakout Strategy",overlay=true
         )


// Define the length of the Bollinger Bands
bbLengthInput = input.int (15,title="Length", group="Bollinger Bands", inline="BB")
bbDevInput = input.float (2.0,title="StdDev", group="Bollinger Bands", inline="BB")

// Define the settings for the Trend Filter
trendFilterInput = input.bool(false, title="Above/Below", group = "Trend Filter", inline="Trend")
trendFilterPeriodInput = input(223,title="", group = "Trend Filter", inline="Trend")
trendFilterType = input.string (title="", defval="EMA",options=["EMA","SMA","RMA", "WMA"], group = "Trend Filter", inline="Trend")

volatilityFilterInput = input.bool(true,title="StdDev", group = "Volatility Filter", inline="Vol")
volatilityFilterStDevLength = input(15,title="",group = "Volatility Filter", inline="Vol")
volatilityStDevMaLength = input(15,title=">MA",group = "Volatility Filter", inline="Vol")

// ROC Filter

// f_security function by LucF for PineCoders available here: https://www.tradingview.com/script/cyPWY96u-How-to-avoid-repainting-when-using-security-PineCoders-FAQ/
f_security(_sym, _res, _src, _rep) => request.security(_sym, _res, _src[not _rep and barstate.isrealtime ? 1 : 0])[_rep or barstate.isrealtime ? 0 : 1]
high_daily = f_security(syminfo.tickerid, "D", high, false)

roc_enable = input.bool(false, "", group="ROC Filter from CloseD", inline="roc")
roc_threshold = input.float(1, "Treshold", step=0.5, group="ROC Filter from CloseD", inline="roc")

closed = f_security(syminfo.tickerid,"1D",close, false)
roc_filter= roc_enable ? (close-closed)/closed*100  > roc_threshold : true

// Trade Direction Filter

// tradeDirectionInput = input.string("Auto",options=["Auto", "Long&Short","Long Only", "Short Only"], title="Trade", group="Direction Filter", tooltip="Auto: if a PERP is detected (in the symbol description), trade long and short\n Otherwise as per user-input")

// tradeDirection = switch tradeDirectionInput
// 	"Auto" => str.contains(str.lower(syminfo.description), "perp") or str.contains(str.lower(syminfo.description), ".p") ? strategy.direction.all : strategy.direction.long
// 	"Long&Short" => strategy.direction.all
// 	"Long Only" => strategy.direction.long
//     "Short Only" => strategy.direction.short
// 	=> strategy.direction.all

// strategy.risk.allow_entry_in(tradeDirection)


// Calculate and plot the Bollinger Bands
[bbMiddle, bbUpper, bbLower] = ta.bb (close, bbLengthInput, bbDevInput)

plot(bbMiddle, "Basis", color=color.orange)
bbUpperPlot = plot(bbUpper, "Upper", color=color.blue)
bbLowerrPlot = plot(bbLower, "Lower", color=color.blue)
fill(bbUpperPlot, bbLowerrPlot, title = "Background", color=color.new(color.blue, 95))


// Calculate and view Trend Filter

float tradeConditionMa = switch trendFilterType
	"EMA" => ta.ema(close, trendFilterPeriodInput)
	"SMA" => ta.sma(close, trendFilterPeriodInput)
	"RMA" => ta.rma(close, trendFilterPeriodInput)
    "WMA" => ta.wma(close, trendFilterPeriodInput)
	// Default used when the three first cases do not match.
	=> ta.wma(close, trendFilterPeriodInput)


trendConditionLong  = trendFilterInput ? close > tradeConditionMa : true
trendConditionShort = trendFilterInput ? close < tradeConditionMa : true
plot(trendFilterInput ? tradeConditionMa : na, color=color.yellow)

// Calculate and view Volatility Filter

stdDevClose = ta.stdev(close,volatilityFilterStDevLength)
volatilityCondition = volatilityFilterInput ? stdDevClose > ta.sma(stdDevClose,volatilityStDevMaLength) : true

bbLowerCrossUnder =  ta.crossunder(close, bbLower)
bbUpperCrossOver =  ta.crossover(close, bbUpper)

bgcolor(volatilityCondition ? na : color.new(color.red, 95))


// Date Filter

start = input(timestamp("2017-01-01"), "Start", group="Date Filter")
finish = input(timestamp("2050-01-01"), "End", group="Date Filter")

date_filter = true

// Entry and Exit Conditions

entryLongCondition = bbUpperCrossOver and trendConditionLong and volatilityCondition and date_filter and roc_filter
entryShortCondition = bbLowerCrossUnder and trendConditionShort and volatilityCondition and date_filter and roc_filter

exitLongCondition = bbLowerCrossUnder
exitShortCondition = bbUpperCrossOver

// Orders

if entryLongCondition
    strategy.entry("EL", strategy.long)

if entryShortCondition
    strategy.entry("ES", strategy.short)

if exitLongCondition
    strategy.close("EL")

if exitShortCondition
    strategy.close("ES")


// Long SL/TP/TS

xl_ts_percent      = input.float(2,step=0.5, title= "TS", group="Exit Long", inline="LTS", tooltip="Trailing Treshold %")
xl_to_percent      = input.float(0.5, step=0.5, title= "TO", group="Exit Long", inline="LTS", tooltip="Trailing Offset %")

xl_ts_tick = xl_ts_percent * close/syminfo.mintick/100
xl_to_tick = xl_to_percent * close/syminfo.mintick/100

xl_sl_percent      = input.float (2, step=0.5, title="SL",group="Exit Long", inline="LSLTP") 
xl_tp_percent      = input.float(9, step=0.5, title="TP",group="Exit Long", inline="LSLTP")

xl_sl_price = strategy.position_avg_price * (1-xl_sl_percent/100)
xl_tp_price = strategy.position_avg_price * (1+xl_tp_percent/100)

strategy.exit("XL+SL/TP", "EL", stop=xl_sl_price, limit=xl_tp_price, trail_points=xl_ts_tick, trail_offset=xl_to_tick,comment_loss= "XL-SL", comment_profit = "XL-TP",comment_trailing = "XL-TS")

// Short SL/TP/TS
xs_ts_percent      = input.float(2,step=0.5, title= "TS",group="Exit Short", inline ="STS", tooltip="Trailing Treshold %")
xs_to_percent      = input.float(0.5, step=0.5, title= "TO",group="Exit Short", inline ="STS", tooltip="Trailing Offset %")

xs_ts_tick = xs_ts_percent * close/syminfo.mintick/100
xs_to_tick = xs_to_percent * close/syminfo.mintick/100

xs_sl_percent      = input.float (2, step=0.5, title="SL",group="Exit Short", inline="ESSLTP", tooltip="Stop Loss %") 
xs_tp_percent      = input.float(9, step=0.5, title="TP",group="Exit Short",  inline="ESSLTP", tooltip="Take Profit %")

xs_sl_price = strategy.position_avg_price * (1+xs_sl_percent/100)
xs_tp_price = strategy.position_avg_price * (1-xs_tp_percent/100)

strategy.exit("XS+SL/TP", "ES", stop=xs_sl_price, limit=xs_tp_price, trail_points=xs_ts_tick, trail_offset=xs_to_tick,comment_loss= "XS-SL", comment_profit = "XS-TP",comment_trailing = "XS-TS")


max_intraday_loss = input.int(10, title="Max Intraday Loss (Percent)", group="Risk Management")

//strategy.risk.max_intraday_loss(max_intraday_loss, strategy.percent_of_equity)

// Monthly Returns table, modified from QuantNomad. Please put calc_on_every_tick = true to plot it. 

monthly_table(int results_prec, bool results_dark) =>
    new_month = month(time) != month(time[1])
    new_year  = year(time)  != year(time[1])
    
    eq = strategy.equity
    
    bar_pnl = eq / eq[1] - 1
    
    cur_month_pnl = 0.0
    cur_year_pnl  = 0.0
    
    // Current Monthly P&L
    cur_month_pnl := new_month ? 0.0 : 
                     (1 + cur_month_pnl[1]) * (1 + bar_pnl) - 1 
    
    // Current Yearly P&L
    cur_year_pnl := new_year ? 0.0 : 
                     (1 + cur_year_pnl[1]) * (1 + bar_pnl) - 1  
    
    // Arrays to store Yearly and Monthly P&Ls
    var month_pnl  = array.new_float(0)
    var month_time = array.new_int(0)
    
    var year_pnl  = array.new_float(0)
    var year_time = array.new_int(0)
    
    last_computed = false
    
    if (not na(cur_month_pnl[1]) and (new_month or barstate.islast))
        if (last_computed[1])
            array.pop(month_pnl)
            array.pop(month_time)
            
        array.push(month_pnl , cur_month_pnl[1])
        array.push(month_time, time[1])
    
    if (not na(cur_year_pnl[1]) and (new_year or barstate.islast))
        if (last_computed[1])
            array.pop(year_pnl)
            array.pop(year_time)
            
        array.push(year_pnl , cur_year_pnl[1])
        array.push(year_time, time[1])
    
    last_computed := barstate.islast ? true : nz(last_computed[1])
    
    // Monthly P&L Table    
    var monthly_table = table(na)
    
    cell_hr_bg_color = results_dark ? #0F0F0F : #F5F5F5
    cell_hr_text_color = results_dark ? #D3D3D3 : #555555
    cell_border_color = results_dark ? #000000 : #FFFFFF

    // ell_hr_bg_color = results_dark ? #0F0F0F : #F5F5F5
    // cell_hr_text_color = results_dark ? #D3D3D3 : #555555
    // cell_border_color = results_dark ? #000000 : #FFFFFF
    if (barstate.islast)
        monthly_table := table.new(position.bottom_right, columns = 14, rows = array.size(year_pnl) + 1, bgcolor=cell_hr_bg_color,border_width=1,border_color=cell_border_color)
    
        table.cell(monthly_table, 0,  0, syminfo.tickerid + " " + timeframe.period,     text_color=cell_hr_text_color, bgcolor=cell_hr_bg_color)
        table.cell(monthly_table, 1,  0, "Jan",  text_color=cell_hr_text_color, bgcolor=cell_hr_bg_color)
        table.cell(monthly_table, 2,  0, "Feb",  text_color=cell_hr_text_color, bgcolor=cell_hr_bg_color)
        table.cell(monthly_table, 3,  0, "Mar",  text_color=cell_hr_text_color, bgcolor=cell_hr_bg_color)
        table.cell(monthly_table, 4,  0, "Apr",  text_color=cell_hr_text_color, bgcolor=cell_hr_bg_color)
        table.cell(monthly_table, 5,  0, "May",  text_color=cell_hr_text_color, bgcolor=cell_hr_bg_color)
        table.cell(monthly_table, 6,  0, "Jun",  text_color=cell_hr_text_color, bgcolor=cell_hr_bg_color)
        table.cell(monthly_table, 7,  0, "Jul",  text_color=cell_hr_text_color, bgcolor=cell_hr_bg_color)
        table.cell(monthly_table, 8,  0, "Aug",  text_color=cell_hr_text_color, bgcolor=cell_hr_bg_color)
        table.cell(monthly_table, 9,  0, "Sep",  text_color=cell_hr_text_color, bgcolor=cell_hr_bg_color)
        table.cell(monthly_table, 10, 0, "Oct",  text_color=cell_hr_text_color, bgcolor=cell_hr_bg_color)
        table.cell(monthly_table, 11, 0, "Nov",  text_color=cell_hr_text_color, bgcolor=cell_hr_bg_color)
        table.cell(monthly_table, 12, 0, "Dec",  text_color=cell_hr_text_color, bgcolor=cell_hr_bg_color)
        table.cell(monthly_table, 13, 0, "Year", text_color=cell_hr_text_color, bgcolor=cell_hr_bg_color)
    
        for yi = 0 to array.size(year_pnl) - 1
            table.cell(monthly_table, 0,  yi + 1, str.tostring(year(array.get(year_time, yi))), text_color=cell_hr_text_color, bgcolor=cell_hr_bg_color)
            
            y_color = array.get(year_pnl, yi) > 0 ? color.lime :  array.get(year_pnl, yi) < 0 ? color.red : color.gray
            table.cell(monthly_table, 13, yi + 1, str.tostring(math.round(array.get(year_pnl, yi) * 100, results_prec)), bgcolor = y_color)
            
        for mi = 0 to array.size(month_time) - 1
            m_row   = year(array.get(month_time, mi))  - year(array.get(year_time, 0)) + 1
            m_col   = month(array.get(month_time, mi)) 
            m_color = array.get(month_pnl, mi) > 0 ? color.lime : array.get(month_pnl, mi) < 0 ? color.red : color.gray
            
            table.cell(monthly_table, m_col, m_row, str.tostring(math.round(array.get(month_pnl, mi) * 100, results_prec)), bgcolor = m_color)

results_prec = input(2, title = "Precision", group="Results Table")
results_dark = input.bool(defval=true, title="Dark Mode", group="Results Table")
monthly_table(results_prec, results_dark)