Стратегия свинг-трейдинга на уровнях поддержки и сопротивления
Дата создания:
2024-01-25 15:53:06
Последнее изменение:
2024-01-25 15:53:06
Копировать:
2
Количество просмотров:
603
1
Подписаться
1750
Подписчики
Обзор
Эта стратегия, в сочетании с RSI, случайными показателями и стратегией оптимизации плавных позиций, обеспечивает точный контроль логики торговли и точный стоп-стоп. В то же время, благодаря введению сигнальной оптимизации, можно лучше контролировать тенденции и рационально управлять средствами.
Стратегический принцип
- RSI определяет зоны перекупа и перепродажи, в сочетании с случайными показателями K и D, которые формируют торговый сигнал.
- Введение классификации K-линий, которая поможет определить сигнал тренда и избежать ошибочных сделок.
- Средняя средняя SMA помогает определить направление тренда. Когда средняя средняя краткосрочная линия снизу вверх пробивает долгосрочную среднюю линию, это является позитивным сигналом.
- Стратегия скольжения в сторону равной позиции, в соответствии с пределом наивысшей и наименьшей колебаний цены устанавливается стоп-стоп-стоп.
Анализ преимуществ
- Оптимизация параметров RSI, чтобы лучше определять зоны перекупа и перепродажи и избегать ошибочных сделок
- Оптимизация показателей STO, регулирование параметров плавности, удаление шума, улучшение качества сигнала
- Внедрение технического анализа Heikin-Ashi для определения изменения направления объектов K-линии и обеспечения точности торговых сигналов
- Средняя SMA помогает определить направление тенденции и избежать обратной торговли
- В сочетании со стоп-стоп-стоп-стоп-стоп-стоп стратегией можно максимально закрепить прибыль на каждой сделке.
Анализ рисков
- На фоне продолжающегося падения рынка капитала существует большая опасность
- Слишком высокая частота транзакций может привести к увеличению стоимости транзакций и стоимости скольжения
- RSI подвержен ложным сигналам и должен отфильтровываться в сочетании с другими показателями
Оптимизация стратегии
- Настройка RSI на оптимизацию перепродажи
- Настройка параметров STO, гладкости и периодичности для улучшения качества сигнала
- Корректировка цикла движущейся средней и оптимизация оценки трендов
- Внедрение новых технических показателей для повышения точности сигналов
- Оптимизация Stop Loss Stop Loss Ratio, снижение риска в однократной сделке
Подвести итог
Эта стратегия объединяет преимущества ряда основных технических показателей, оптимизирует параметры и совершенствует правила, чтобы достичь баланса между качеством торговых сигналов и стоп-стоп-лосами. Обладает определенной универсальностью и стабильной прибыльностью.
Исходный код стратегии
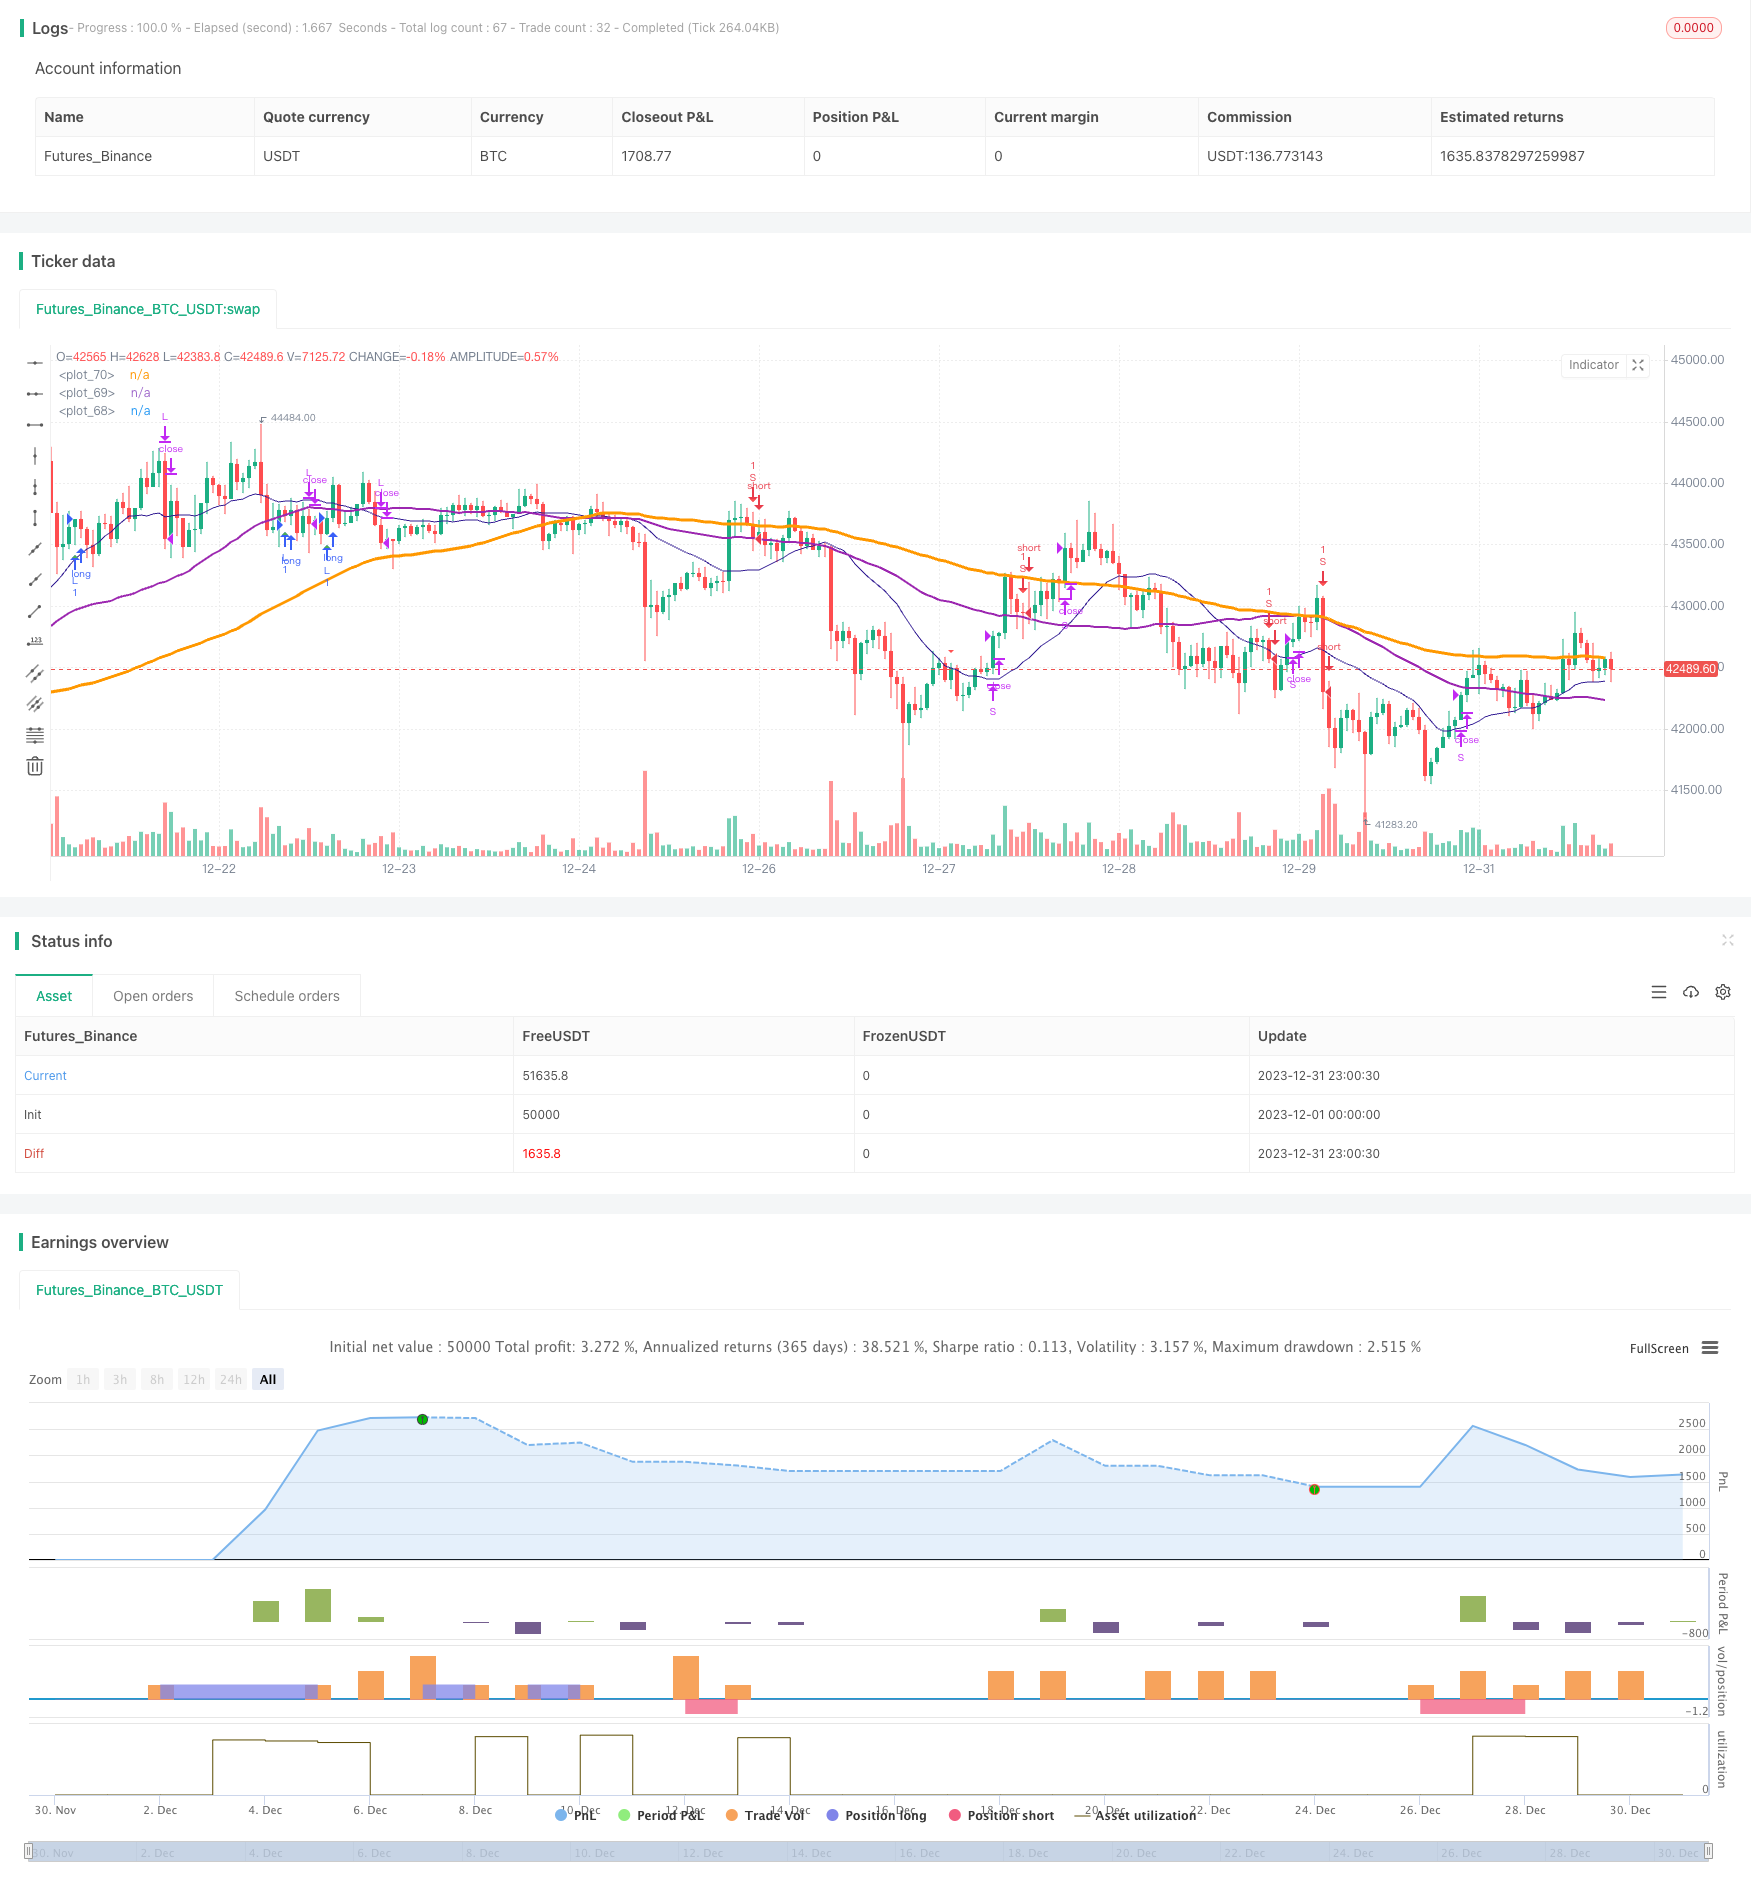
/*backtest
start: 2023-12-01 00:00:00
end: 2023-12-31 23:59:59
period: 1h
basePeriod: 15m
exchanges: [{"eid":"Futures_Binance","currency":"BTC_USDT"}]
*/

//@version=4
//study(title="@sentenzal strategy", shorttitle="@sentenzal strategy", overlay=true)
strategy(title="@sentenzal strategy", shorttitle="@sentenzal strategy", overlay=true  )
smoothK = input(3, minval=1)
smoothD = input(3, minval=1)
lengthRSI = input(14, minval=1)
lengthStoch = input(14, minval=1)
overbought = input(80, minval=1)
oversold = input(20, minval=1)
smaLengh = input(100, minval=1)
smaLengh2 = input(50, minval=1)
smaLengh3 = input(20, minval=1)

src = input(close, title="RSI Source")
testStartYear = input(2017, "Backtest Start Year")
testStartMonth = input(1, "Backtest Start Month")
testStartDay = input(1, "Backtest Start Day")
testPeriodStart = timestamp(testStartYear,testStartMonth,testStartDay,0,0)
testPeriod() =>
    time >= testPeriodStart ? true : false

rsi1 = rsi(src, lengthRSI)
k = sma(stoch(rsi1, rsi1, rsi1, lengthStoch), smoothK)
d = sma(k, smoothD)
crossBuy = crossover(k, d) and k < oversold
crossSell = crossunder(k, d) and k > overbought

dcLower = lowest(low, 10)
dcUpper = highest(high, 10)


heikinashi_close = security(heikinashi(syminfo.tickerid), timeframe.period, close)
heikinashi_open = security(heikinashi(syminfo.tickerid), timeframe.period, open)
heikinashi_low = security(heikinashi(syminfo.tickerid), timeframe.period, low)
heikinashi_high = security(heikinashi(syminfo.tickerid), timeframe.period, high)
heikinashiPositive = heikinashi_close >= heikinashi_open

heikinashiBuy = heikinashiPositive == true and heikinashiPositive[1] == false  and heikinashiPositive[2] == false
heikinashiSell = heikinashiPositive == false and heikinashiPositive[1] == true and heikinashiPositive[2] == true

//plotshape(heikinashiBuy, style=shape.arrowup, color=green, location=location.belowbar, size=size.tiny)
//plotshape(heikinashiSell, style=shape.arrowdown, color=red, location=location.abovebar, size=size.tiny)

buy = (crossBuy == true or crossBuy[1] == true or crossBuy[2] == true) and (heikinashiBuy == true or heikinashiBuy[1] == true or heikinashiBuy[2] == true)
sell = (crossSell == true or crossSell[1] == true or crossSell[2] == true) and (heikinashiSell == true or heikinashiSell[1] == true or heikinashiSell[2] == true)

mult = timeframe.period == '15' ? 4 : 1
mult2 = timeframe.period == '240' ? 0.25 : mult

movingAverage = sma(close, round(smaLengh))
movingAverage2 = sma(close, round(smaLengh2))
movingAverage3 = sma(close, round(smaLengh3))

uptrend = movingAverage < movingAverage2 and movingAverage2 < movingAverage3 and close > movingAverage
downtrend = movingAverage > movingAverage2 and movingAverage2 > movingAverage3 and close < movingAverage

signalBuy = (buy[1] == false and buy[2] == false and buy == true) and uptrend
signalSell = (sell[1] == false and sell[2] == false and sell == true) and downtrend

takeProfitSell = (buy[1] == false and buy[2] == false and buy == true) and uptrend == false
takeProfitBuy = (sell[1] == false and sell[2] == false and sell == true)  and uptrend

plotshape(signalBuy, style=shape.triangleup, color=green, location=location.belowbar, size=size.tiny)
plotshape(signalSell, style=shape.triangledown, color=red, location=location.abovebar, size=size.tiny)


plot(movingAverage, linewidth=3, color=orange, transp=0)
plot(movingAverage2, linewidth=2, color=purple, transp=0)
plot(movingAverage3, linewidth=1, color=navy, transp=0)

alertcondition(signalBuy, title='Signal Buy', message='Signal Buy')
alertcondition(signalSell, title='Signal Sell', message='Signal Sell')


strategy.close("L", when=dcLower[1] > low)
strategy.close("S", when=dcUpper[1] < high)

strategy.entry("L", strategy.long, 1, when = signalBuy and testPeriod() and uptrend)
strategy.entry("S", strategy.short, 1, when = signalSell and testPeriod() and uptrend ==false)

//strategy.exit("Exit Long", from_entry = "L", loss = 25000000, profit=25000000)
//strategy.exit("Exit Short", from_entry = "S", loss = 25000000, profit=25000000)