FTL - رینج فلٹر X2 + EMA + UO
مصنف:چاؤ ژانگ، تاریخ: 2022-05-13 16:09:07ٹیگز:ای ایم اے
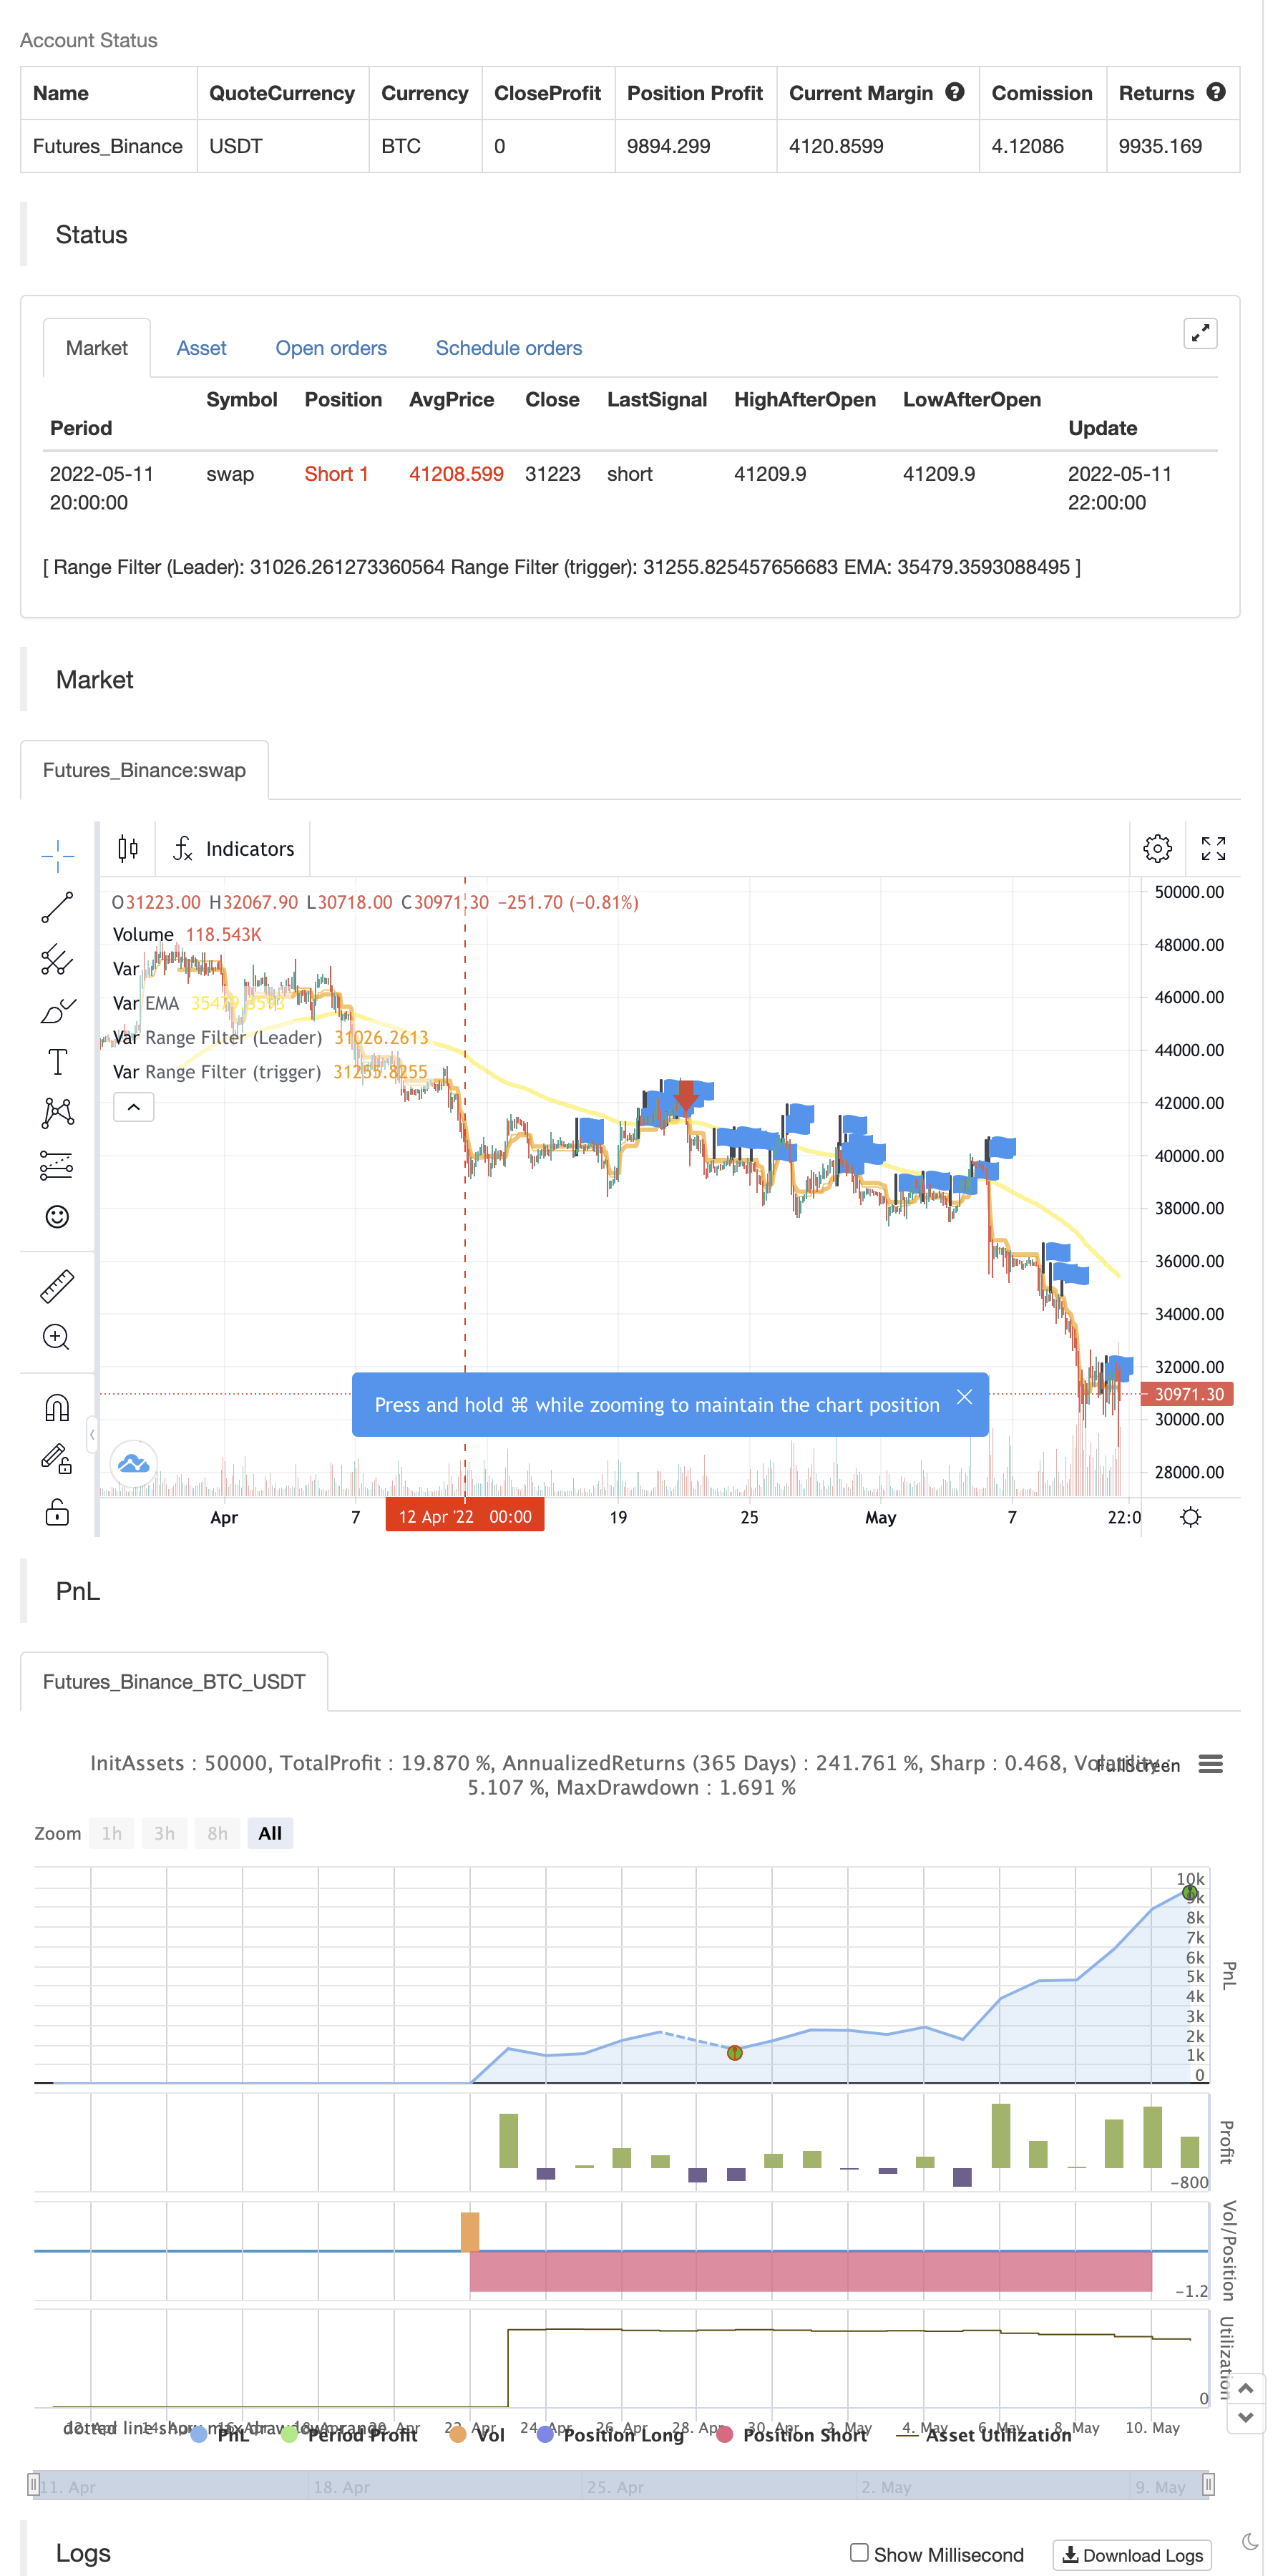
اسکرپٹ میں دو رینج فلٹرز، ایک ای ایم اے اور الٹیمیٹ آسکیلیٹر کو یکجا کیا گیا ہے۔ یہ انتباہات کے ساتھ ایک اشارے کی قسم ہے جو ایک منٹ کے اسکیلپنگ کے لئے مثالی ہے اور ابتدائی طور پر NAS100 کے لئے تیار کیا گیا تھا لیکن دوسرے علامات کے ساتھ کامیابی کے ساتھ استعمال کیا گیا ہے. دو رینج فلٹرز کا استعمال کیا جاتا ہے جب مختصر اور درمیانی مدت کے رجحانات ایک ہی سمت میں ہیں. ای ایم اے طویل مدتی رجحان کی نشاندہی کرتا ہے اور یو او کا استعمال اس بات کا تعین کرنے کے لئے کیا جاتا ہے کہ آیا کوئی اثاثہ زیادہ خرید یا زیادہ فروخت ہوا ہے۔ یہ اشارے سمت میں تبدیلی کے لئے سنگم کو شامل کرنے کے لئے اختلافات کے اشارے کے ساتھ اچھی طرح سے جوڑتا ہے.
اس اشارے کی اضافی خصوصیات:
- صرف اس وقت خرید اور فروخت کے لیبل دکھانے کے لئے تشکیل دیں جب اثاثہ زیادہ خرید یا زیادہ فروخت نہیں ہوتا ہے
- منتخب کریں کہ کیا صرف اس وقت خرید دکھائی جائے گی جب قیمت ای ایم اے سے اوپر ہو ، یا صرف ای ایم اے سے نیچے فروخت ہو
- ایک بار اشارہ کریں جہاں ایک رجحان EMA کو عبور کرتا ہے اور منتخب کریں کہ آیا کراس اوور یا کراس انڈر صرف ایک کاؤنٹر رجحان میں دکھایا جانا چاہئے۔
- رجحان کے اندر واپسی کی نشاندہی کی جاسکتی ہے۔ یہ رجحان کے تسلسل کی نشاندہی کرسکتا ہے۔
- انتباہات واپس لینے، ای ایم اے کراسنگ اور خرید یا فروخت سگنل کے لئے بنائے جا سکتے ہیں
بیک ٹسٹ
/*backtest
start: 2022-04-12 00:00:00
end: 2022-05-11 23:59:00
period: 2h
basePeriod: 15m
exchanges: [{"eid":"Futures_Binance","currency":"BTC_USDT"}]
*/

//@version=5


// Original Script > @DonovanWall

// Previous Version > @guikroth
// Ultimate Oscillator > @PineCoders

// Updated by > @jwelmac


//////////////////////////////////////////////////////////////////////////
// Range Filter x 2, EMA and UO
//////////////////////////////////////////////////////////////////////////


indicator(title='FTL - Range Filter X2 + EMA + UO', overlay=true)

// Groups

string groupLeadingRange = "Leading Range Filter"
string groupTriggerRange = "Trigger Range Filter"
string groupEMA = "EMA"
string groupUO = "Ultimate Oscillator (UO)"
string GROUP_BUY_OPTIONS = "Buy Options"
string GROUP_SELL_OPTIONS = "Sell Options"


//-------  *********  --------  *********  ---------
// Range Filter (Leader) {

// Source
src = input(defval=hl2, title='Source', group=groupLeadingRange)

// Sampling Period
per = input.int(defval=30, minval=1, title='Sampling Period', group=groupLeadingRange)

// Range Multiplier
mult = input.float(defval=2.6, minval=0.1, title='Range Multiplier', group=groupLeadingRange)

// Smooth Average Range {
smoothrng(x, t, m) =>
    wper = t * 2 - 1
    avrng = ta.ema(math.abs(x - x[1]), t)
    _smoothrng = ta.ema(avrng, wper) * m
    _smoothrng
// }
smrng = smoothrng(src, per, mult)

// Range Filter{
rngfilter(x, r) =>
    rngfilt = x
    rngfilt := x > nz(rngfilt[1]) ? x - r < nz(rngfilt[1]) ? nz(rngfilt[1]) : x - r : x + r > nz(rngfilt[1]) ? nz(rngfilt[1]) : x + r
    rngfilt
//}
filt = rngfilter(src, smrng)

// Filter Direction

upward = 0.0
upward := filt > filt[1] ? nz(upward[1]) + 1 : filt < filt[1] ? 0 : nz(upward[1])

downward = 0.0
downward := filt < filt[1] ? nz(downward[1]) + 1 : filt > filt[1] ? 0 : nz(downward[1])


// Colors

filtcolor = upward > 0 ? color.lime : downward > 0 ? color.red : color.orange

filtplot = plot(filt, color=filtcolor, linewidth=1, title='Range Filter (Leader)')

// }
//-------  *********  --------  *********  ---------

//-------  *********  --------  *********  ---------
// Range Filter (Trigger){
// Source
src2 = input(defval=ohlc4, title='Source', group=groupTriggerRange)

// Sampling Period
// Settings for 1min chart, US 100.

per2 = input.int(defval=48, minval=1, title='Sampling Period', group=groupTriggerRange)

// Range Multiplier

mult2 = input.float(defval=3.4, minval=0.1, title='Range Multiplier', group=groupTriggerRange)

// Smooth Average Range

smrng2 = smoothrng(src2, per2, mult2)

// Range Filter

rngfilt2(x, r) =>
    rngfilt = x
    rngfilt := x > nz(rngfilt[1]) ? x - r < nz(rngfilt[1]) ? nz(rngfilt[1]) : x - r : x + r > nz(rngfilt[1]) ? nz(rngfilt[1]) : x + r
    rngfilt
filt2 = rngfilt2(src2, smrng2)

// Filter Direction

upward2 = 0.0
upward2 := filt2 > filt2[1] ? nz(upward2[1]) + 1 : filt2 < filt2[1] ? 0 : nz(upward2[1])
downward2 = 0.0
downward2 := filt2 < filt2[1] ? nz(downward2[1]) + 1 : filt2 > filt2[1] ? 0 : nz(downward2[1])

// Colors

filtcolor2 = upward2 > 0 ? color.lime : downward2 > 0 ? color.red : color.orange

filtplot2 = plot(filt2, color=filtcolor2, linewidth=3, title='Range Filter (trigger)')

barcolor = src2 > filt2 and upward2 > 0
   ? color.green
   : src2 < filt2 and downward > 0
     ? color.red
     : color.rgb(120, 123, 134)
// Bar Color
//barcolor(barcolor)

// }
//-------  *********  --------  *********  ---------


//-------  *********  --------  *********  ---------
// Default EMA 144 {
len4 = input.int(144, minval=1, title='Length', group=groupEMA)
src4 = input(close, title='Source')
ema = ta.ema(src4, len4)
plot(ema, linewidth=3, color=color.new(color.yellow, 0), title='EMA')
closeAboveEma = close > ema
closeBelowEma = close < ema

uptrendCrossoverOnly = input.bool(false, title="Show crossover only in uptrend", group=groupEMA)
downtrendCrossunderOnly = input.bool(false, title="Show crossunder only in downtrend", group=groupEMA)
// END EMA
// }
//-------  *********  --------  *********  ---------


// ------ UO {
average(bp, tr_, length) => math.sum(bp, length) / math.sum(tr_, length)
uo() =>
    length1 = input.int(7, minval=1, title = "Fast Length", group=groupUO),
    length2 = input.int(14, minval=1, title = "Middle Length", group=groupUO),
    length3 = input.int(28, minval=1, title = "Slow Length", group=groupUO)
    high_ = math.max(high, close[1])
    low_ = math.min(low, close[1])
    bp = close - low_
    tr_ = high_ - low_
    avg7 = average(bp, tr_, length1)
    avg14 = average(bp, tr_, length2)
    avg28 = average(bp, tr_, length3)
    100 * (4*avg7 + 2*avg14 + avg28)/7
uoLevel = uo()
// }


// Break Outs
// Conditions {

longCond = bool(na)
shortCond = bool(na)
longCond := src > filt2 and src > src[1] and upward2 > 0 or src > filt2 and src < src[1] and upward2 > 0
shortCond := src < filt2 and src < src[1] and downward2 > 0 or src < filt2 and src > src[1] and downward2 > 0

CondIni = 0
CondIni := longCond ? 1 : shortCond ? -1 : CondIni[1]


// Long (Buy){
overBoughtLevel = input.float(defval=60, minval=50, title='UO Overbought value', group=GROUP_BUY_OPTIONS)
longWhenNotOverbought = input.bool(true, title = 'Show BUY only when not overbought (UO)', tooltip = 'Show BUY Signal only when not overbought according to UO', group=GROUP_BUY_OPTIONS)
longOnlyAboveEma = input.bool(true, title = 'Show BUY only above the EMA', tooltip = 'Show BUY Signal only when price closes above the EMA', group=GROUP_BUY_OPTIONS)

longCondition = longCond and CondIni[1] == -1
overBought = uoLevel > overBoughtLevel

if (longCondition and longWhenNotOverbought)
    longCondition := not overBought

if (longCondition and longOnlyAboveEma)
    longCondition := closeAboveEma
//}

// Short (Sell){
overSoldLevel = input.float(defval=40, maxval=50, title='UO Oversold value', group=GROUP_SELL_OPTIONS)
shortWhenNotOversold = input.bool(true, title = 'Show SELL only when not oversold (UO)', tooltip = 'Show SELL Signal only when not oversold according to UO', group=GROUP_SELL_OPTIONS)
shortOnlyBelowEma = input.bool(true, title = 'Show SELL only below the EMA', tooltip = 'Show SELL Signal only when price closes below the EMA', group=GROUP_SELL_OPTIONS)

shortCondition = shortCond and CondIni[1] == 1
overSold = uoLevel < overSoldLevel

if (shortCondition and shortWhenNotOversold)
    shortCondition := not overSold

if (shortCondition and shortOnlyBelowEma)
    shortCondition := closeBelowEma
//}

// }

// Trend directions {
trendUp = upward and upward2
trendDown = downward and downward2
// }

// MA Crossover{
arrowSize = size.small

emaCrossover = 'EMA Crossover'
didEmaCrossover = (not uptrendCrossoverOnly or trendUp) and ta.crossover(close, ema)
plotshape(
  didEmaCrossover,
  title = emaCrossover,
  style = shape.triangleup,
  size = arrowSize,
  location = location.belowbar,
  color = color.new(color.green, 0)
  )

emaCrossunder = 'EMA Crossunder'
didEmaCrossunder = (not downtrendCrossunderOnly or trendDown) and ta.crossunder(close, ema)
plotshape(
  didEmaCrossunder,
  title = emaCrossunder,
  style = shape.triangledown,
  size = arrowSize,
  location = location.abovebar,
  color = color.new(color.red, 0)
  )
// }

// Pullbacks (a possible indicator of trend continuation) {
// Conditions:
// - Both filters going in same direction
sameDirection = trendUp or trendDown

// Did the previous candle close in the opposite direction
prevOpp = (trendUp and close[1] < open[1]) or (trendDown and open[1] < close[1])

// Is the current candle in the trend direction
inTrendDirection = (trendDown and close < open) or (trendUp and close > open)

// - previous candle: crossover one or both in downtrend, crossunder one or both in uptrend
prevLimit = trendDown ? high[1] : low[1]
var previousCross = false

if (trendDown)
    previousCross := ta.crossover(prevLimit, filt[1]) or ta.crossover(prevLimit, filt2[1])
else
    previousCross := ta.crossunder(prevLimit, filt[1]) or ta.crossunder(prevLimit, filt2[1])

// - current candle: crossunder one or both in downtrend, crossover one or both in uptrend
currentReturn = trendDown
  ? close < filt
  : close > filt

pullback = prevOpp and inTrendDirection and sameDirection and previousCross and currentReturn

uptrendPullback = 'Uptrend Pullback'
isUptrendPullback = pullback and trendUp
plotshape(
  isUptrendPullback,
  title = uptrendPullback,
  style = shape.diamond,
  size = arrowSize,
  location = location.belowbar,
  color = color.new(color.green, 0)
  )

downtrendPullback = 'Downtrend Pullback'
isDowntrendPullback = pullback and trendDown
plotshape(
  isDowntrendPullback,
  title = 'Downtrend Pullback',
  style = shape.diamond,
  size = arrowSize,
  location = location.abovebar,
  color = color.new(color.red, 0)
  )

// }

// Buy/Sell Signal {
plotshape(longCondition, title='Buy Signal', text='BUY', textcolor=color.new(color.white, 0), style=shape.labelup, size=size.normal, location=location.belowbar, color=color.new(color.green, 0))
plotshape(shortCondition, title='Sell Signal', text='SELL', textcolor=color.new(color.white, 0), style=shape.labeldown, size=size.normal, location=location.abovebar, color=color.new(color.red, 0))
//}

//Alerts{

alertcondition(longCondition, title='Buy Alert', message='BUY')
alertcondition(shortCondition, title='Sell Alert', message='SELL')

alertcondition(didEmaCrossover, title = emaCrossover, message = emaCrossover)
alertcondition(didEmaCrossunder, title = emaCrossunder, message = emaCrossover)

alertcondition(isUptrendPullback, title=uptrendPullback, message = uptrendPullback)
alertcondition(isDowntrendPullback, title=downtrendPullback, message = downtrendPullback)
// }


// For use like Strategy, {

//1. Change the word  "indicator" for "strategy" at the top
//2.  Remove the "//" below

//strategy.entry( id = "Long", long = true, when = longCondition )
//strategy.close( id = "Long", when = shortCondition )
// }

if longCondition
    strategy.entry("Enter Long", strategy.long)
else if shortCondition
    strategy.entry("Enter Short", strategy.short)
متعلقہ
- مسلسل MACD گولڈن اور ڈیتھ کراس پر مبنی ٹریڈنگ حکمت عملی
- بہتر بولنگر بینڈس آر ایس آئی ٹریڈنگ حکمت عملی
- ٹرپل ای ایم اے کراس اوور حکمت عملی
- ایکسپونینشل حرکت پذیر اوسط کراس اوور لیورج کی حکمت عملی
- GM-8 اور ADX ڈبل حرکت پذیر اوسط حکمت عملی
- RSI/MACD/ATR کے ساتھ EMA کراس اوور کی بہتر حکمت عملی
- Z- اسکور رجحان کی پیروی کی حکمت عملی
- ای ایم اے پر طویل اندراج خطرے کے انتظام کی حکمت عملی کے ساتھ کراس
- وی ڈبلیو اے پی ٹریڈنگ حکمت عملی
- ویو ٹرینڈ کراس لیزیبیئر حکمت عملی
- الفا ٹریڈنگ بوٹ ٹریڈنگ کی حکمت عملی
مزید
- پییوٹ پوائنٹس اعلی کم ملٹی ٹائم فریم
- گھوٹالہ رجحانات کی حکمت عملی کا ڈیٹا بیس
- گھوٹالہ رجحانات کی پیروی کرنے کی حکمت عملی
- گھوسٹ ٹرینڈ ٹریکنگ کی حکمت عملی
- رینبو اوسیلیٹر
- ایکویٹی وکر کی پوزیشن سائزنگ مثال کی تجارت
- KLineChart ڈیمو
- وِلا ڈائنامک پِیوٹ سپر ٹرینڈ حکمت عملی
- کروڈل کا سپر ٹرینڈ
- zdmre کی طرف سے RSI
- برہماسترا
- موبو بینڈ
- SAR + 3SMMA SL & TP کے ساتھ
- ایس ایس ایس
- چاند لانچ الرٹس ٹیمپلیٹ [شاندار]
- HALFTREND + HEMA + SMA (غلط سگنل کی حکمت عملی)
- RSI Pivot، BB، SMA، EMA، SMMA، WMA، VWMA کے ساتھ اختلاف
- آر ایس آئی اور بی بی اور بیک وقت اوور سیلڈ
- رولنگ ہائکن آشی موم بتیاں
- کمبو 2/20 ای ایم اے اور بینڈ پاس فلٹر