ٹرینڈ سرفنگ - ڈبل موونگ ایوریج کراس اوور ٹرینڈ اسٹریٹجی
جائزہ
ٹرینڈ سرفنگ حکمت عملی ایک ٹرینڈ ٹریکنگ حکمت عملی ہے جس میں اہم ٹریڈنگ سگنل کے طور پر ڈبل مساوی لائن کراسنگ ہے۔ یہ بیک وقت مثلث بصری اشارے ، 200 دن ای ایم اے ، آر او سی اشارے اور آر ایس آئی اشارے کو ملاتا ہے تاکہ شور کو فلٹر کیا جاسکے اور رجحانات کے موڑ پر نئے رجحانات کی سمت کو درست طریقے سے پکڑا جاسکے۔ یہ حکمت عملی درمیانی لمبی لائن کی پوزیشنوں کے لئے موزوں ہے ، جو بیل مارکیٹ میں مستحکم ترقی حاصل کرسکتی ہے۔
حکمت عملی کا اصول
ٹرینڈ سرفنگ حکمت عملی بنیادی طور پر تیزی سے چلنے والی اوسط اور آہستہ چلنے والی اوسط پر مبنی ہے جس میں خرید اور فروخت کے سگنل پیدا ہوتے ہیں۔ جب تیزی سے چلنے والی اوسط پر آہستہ چلنے والی اوسط کو عبور کیا جاتا ہے تو خرید کا اشارہ پیدا ہوتا ہے۔ جب تیزی سے چلنے والی اوسط کے نیچے آہستہ چلنے والی اوسط کو عبور کیا جاتا ہے تو فروخت کا اشارہ پیدا ہوتا ہے۔
اس کے علاوہ ، اس حکمت عملی میں جعلی سگنل کو فلٹر کرنے یا رجحان کی کیفیت کا تعین کرنے کے لئے متعدد معاون اشارے متعارف کرائے گئے ہیں۔ خاص طور پر:
- قیمتوں میں تبدیلی کے رجحان اور رفتار کا تعین کرنے والا ROC اشارے
- RSI اشارے کا اندازہ لگانا کہ کیا یہ اوورلوڈ اور اوور سیل زون میں ہے
- 200 دن کے ای ایم اے نے مجموعی رجحان کی سمت کا فیصلہ کیا
- ایک مثلث بصری اشارے چارٹ پر داخلہ پوائنٹس کو نشان زد کرتا ہے
متعدد اشارے کے مجموعی فیصلے کے ذریعے ، ٹرینڈ سرفنگ حکمت عملی رجحان کے موڑ کے مقام پر درست مقام کی نشاندہی کرنے ، لمبی لائنوں میں واضح رجحانات کی پیروی کرنے اور مارکیٹ کے شور یا مختصر لائنوں کی ایڈجسٹمنٹ سے گمراہ ہونے سے بچنے کے قابل ہے۔
طاقت کا تجزیہ
1. واضح رجحانات کو پکڑیں
اس حکمت عملی کے ذریعے اوسط لائن کراسنگ بنیادی اندازہ کے رجحان کا رخ موڑنے کے ساتھ، 200 دن ای ایم اے جیسے اشارے فلٹرنگ مختصر لائن شور، اور توجہ مرکوز طویل لائن رجحان کا قبضہ کرنے کے لئے.
2۔ ملٹی میٹرکس کا مجموعہ اعلی معیار کے داخلے کی تصدیق کرنے کا وقت
اس حکمت عملی میں خود اوسط لائن کراسنگ کے علاوہ ، آر او سی ، آر ایس آئی اور دیگر اشارے متعارف کروائے گئے ہیں تاکہ رجحانات کے موڑ کے مقام پر جھٹکے والے علاقوں سے گریز کیا جاسکے ، تاکہ داخلے کے معیار کو یقینی بنایا جاسکے۔
3۔ آسانی سے پڑھنے کے لئے سہ رخی بصری اشارے
سبز نیچے کی طرف مثلث خریدنے کا وقت اور سرخ اوپر کی طرف مثلث بیچنے کا وقت ظاہر کرتا ہے۔
مختلف ضروریات کے لئے اپنی مرضی کے مطابق پیرامیٹرز
صارفین کو اپنے ٹریڈنگ سٹائل کے مطابق اوسط لائن پیرامیٹرز، ROC لمبائی، RSI لمبائی وغیرہ کو آزادانہ طور پر ایڈجسٹ کرنے کی اجازت ہے۔
5 ۔ سٹاپ لاسٹ مینجمنٹ کو مدنظر رکھنا اس حکمت عملی میں اے ٹی آر کی قدر کو خطرے کے تناسب سے ضرب دیا گیا ہے تاکہ ایک ہی تجارت کے خطرے کو کنٹرول کیا جاسکے۔
خطرے کا تجزیہ
1۔ خطرے کا خطرہ
کوئی بھی حکمت عملی جو یکساں لائن کراسنگ پر مبنی ہوتی ہے ، اس میں یکساں لائن کے جھٹکے کے دوران ایک مخصوص خطرے یا نقصان کا خطرہ ہوتا ہے۔
2. غلط پیرامیٹرز کی ترتیب زیادہ سے زیادہ اصلاح کا سبب بن سکتی ہے
صارفین کو معیاری پیرامیٹرز کے حصول سے گریز کرنا چاہئے ، اور اشارے کی قدر کو زیادہ سے زیادہ مثالی انداز میں ترتیب دینا چاہئے۔ مختلف مارکیٹ کے حالات اور اقسام کے مطابق پیرامیٹرز کی جانچ کی جانی چاہئے۔
3۔ مارکیٹ میں سسٹم کے خطرے کے واقعات کو مکمل طور پر فلٹر کرنے میں ناکامی تاہم ، اس کے باوجود ، اس کے باوجود ، اس کے باوجود ، اس کے باوجود ، اس کے باوجود ، اس کے باوجود ، اس کے باوجود ، اس کے باوجود۔
اصلاح کی سمت
ٹیسٹ اور اصلاح پیرامیٹرز کی ترتیب
اوسط لائن کی مدت ، آر او سی کی لمبائی ، آر ایس آئی پیرامیٹرز وغیرہ کو دوبارہ جانچنا اور ان کو بہتر بنانے کی ضرورت ہے تاکہ وہ مختلف قسم کے تجارت کی خصوصیات کے مطابق ہو۔
2۔ ٹیسٹ اور دیگر معاون اشارے متعارف کروانا
دوسرے اشارے جیسے BOLL، KDJ وغیرہ کے ساتھ اوسط لائن کراسنگ کے مجموعی اثرات کی جانچ جاری رکھ سکتے ہیں۔
3۔ اسٹاپ اور نقصان کو بہتر بنانے کے لئے الگورتھم ٹریڈنگ کے ساتھ مل کر
مشین لرننگ الگورتھم متعارف کروائیں تاکہ اسٹاپ لاسٹ اسٹاپ کو زیادہ ذہین بنایا جاسکے اور متحرک مارکیٹ کے ماحول میں اس کی موافقت کی جاسکے۔
4۔ دیگر حکمت عملیوں یا ماڈلز کے ساتھ انضمام کی تلاش
بنیادی حصص کی حکمت عملی ، شماریاتی ارورجائزنگ حکمت عملی ، پورٹ فولیو کی اصلاح کے ماڈل وغیرہ کے ساتھ مجموعہ کرنے سے ، منافع کی شرح میں اضافے کے لئے خطرے کو مزید کنٹرول کیا جاسکتا ہے۔
خلاصہ کریں۔
ٹرینڈ سرفنگ حکمت عملی ایک سادہ ، براہ راست ، اور خطرے سے چلنے والی رجحانات کی حکمت عملی ہے۔ یہ دوہری مساوی لائنوں کے کراسنگ کے ذریعہ تشکیل پانے والے تجارتی سگنل کے گرد گھومتی ہے ، اور متعدد معاون اشارے کے ذریعہ فلٹرنگ کرتی ہے۔ یہ حکمت عملی درمیانی لمبی لائن کی پوزیشنوں کے لئے موزوں ہے ، جو بیل مارکیٹ کے رجحانات کو مستحکم کرتی ہے۔ ہم اس حکمت عملی کو پیرامیٹر ٹیسٹنگ ، اشارے میں توسیع ، اور خطرے سے متعلق کنٹرول کے ذریعہ بہتر بناتے رہیں گے ، تاکہ اس کی وسیع تر مارکیٹ میں زیادہ مستحکم کارکردگی ہو۔
||
Overview
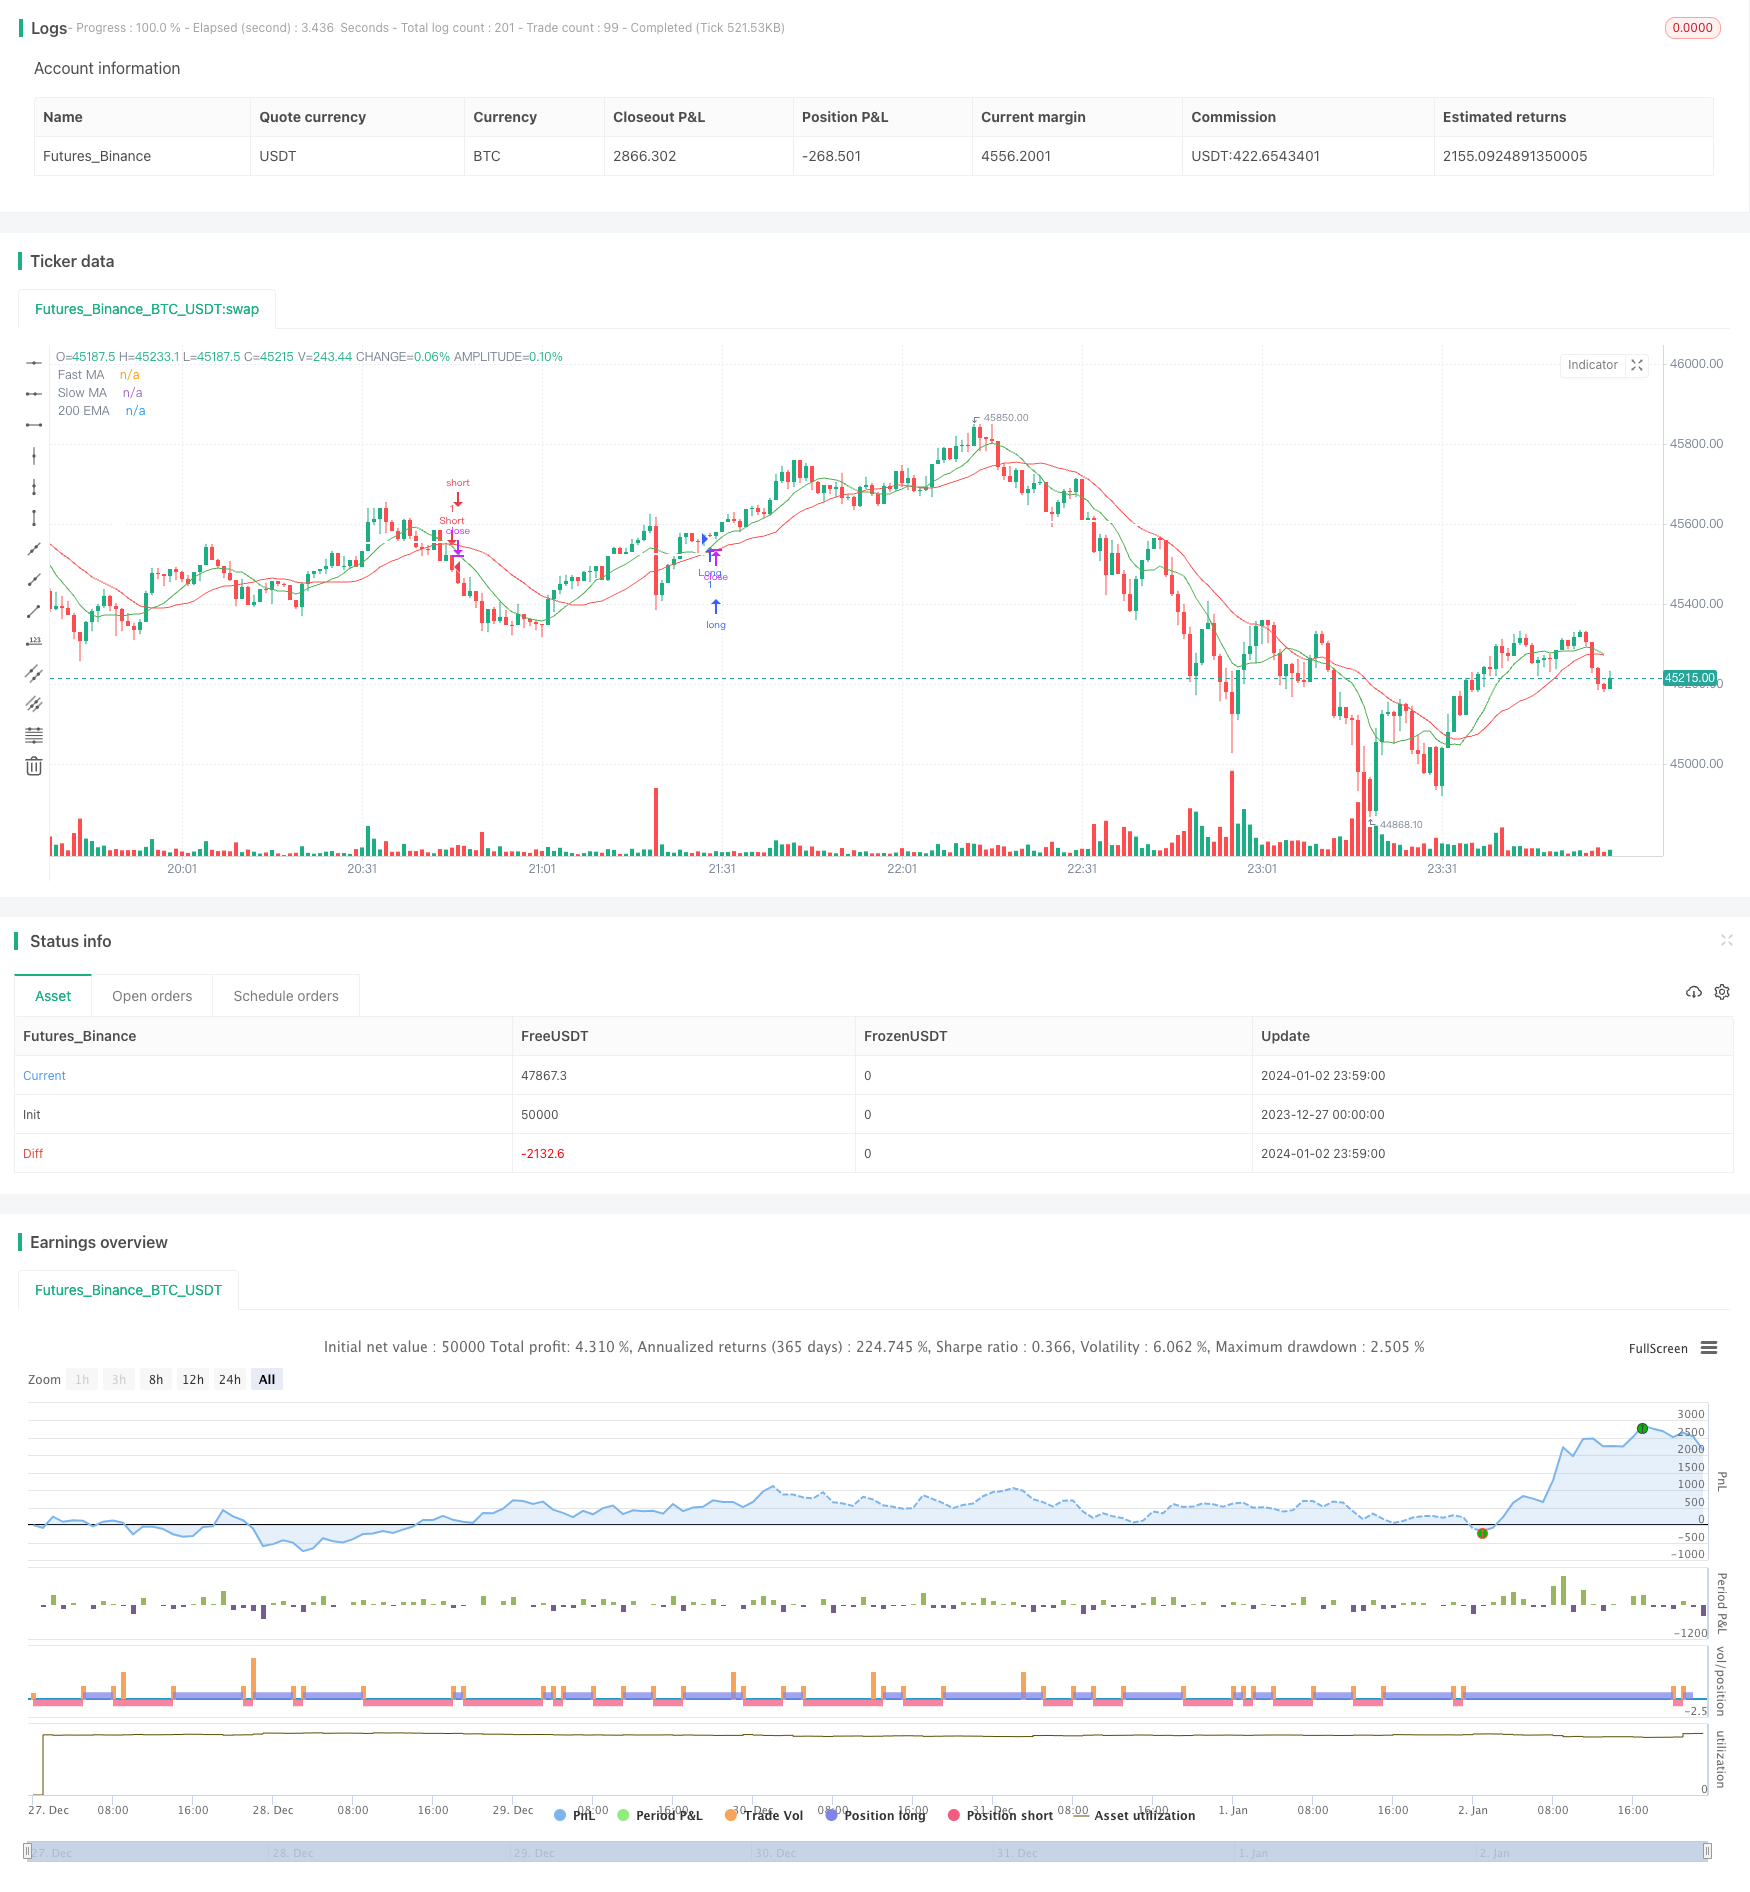
The TrendSurfing strategy is a trend tracking strategy based primarily on double moving average crossover signals. It also incorporates triangle visual indicators, 200-day EMA, ROC indicator and RSI indicator to filter out noise and accurately capture trend reversals. This strategy is suitable for medium-to-long-term holding and can achieve steady growth in a bull market.
Strategy Logic
The TrendSurfing strategy mainly relies on golden cross and death cross formed by fast moving average and slow moving average to generate buy and sell signals. When the fast MA crosses above the slow MA, a buy signal is generated. When the fast MA crosses below the slow MA, a sell signal is generated.
In addition, the strategy incorporates several auxiliary indicators to filter out false signals or determine trend quality, including:
- ROC indicator to determine price trend and momentum
- RSI oscillator to detect overbought/oversold levels
- 200-day EMA to determine overall trend direction
- Triangle visual indicators to mark entry points on chart
By comprehensively judging various indicators, the TrendSurfing strategy can accurately locate trend turning points and track definite medium-to-long term trends without being misguided by market noise or short-term corrections.
Advantage Analysis
1. Catch Medium-to-Long Term Trend
The strategy basically judges trend reversal based on MA crosses, and uses indicators like 200-day EMA to filter out short-term noise, with focus on medium-to-long term trend capture.
2. Multiple Indicators Ensure High Quality Entry
On top of MA crossover itself, the incorporation of ROC, RSI and other indicators enables avoidance of consolidation zones on reversal points and ensures quality entry.
3. Intuitive Triangle Visual Indicators
Green downward triangles indicate long entries, red upward triangles indicate short entries. Clean and straightforward.
4. Customizable Parameters for Different Needs
Users can freely adjust parameters like MA periods, ROC length, RSI length etc according to their own trading style.
5. Stop Loss and Take Profit Control
The strategy sets stop loss and take profit based on ATR value multiplied by risk percentage, enabling per trade risk control.
Risk Analysis
1. Risk of Missing Trades
Any MA crossover based strategy has inherent risk of missing trades or being stopped out when MA is oscillating.
2. Over-optimization from Improper Parameter Settings Users should avoid chasing hypothetically ideal parameter values. Parameters should be tested and adapted based on different market conditions and products.
3. Inability to Fully Filter Black Swan Events
Under extreme market conditions, strategies could still face large losses from market systemic risks.
Optimization Directions
1. Test and Optimize Parameter Values
Periods of MAs, length of ROC, values of RSI etc should go through rigorous backtesting and optimization to fit characteristics of different trading products.
2. Test and Incorporate Other Auxiliary Indicators
Continue testing combinations of other indicators like BOLL, KDJ etc with MA crosses for better performance.
3. Coordinate with Algorithmic Trading for Better Risk Control Introduce machine learning algorithms to enable more intelligent stop loss and take profit, adapting to dynamic market environments.
4. Explore Combinations with Other Strategies or Models
Combining with fundamentals-based stock picking strategies, statistical arbitrage strategies, portfolio optimization models etc could further enhance risk control and return.
Conclusion
The TrendSurfing strategy is a simple, straightforward trend tracking strategy with controllable risk. Trading signals are generated from MA crosses and filtered by multiple auxiliary indicators. It is suitable for medium-to-long term holding to steadily track bull market trends. We will continue optimizing this strategy through parameter testing, indicator expansion, risk control etc to achieve more reliable performance across diverse markets.
[/trans]
/*backtest
start: 2023-12-27 00:00:00
end: 2024-01-03 00:00:00
period: 1m
basePeriod: 1m
exchanges: [{"eid":"Futures_Binance","currency":"BTC_USDT"}]
*/

//@version=4
strategy("Moving Average Crossover with Triangles, 200 EMA, ROC, and RSI", overlay=true)

// Define input parameters
fast_length = input(9, title="Fast MA Length")
slow_length = input(21, title="Slow MA Length")
roc_length = input(14, title="ROC Length")
rsi_length = input(14, title="RSI Length")

// Calculate moving averages
fast_ma = sma(close, fast_length)
slow_ma = sma(close, slow_length)

// Plot moving averages
plot(fast_ma, color=color.green, title="Fast MA")
plot(slow_ma, color=color.red, title="Slow MA")

// Plot 200 EMA
ema_200 = ema(close, 200)
plot(ema_200, color=color.white, title="200 EMA", linewidth=2)

// Calculate Rate of Change (ROC)
roc = roc(close, roc_length)

// Calculate RSI
rsi = rsi(close, rsi_length)

// Define strategy entry and exit conditions
long_condition = crossover(fast_ma, slow_ma) and roc > 0 and close > ema_200 and rsi > 55
short_condition = crossunder(fast_ma, slow_ma) and roc < 0 and close < ema_200 and rsi < 45

// Execute strategy
strategy.entry("Long", strategy.long, when=long_condition)
strategy.entry("Short", strategy.short, when=short_condition)

// Define stop loss and take profit levels
risk_percent = input(1, title="Risk Percentage", minval=0.1, maxval=5, step=0.1) / 100
atr_value = atr(14)
stop_loss = close - atr_value * risk_percent
take_profit = close + atr_value * risk_percent

strategy.exit("Take Profit/Stop Loss", from_entry="Long", loss=stop_loss, profit=take_profit)
strategy.exit("Take Profit/Stop Loss", from_entry="Short", loss=stop_loss, profit=take_profit)

// Plot larger triangles on crossover and crossunder
plotshape(series=long_condition, title="Long Entry", color=color.green, style=shape.triangleup, location=location.belowbar, size=size.small)
plotshape(series=short_condition, title="Short Entry", color=color.red, style=shape.triangledown, location=location.abovebar, size=size.small)