Chiến lược TradingView tốt nhất
Tác giả:ChaoZhang, Ngày: 2022-05-09 21:08:17Tags:RSIMA
Kịch bản hoàn toàn dựa trên động lực, khối lượng và giá cả. 1: Bollinger Band Nén để biết khi nào một sự đột phá có thể xảy ra. 2: Sử dụng Moving Averages (SMA và EMA) để biết hướng. 3: Tỷ lệ thành công Tỷ lệ thành công của chiến lược này là trên 75% và nếu hành động giá ít được thêm vào nó có thể dễ dàng vượt qua 90% thành công. 4: Đừng lo lắng về việc rút tiền, chúng tôi đã thực hiện SL, vì vậy bạn có thể thấy một chút rút tiền thêm nhưng trong thực tế nó khá ít hơn. 5: Tôi đã tự thử nghiệm chiến lược này trong 41 ngày với một tài khoản 250$ và ngay bây giờ tôi có 2700$.
backtest
/*backtest
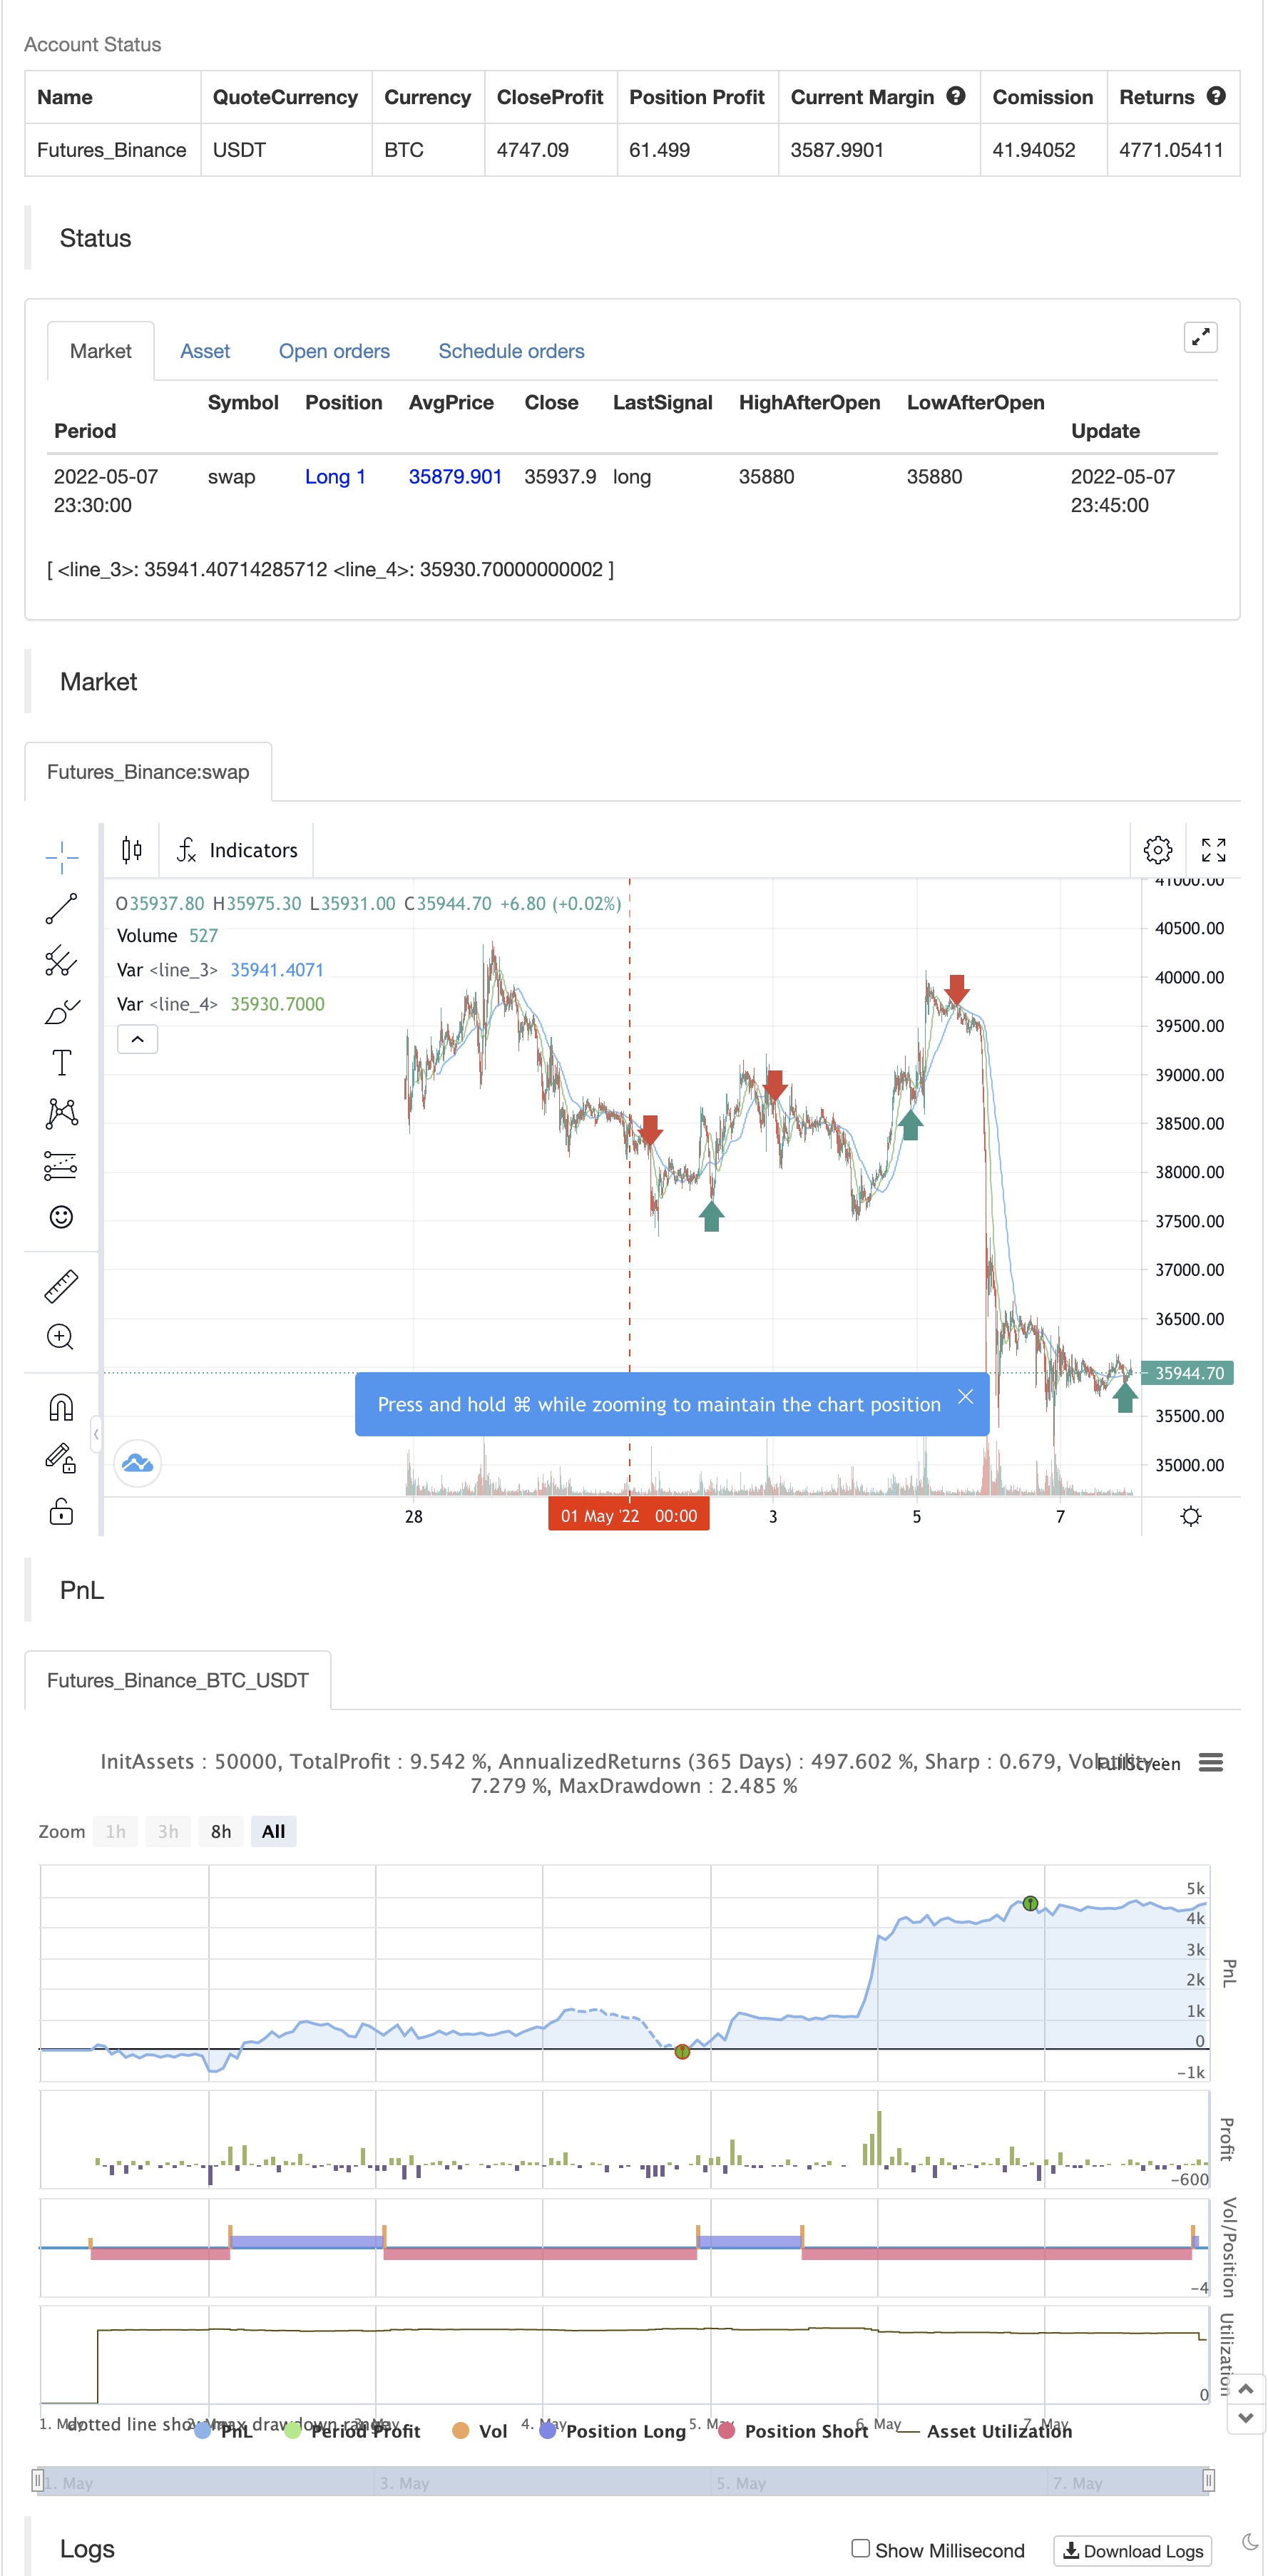
start: 2022-05-01 00:00:00
end: 2022-05-07 23:59:00
period: 15m
basePeriod: 5m
exchanges: [{"eid":"Bitfinex","currency":"BTC_USD"}]
*/
// This source code is subject to the terms of the Mozilla Public License 2.0 at https://mozilla.org/MPL/2.0/
// © The_Bigger_Bull
//@version=5
strategy("Best TradingView Strategy", overlay=true, margin_long=0, margin_short=0)
//Bollinger Bands
source1 = close
length1 = input.int(15, minval=1)
mult1 = input.float(2.0, minval=0.001, maxval=50)
basis1 = ta.sma(source1, length1)
dev1 = mult1 * ta.stdev(source1, length1)
upper1 = basis1 + dev1
lower1 = basis1 - dev1
//buyEntry = ta.crossover(source1, lower1)
//sellEntry = ta.crossunder(source1, upper1)
//RSI
ma(source, length, type) =>
switch type
"SMA" => ta.sma(source, length)
"Bollinger Bands" => ta.sma(source, length)
"EMA" => ta.ema(source, length)
"SMMA (RMA)" => ta.rma(source, length)
"WMA" => ta.wma(source, length)
"VWMA" => ta.vwma(source, length)
rsiLengthInput = input.int(14, minval=1, title="RSI Length", group="RSI Settings")
rsiSourceInput = input.source(close, "Source", group="RSI Settings")
maTypeInput = input.string("SMA", title="MA Type", options=["SMA", "Bollinger Bands", "EMA", "SMMA (RMA)", "WMA", "VWMA"], group="MA Settings")
maLengthInput = input.int(14, title="MA Length", group="MA Settings")
bbMultInput = input.float(2.0, minval=0.001, maxval=50, title="BB StdDev", group="MA Settings")
up = ta.rma(math.max(ta.change(rsiSourceInput), 0), rsiLengthInput)
down = ta.rma(-math.min(ta.change(rsiSourceInput), 0), rsiLengthInput)
rsi = down == 0 ? 100 : up == 0 ? 0 : 100 - (100 / (1 + up / down))
rsiMA = ma(rsi, maLengthInput, maTypeInput)
isBB = maTypeInput == "Bollinger Bands"
//plot(rsi, "RSI", color=#7E57C2)
//plot(rsiMA, "RSI-based MA", color=color.yellow)
rsiUpperBand = hline(70, "RSI Upper Band", color=#787B86)
hline(50, "RSI Middle Band", color=color.new(#787B86, 50))
rsiLowerBand = hline(30, "RSI Lower Band", color=#787B86)
//fill(rsiUpperBand, rsiLowerBand, color=color.rgb(126, 87, 194, 90), title="RSI Background Fill")
bbUpperBand = plot(isBB ? rsiMA + ta.stdev(rsi, maLengthInput) * bbMultInput : na, title = "Upper Bollinger Band", color=color.green)
bbLowerBand = plot(isBB ? rsiMA - ta.stdev(rsi, maLengthInput) * bbMultInput : na, title = "Lower Bollinger Band", color=color.green)
//fill(bbUpperBand, bbLowerBand, color= isBB ? color.new(color.green, 90) : na, title="Bollinger Bands Background Fill")
//ADX
adxlen = input(14, title="ADX Smoothing")
dilen = input(14, title="DI Length")
dirmov(len) =>
up1 = ta.change(high)
down1 = -ta.change(low)
plusDM = na(up1) ? na : (up1 > down1 and up1 > 0 ? up1 : 0)
minusDM = na(down1) ? na : (down1 > up1 and down1 > 0 ? down1 : 0)
truerange = ta.rma(ta.tr, len)
plus = fixnan(100 * ta.rma(plusDM, len) / truerange)
minus = fixnan(100 * ta.rma(minusDM, len) / truerange)
[plus, minus]
adx(dilen, adxlen) =>
[plus, minus] = dirmov(dilen)
sum = plus + minus
adx = 100 * ta.rma(math.abs(plus - minus) / (sum == 0 ? 1 : sum), adxlen)
sig = adx(dilen, adxlen)
out = ta.sma(close, 14)
sma1=ta.sma(close,42)
ema200=ta.ema(close,200)
longCondition = (out>sma1) and ta.crossover(source1, lower1)
if (longCondition )
strategy.entry("long", strategy.long)
shortCondition = (out<sma1) and ta.crossunder(source1, lower1)
if (shortCondition )
strategy.entry("short", strategy.short)
stopl=strategy.position_avg_price-50
tptgt=strategy.position_avg_price+100
stopshort=strategy.position_avg_price+50
tptgtshort=strategy.position_avg_price-100
strategy.exit("longclose","long",trail_offset=50,trail_points=100,when=ta.crossover(sma1,out))
strategy.exit("shortclose","short",trail_offset=50,trail_points=100,when=ta.crossover(out,sma1))
//if strategy.position_avg_price<0
plot(sma1 , color=color.blue)
plot(out, color=color.green)
//plot(ema200,color=color.red)
Có liên quan
- Chiến lược chuyển đổi thứ ba (Filter cuối tuần)
- Chiến lược giao dịch tần số cao tiền điện tử có rủi ro thấp và ổn định dựa trên RSI và MACD
- Chiến lược giao dịch toàn diện về đường trung bình động và chỉ số RSI
- Chiến lược giao dịch AlphaTradingBot
- Xu hướng đa chỉ số theo chiến lược
- Sự kết hợp của Double MA và RSI
- Lý thuyết sóng Elliott 4-9 Sóng xung phát hiện tự động Chiến lược giao dịch
- Bollinger + RSI, Chiến lược đôi v1.1
- RSI MTF Ob+Os
- RSI chiến lược đánh giá
Thêm nữa
- Nik Stoch
- stoch supertrd atr 200ma
- MTF RSI & Chiến lược STOCH
- EMA + AROON + ASH
- Động lực 2.0
- Chiến lược phạm vi EHMA
- Trung bình chuyển động mua-bán
- Midas Mk. II - Ultimate Crypto Swing
- TMA-Legacy
- TV cao và thấp chiến lược
- R3.0 + Tình trạng biến động tăng cao + TP RSI
- Chande Kroll dừng lại
- CCI + EMA với Chiến lược chéo RSI
- EMA bands + leledc + bollinger bands
- RSI MTF Ob+Os
- Chiến lược MACD Willy
- RSI - Bán tín hiệu mua
- Xu hướng Heikin-Ashi
- HA Xấu đảo thị trường
- Ichimoku Cloud Smooth Oscillator