FTL - Range Filter X2 + EMA + UO
Tác giả:ChaoZhang, Ngày: 2022-05-13 16:09:07Tags:EMA
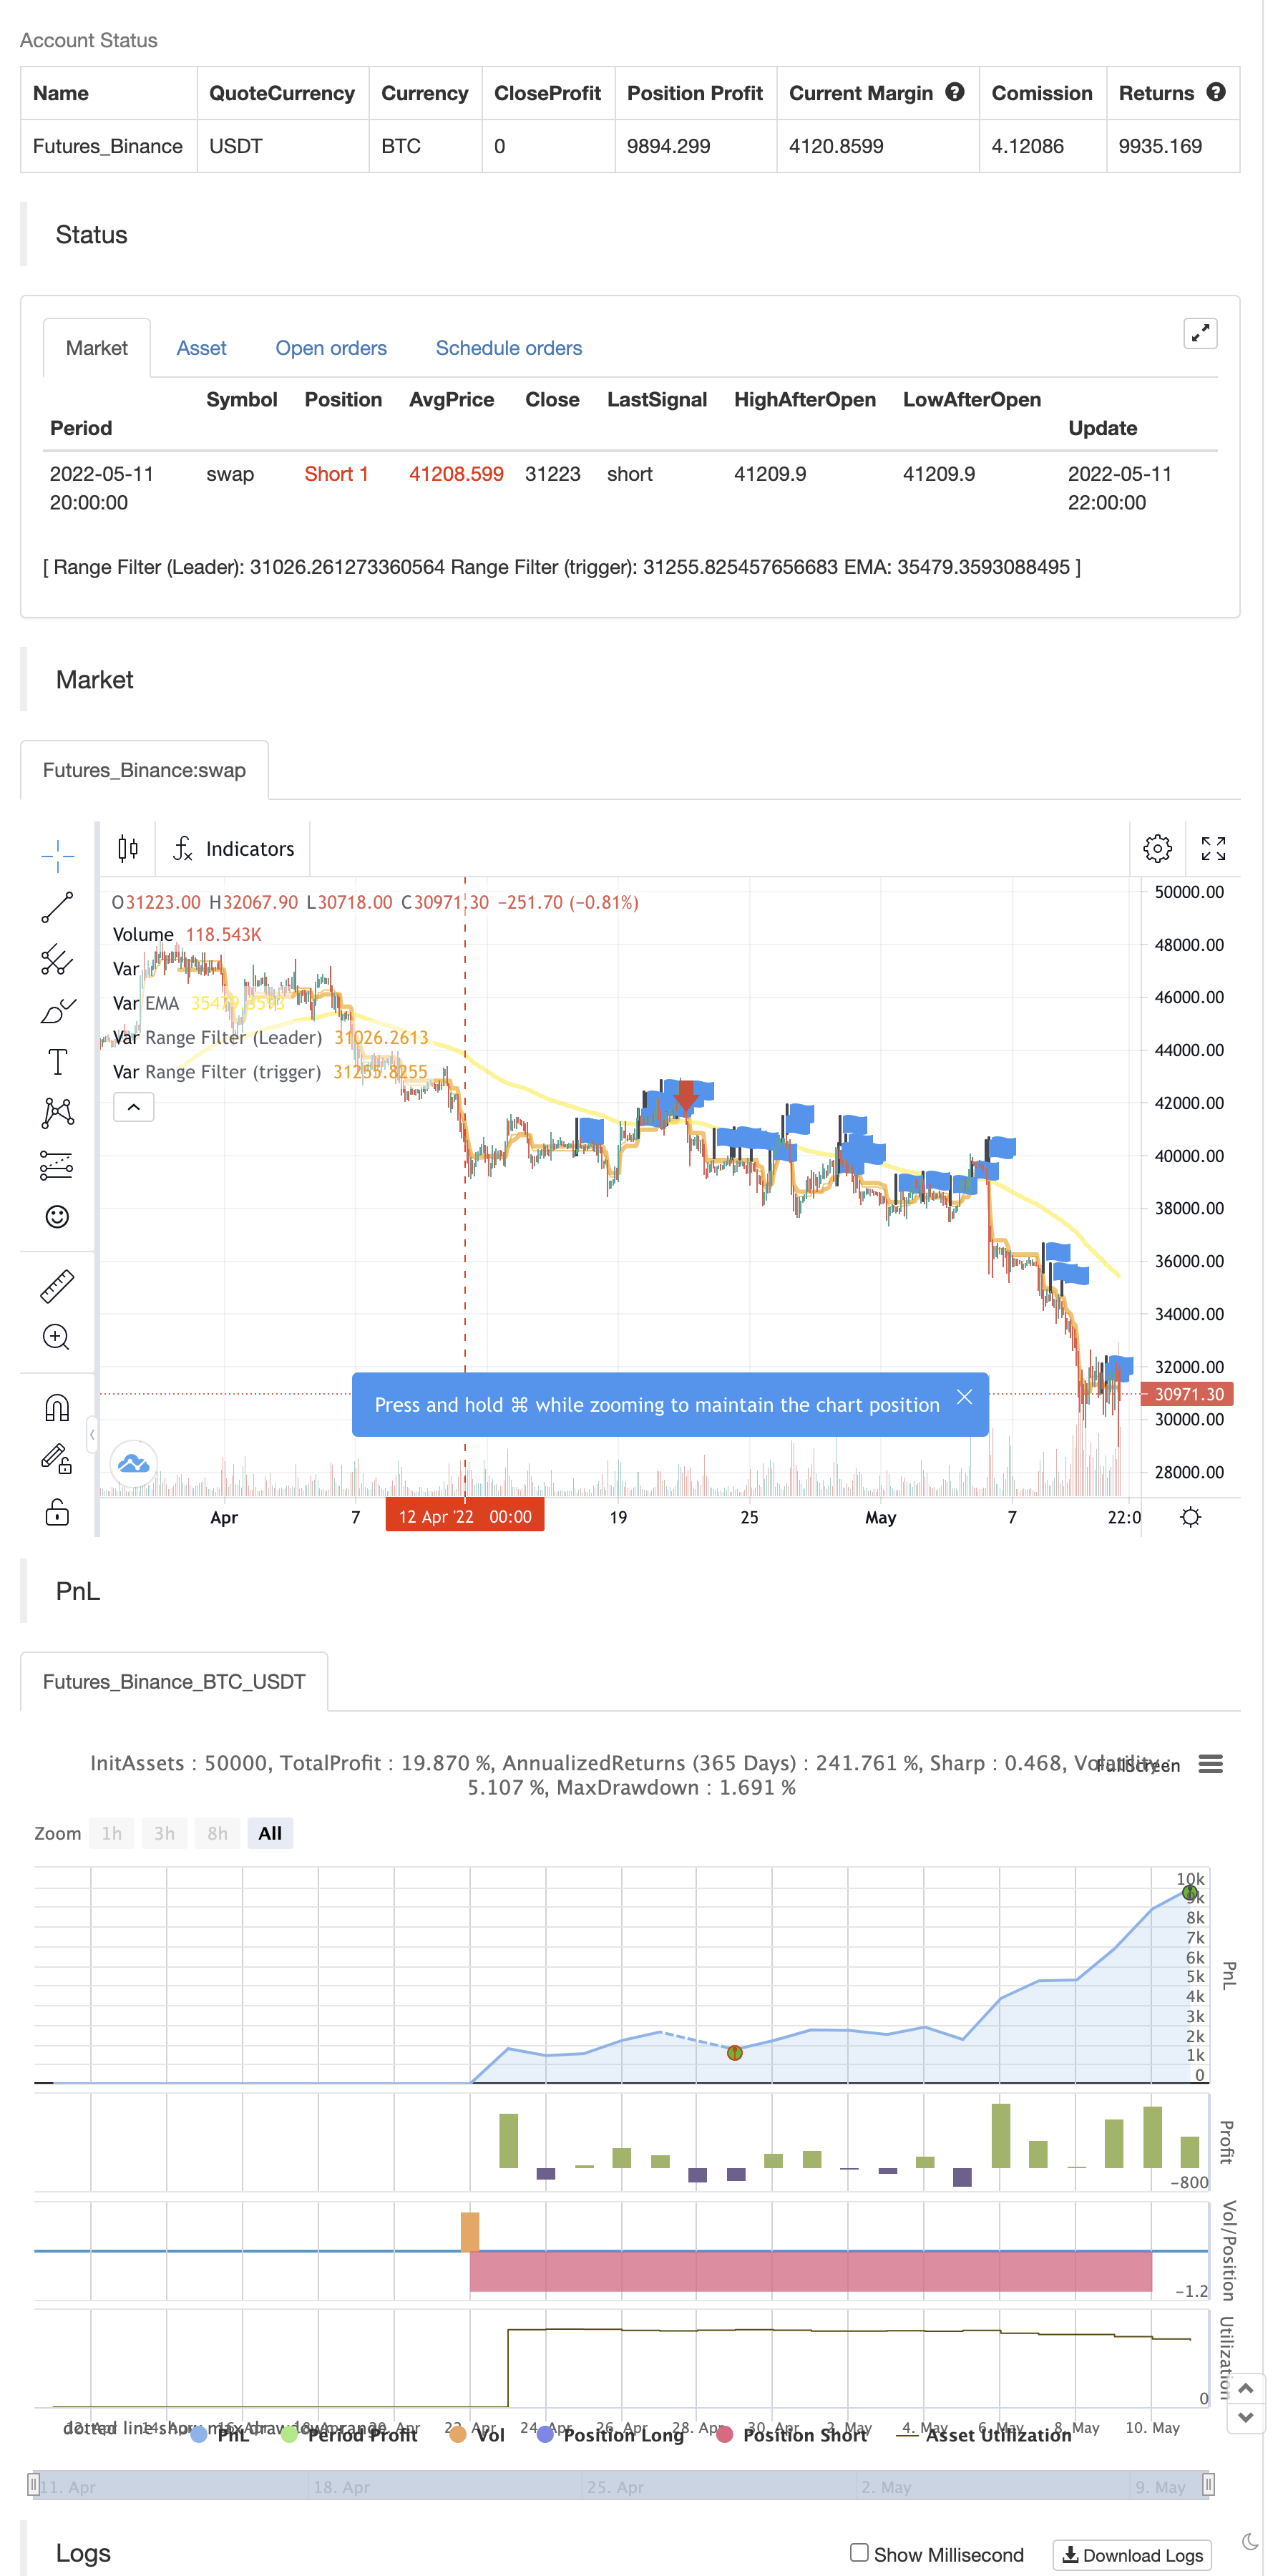
Thjs script kết hợp hai bộ lọc phạm vi, EMA và Ultimate oscillator. Đây là một loại kịch bản chỉ số với cảnh báo lý tưởng cho việc đầu cơ một phút và ban đầu được phát triển cho NAS100 nhưng đã được sử dụng thành công với các biểu tượng khác. Hai bộ lọc phạm vi được sử dụng để phát hiện khi xu hướng ngắn hạn và trung hạn ở cùng một hướng. EMA chỉ ra xu hướng dài hạn và UO được sử dụng để xác định liệu một tài sản có bị mua quá mức hoặc bán quá mức không. Chỉ số này kết hợp tốt với các chỉ số chênh lệch để thêm hợp lưu vào một sự thay đổi hướng.
Các tính năng bổ sung của chỉ số này:
- Thiết lập xem có hiển thị nhãn mua và bán chỉ khi tài sản không mua quá mức hoặc bán quá mức
- Chọn xem chỉ hiển thị mua khi giá trên đường EMA, hoặc bán chỉ dưới đường EMA
- Chỉ ra một thanh nơi một xu hướng vượt qua EMA và chọn xem crossover hoặc cross under chỉ nên được hiển thị trong một xu hướng đối lập.
- Có thể xác định sự rút lui trong một xu hướng. Điều này có thể chỉ ra sự tiếp tục của xu hướng.
- Các cảnh báo có thể được tạo ra cho sự rút lui, vượt qua EMA và cho tín hiệu mua hoặc bán
backtest
/*backtest
start: 2022-04-12 00:00:00
end: 2022-05-11 23:59:00
period: 2h
basePeriod: 15m
exchanges: [{"eid":"Futures_Binance","currency":"BTC_USDT"}]
*/

//@version=5


// Original Script > @DonovanWall

// Previous Version > @guikroth
// Ultimate Oscillator > @PineCoders

// Updated by > @jwelmac


//////////////////////////////////////////////////////////////////////////
// Range Filter x 2, EMA and UO
//////////////////////////////////////////////////////////////////////////


indicator(title='FTL - Range Filter X2 + EMA + UO', overlay=true)

// Groups

string groupLeadingRange = "Leading Range Filter"
string groupTriggerRange = "Trigger Range Filter"
string groupEMA = "EMA"
string groupUO = "Ultimate Oscillator (UO)"
string GROUP_BUY_OPTIONS = "Buy Options"
string GROUP_SELL_OPTIONS = "Sell Options"


//-------  *********  --------  *********  ---------
// Range Filter (Leader) {

// Source
src = input(defval=hl2, title='Source', group=groupLeadingRange)

// Sampling Period
per = input.int(defval=30, minval=1, title='Sampling Period', group=groupLeadingRange)

// Range Multiplier
mult = input.float(defval=2.6, minval=0.1, title='Range Multiplier', group=groupLeadingRange)

// Smooth Average Range {
smoothrng(x, t, m) =>
    wper = t * 2 - 1
    avrng = ta.ema(math.abs(x - x[1]), t)
    _smoothrng = ta.ema(avrng, wper) * m
    _smoothrng
// }
smrng = smoothrng(src, per, mult)

// Range Filter{
rngfilter(x, r) =>
    rngfilt = x
    rngfilt := x > nz(rngfilt[1]) ? x - r < nz(rngfilt[1]) ? nz(rngfilt[1]) : x - r : x + r > nz(rngfilt[1]) ? nz(rngfilt[1]) : x + r
    rngfilt
//}
filt = rngfilter(src, smrng)

// Filter Direction

upward = 0.0
upward := filt > filt[1] ? nz(upward[1]) + 1 : filt < filt[1] ? 0 : nz(upward[1])

downward = 0.0
downward := filt < filt[1] ? nz(downward[1]) + 1 : filt > filt[1] ? 0 : nz(downward[1])


// Colors

filtcolor = upward > 0 ? color.lime : downward > 0 ? color.red : color.orange

filtplot = plot(filt, color=filtcolor, linewidth=1, title='Range Filter (Leader)')

// }
//-------  *********  --------  *********  ---------

//-------  *********  --------  *********  ---------
// Range Filter (Trigger){
// Source
src2 = input(defval=ohlc4, title='Source', group=groupTriggerRange)

// Sampling Period
// Settings for 1min chart, US 100.

per2 = input.int(defval=48, minval=1, title='Sampling Period', group=groupTriggerRange)

// Range Multiplier

mult2 = input.float(defval=3.4, minval=0.1, title='Range Multiplier', group=groupTriggerRange)

// Smooth Average Range

smrng2 = smoothrng(src2, per2, mult2)

// Range Filter

rngfilt2(x, r) =>
    rngfilt = x
    rngfilt := x > nz(rngfilt[1]) ? x - r < nz(rngfilt[1]) ? nz(rngfilt[1]) : x - r : x + r > nz(rngfilt[1]) ? nz(rngfilt[1]) : x + r
    rngfilt
filt2 = rngfilt2(src2, smrng2)

// Filter Direction

upward2 = 0.0
upward2 := filt2 > filt2[1] ? nz(upward2[1]) + 1 : filt2 < filt2[1] ? 0 : nz(upward2[1])
downward2 = 0.0
downward2 := filt2 < filt2[1] ? nz(downward2[1]) + 1 : filt2 > filt2[1] ? 0 : nz(downward2[1])

// Colors

filtcolor2 = upward2 > 0 ? color.lime : downward2 > 0 ? color.red : color.orange

filtplot2 = plot(filt2, color=filtcolor2, linewidth=3, title='Range Filter (trigger)')

barcolor = src2 > filt2 and upward2 > 0
   ? color.green
   : src2 < filt2 and downward > 0
     ? color.red
     : color.rgb(120, 123, 134)
// Bar Color
//barcolor(barcolor)

// }
//-------  *********  --------  *********  ---------


//-------  *********  --------  *********  ---------
// Default EMA 144 {
len4 = input.int(144, minval=1, title='Length', group=groupEMA)
src4 = input(close, title='Source')
ema = ta.ema(src4, len4)
plot(ema, linewidth=3, color=color.new(color.yellow, 0), title='EMA')
closeAboveEma = close > ema
closeBelowEma = close < ema

uptrendCrossoverOnly = input.bool(false, title="Show crossover only in uptrend", group=groupEMA)
downtrendCrossunderOnly = input.bool(false, title="Show crossunder only in downtrend", group=groupEMA)
// END EMA
// }
//-------  *********  --------  *********  ---------


// ------ UO {
average(bp, tr_, length) => math.sum(bp, length) / math.sum(tr_, length)
uo() =>
    length1 = input.int(7, minval=1, title = "Fast Length", group=groupUO),
    length2 = input.int(14, minval=1, title = "Middle Length", group=groupUO),
    length3 = input.int(28, minval=1, title = "Slow Length", group=groupUO)
    high_ = math.max(high, close[1])
    low_ = math.min(low, close[1])
    bp = close - low_
    tr_ = high_ - low_
    avg7 = average(bp, tr_, length1)
    avg14 = average(bp, tr_, length2)
    avg28 = average(bp, tr_, length3)
    100 * (4*avg7 + 2*avg14 + avg28)/7
uoLevel = uo()
// }


// Break Outs
// Conditions {

longCond = bool(na)
shortCond = bool(na)
longCond := src > filt2 and src > src[1] and upward2 > 0 or src > filt2 and src < src[1] and upward2 > 0
shortCond := src < filt2 and src < src[1] and downward2 > 0 or src < filt2 and src > src[1] and downward2 > 0

CondIni = 0
CondIni := longCond ? 1 : shortCond ? -1 : CondIni[1]


// Long (Buy){
overBoughtLevel = input.float(defval=60, minval=50, title='UO Overbought value', group=GROUP_BUY_OPTIONS)
longWhenNotOverbought = input.bool(true, title = 'Show BUY only when not overbought (UO)', tooltip = 'Show BUY Signal only when not overbought according to UO', group=GROUP_BUY_OPTIONS)
longOnlyAboveEma = input.bool(true, title = 'Show BUY only above the EMA', tooltip = 'Show BUY Signal only when price closes above the EMA', group=GROUP_BUY_OPTIONS)

longCondition = longCond and CondIni[1] == -1
overBought = uoLevel > overBoughtLevel

if (longCondition and longWhenNotOverbought)
    longCondition := not overBought

if (longCondition and longOnlyAboveEma)
    longCondition := closeAboveEma
//}

// Short (Sell){
overSoldLevel = input.float(defval=40, maxval=50, title='UO Oversold value', group=GROUP_SELL_OPTIONS)
shortWhenNotOversold = input.bool(true, title = 'Show SELL only when not oversold (UO)', tooltip = 'Show SELL Signal only when not oversold according to UO', group=GROUP_SELL_OPTIONS)
shortOnlyBelowEma = input.bool(true, title = 'Show SELL only below the EMA', tooltip = 'Show SELL Signal only when price closes below the EMA', group=GROUP_SELL_OPTIONS)

shortCondition = shortCond and CondIni[1] == 1
overSold = uoLevel < overSoldLevel

if (shortCondition and shortWhenNotOversold)
    shortCondition := not overSold

if (shortCondition and shortOnlyBelowEma)
    shortCondition := closeBelowEma
//}

// }

// Trend directions {
trendUp = upward and upward2
trendDown = downward and downward2
// }

// MA Crossover{
arrowSize = size.small

emaCrossover = 'EMA Crossover'
didEmaCrossover = (not uptrendCrossoverOnly or trendUp) and ta.crossover(close, ema)
plotshape(
  didEmaCrossover,
  title = emaCrossover,
  style = shape.triangleup,
  size = arrowSize,
  location = location.belowbar,
  color = color.new(color.green, 0)
  )

emaCrossunder = 'EMA Crossunder'
didEmaCrossunder = (not downtrendCrossunderOnly or trendDown) and ta.crossunder(close, ema)
plotshape(
  didEmaCrossunder,
  title = emaCrossunder,
  style = shape.triangledown,
  size = arrowSize,
  location = location.abovebar,
  color = color.new(color.red, 0)
  )
// }

// Pullbacks (a possible indicator of trend continuation) {
// Conditions:
// - Both filters going in same direction
sameDirection = trendUp or trendDown

// Did the previous candle close in the opposite direction
prevOpp = (trendUp and close[1] < open[1]) or (trendDown and open[1] < close[1])

// Is the current candle in the trend direction
inTrendDirection = (trendDown and close < open) or (trendUp and close > open)

// - previous candle: crossover one or both in downtrend, crossunder one or both in uptrend
prevLimit = trendDown ? high[1] : low[1]
var previousCross = false

if (trendDown)
    previousCross := ta.crossover(prevLimit, filt[1]) or ta.crossover(prevLimit, filt2[1])
else
    previousCross := ta.crossunder(prevLimit, filt[1]) or ta.crossunder(prevLimit, filt2[1])

// - current candle: crossunder one or both in downtrend, crossover one or both in uptrend
currentReturn = trendDown
  ? close < filt
  : close > filt

pullback = prevOpp and inTrendDirection and sameDirection and previousCross and currentReturn

uptrendPullback = 'Uptrend Pullback'
isUptrendPullback = pullback and trendUp
plotshape(
  isUptrendPullback,
  title = uptrendPullback,
  style = shape.diamond,
  size = arrowSize,
  location = location.belowbar,
  color = color.new(color.green, 0)
  )

downtrendPullback = 'Downtrend Pullback'
isDowntrendPullback = pullback and trendDown
plotshape(
  isDowntrendPullback,
  title = 'Downtrend Pullback',
  style = shape.diamond,
  size = arrowSize,
  location = location.abovebar,
  color = color.new(color.red, 0)
  )

// }

// Buy/Sell Signal {
plotshape(longCondition, title='Buy Signal', text='BUY', textcolor=color.new(color.white, 0), style=shape.labelup, size=size.normal, location=location.belowbar, color=color.new(color.green, 0))
plotshape(shortCondition, title='Sell Signal', text='SELL', textcolor=color.new(color.white, 0), style=shape.labeldown, size=size.normal, location=location.abovebar, color=color.new(color.red, 0))
//}

//Alerts{

alertcondition(longCondition, title='Buy Alert', message='BUY')
alertcondition(shortCondition, title='Sell Alert', message='SELL')

alertcondition(didEmaCrossover, title = emaCrossover, message = emaCrossover)
alertcondition(didEmaCrossunder, title = emaCrossunder, message = emaCrossover)

alertcondition(isUptrendPullback, title=uptrendPullback, message = uptrendPullback)
alertcondition(isDowntrendPullback, title=downtrendPullback, message = downtrendPullback)
// }


// For use like Strategy, {

//1. Change the word  "indicator" for "strategy" at the top
//2.  Remove the "//" below

//strategy.entry( id = "Long", long = true, when = longCondition )
//strategy.close( id = "Long", when = shortCondition )
// }

if longCondition
    strategy.entry("Enter Long", strategy.long)
else if shortCondition
    strategy.entry("Enter Short", strategy.short)
Có liên quan
- Chiến lược giao dịch dựa trên các đường chéo vàng và chết MACD liên tiếp
- Chiến lược giao dịch RSI Bollinger Bands nâng cao
- Chiến lược chuyển đổi EMA ba lần
- Chiến lược đòn bẩy chéo trung bình chuyển động theo cấp số nhân
- GM-8 & ADX Chiến lược trung bình di chuyển kép
- Chiến lược chéo EMA tăng cường với RSI/MACD/ATR
- Xu hướng Z-Score theo chiến lược
- Mức đầu tư dài trên EMA với chiến lược quản lý rủi ro
- Chiến lược giao dịch VWAP
- WaveTrend Cross LazyBear Chiến lược
- Chiến lược giao dịch AlphaTradingBot
Thêm nữa
- Điểm trục cao thấp nhiều khung thời gian
- Phantom Trends theo dõi cơ sở dữ liệu chiến lược
- Phantom Trends theo dõi các cơ sở kinh doanh chiến lược
- Chiến lược theo dõi xu hướng ma
- Rainbow Oscillator
- Thương mại đường cong vốn chủ sở hữu ví dụ về kích thước vị trí
- KLineChart Demo
- Chiến lược siêu xu hướng Villa Dynamic Pivot
- Crodl's Supertrend
- RSI của zdmre
- BRAHMASTRA
- Nhóm nhạc Mobo
- SAR + 3SMMA với SL & TP
- SSS
- Mô hình cảnh báo phóng mặt trăng [Dấu hiệu]
- HALFTREND + HEMA + SMA (Chiến lược tín hiệu sai)
- RSI Divergence với Pivot, BB, SMA, EMA, SMMA, WMA, VWMA
- RSI và BB và đồng thời OverSold
- Quay nến Heikin Ashi
- Combo 2/20 EMA & Bandpass Filter