Chiến lược đột phá theo sau


Ngày tạo: 2023-10-17 16:36:49 sửa đổi lần cuối: 2023-10-17 16:36:49
sao chép: 0 Số nhấp chuột: 690
1
tập trung vào
1617
Người theo dõi

Chiến lược đột phá theo sau

Tổng quan

Chiến lược này chủ yếu thực hiện chiến lược giao dịch đột phá theo dõi thông qua chỉ số Đường An. Chiến lược này kết hợp xu hướng và phá vỡ hai phương pháp giao dịch, dựa trên phán đoán xu hướng dài, tìm kiếm các điểm đột phá có chu kỳ ngắn hơn để thực hiện các giao dịch trong xu hướng. Ngoài ra, chiến lược cũng đặt mức dừng lỗ và dừng để kiểm soát tỷ lệ rủi ro lợi nhuận cho mỗi giao dịch.

Nguyên tắc chiến lược

  1. Thiết lập các tham số cho chỉ số của đường dẫn Hồ Chí Minh, chu kỳ mặc định là 20;

  2. Thiết lập EMA Smooth Moving Average, chu kỳ mặc định là 200;

  3. Thiết lập tỷ lệ lợi nhuận rủi ro, mặc định là 1.5;

  4. Thiết lập các tham số đột phá trở lại, tương ứng với nhiều đầu và đầu trống;

  5. Một sự đột phá được ghi nhận là đỉnh hay đáy;

  6. Tín hiệu đa đầu: tạo tín hiệu đa đầu nếu đột phá trước là điểm thấp và giá cao hơn đường trên của Đồng Chiên và cao hơn đường trung bình của EMA;

  7. Tín hiệu đầu trống: tạo tín hiệu đầu trống nếu đột phá trước là điểm cao và giá thấp hơn đường đi xuống của Đồng Chi và thấp hơn đường trung bình của EMA;

  8. Sau khi vào vị trí đa đầu, thiết lập dừng lỗ là rút 5 điểm xuống đường sắt Dongguan, dừng là tỷ lệ lợi nhuận rủi ro nhân khoảng cách dừng lỗ;

  9. Sau khi vào vị trí đầu trống, thiết lập dừng lỗ là Tang Chien trên đường ray rút 5 điểm, dừng là rủi ro lợi nhuận nhân khoảng cách dừng lỗ.

Bằng cách này, chiến lược kết hợp với sự phán đoán xu hướng và hoạt động phá vỡ, có thể bắt được cơ hội ngắn hơn trong xu hướng đường dài. Đồng thời, thiết lập dừng lỗ có thể kiểm soát rủi ro lợi nhuận của một giao dịch.

Phân tích lợi thế

  1. Theo dõi xu hướng đường dài, làm theo xu hướng, tránh giao dịch ngược.

  2. Đường Đông Chiên được sử dụng như một chỉ số đường dài, kết hợp với bộ lọc đường đồng nhất của EMA, có thể đánh giá tốt hơn về hướng xu hướng.

  3. Cơ chế ngăn chặn thiệt hại kiểm soát mọi rủi ro và hạn chế thiệt hại có thể xảy ra.

  4. Tối ưu hóa tỷ lệ lợi nhuận rủi ro, có thể tăng tỷ lệ thua lỗ, theo đuổi lợi nhuận vượt trội.

  5. Cài đặt tham số phản hồi linh hoạt, có thể điều chỉnh các tham số tốt nhất cho các thị trường khác nhau.

Phân tích rủi ro

  1. Đường Đồng Chiên và đường EMA được sử dụng như các chỉ số lọc, có thể phát ra tín hiệu sai.

  2. Các giao dịch đột phá có thể dễ bị lừa và cần phải xác định rõ ràng bối cảnh xu hướng.

  3. Khoảng cách dừng lỗ là cố định, không thể điều chỉnh theo mức độ biến động của thị trường.

  4. Parameters Không gian tối ưu hóa có giới hạn, hiệu quả ổ cứng khó đảm bảo.

  5. Hệ thống giao dịch không thể chịu được quá nhiều sự kiện ngẫu nhiên, và sự kiện Black Swan có thể gây ra tổn thất lớn.

Hướng tối ưu hóa

  1. Có thể xem xét thêm các chỉ số để lọc, chẳng hạn như chỉ số rung, để cải thiện chất lượng tín hiệu.

  2. Có thể thiết lập một điểm dừng lỗ thông minh, điều chỉnh vị trí lỗ hổng theo mức độ biến động của thị trường và động lực của chỉ số ATR.

  3. Có thể sử dụng các phương pháp như học máy để kiểm tra và tối ưu hóa các tham số, làm cho nó gần gũi hơn với thị trường thực.

  4. Có thể tối ưu hóa logic nhập cảnh, đặt chỉ số VOLUME hoặc tỷ lệ dao động làm điều kiện phụ, tránh bẫy.

  5. Có thể xem xét kết hợp với các chiến lược theo dõi xu hướng hoặc học máy để tạo ra các chiến lược hỗn hợp, tăng sự ổn định.

Tóm tắt

Chiến lược này là một chiến lược phá vỡ theo dõi, ý tưởng cốt lõi là đánh giá xu hướng đường dài, để phá vỡ các tín hiệu hoạt động theo chiều hướng, và thiết lập dừng lỗ để kiểm soát rủi ro giao dịch đơn lẻ. Chiến lược này có một số lợi thế, nhưng cũng có một số không gian để tối ưu hóa. Nói chung, nếu có thể xử lý các vấn đề như thiết lập tham số, lựa chọn thời gian vào thị trường, và được tăng cường bằng các công nghệ khác, chiến lược này có thể trở thành một chiến lược theo dõi xu hướng thực tế.
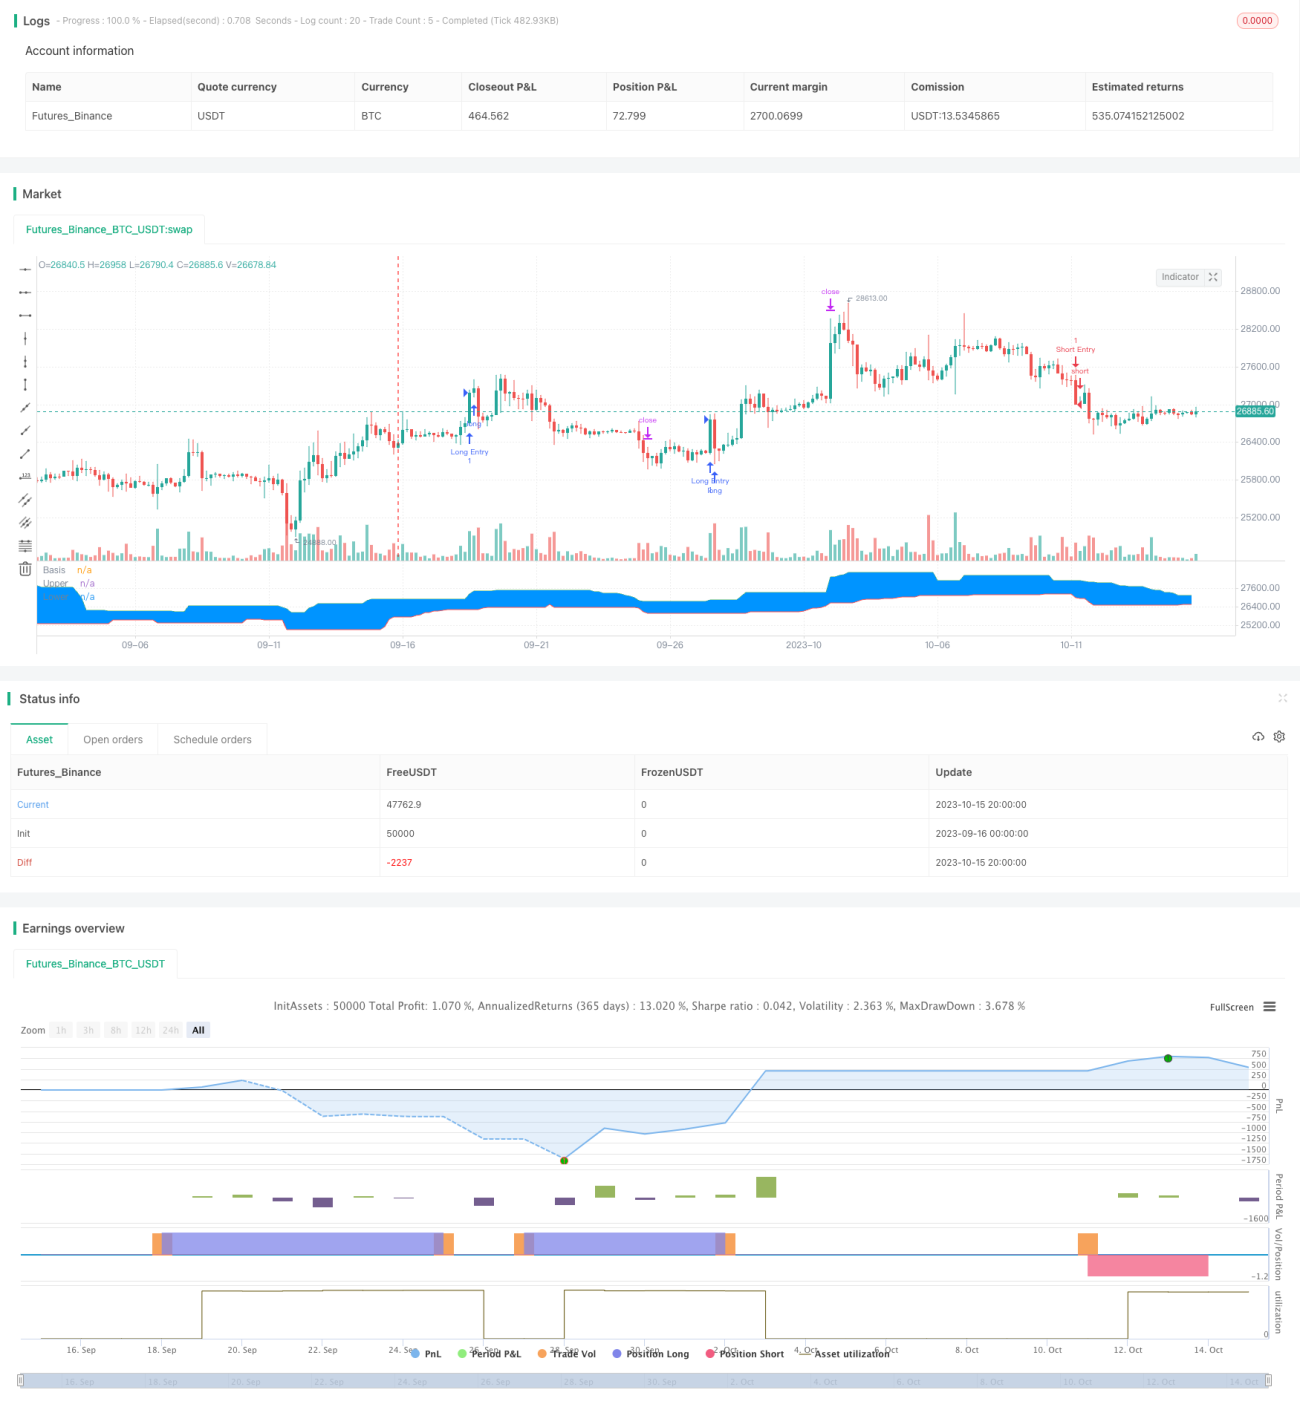
Mã nguồn chiến lược
/*backtest
start: 2023-09-16 00:00:00
end: 2023-10-16 00:00:00
period: 4h
basePeriod: 15m
exchanges: [{"eid":"Futures_Binance","currency":"BTC_USDT"}]
*/

//@version=4
// Welcome to my second script on Tradingview with Pinescript
// First of, I'm sorry for the amount of comments on this script, this script was a challenge for me, fun one for sure, but I wanted to thoroughly go through every step before making the script public
// Glad I did so because I fixed some weird things and I ended up forgetting to add the EMA into the equation so our entry signals were a mess
// This one was a lot tougher to complete compared to my MACD crossover trend strategy but I learned a ton from it, which is always good and fun
// Also I'll explain the strategy and how I got there through some creative coding(I'm saying creative because I had to figure this stuff out by myself as I couldn't find any reference codes)
// First things first. This is a Donchian Channel Breakout strategy which follows the following rules
// If the price hits the upperband of the Donchian Channel + price is above EMA and the price previously hit the lowerband of the Donchian Channel it's a buy signal
// If the price hits the lowerband of the Donchian Channel + price is below EMA and the price prevbiously hit the upper band of the Donchian Channel it's a sell signal
// Stop losses are set at the lower or upper band with a 0.5% deviation because we are acting as if those two bands are the resistance in this case
// Last but not least(yes, this gave BY FAR the most trouble to code), the profit target is set with a 1.5 risk to reward ratio
// If you have any suggestions to make my code more efficient, I'll be happy to hear so from you
// So without further ado, let's walk through the code

// The first line is basically standard because it makes backtesting so much more easy, commission value is based on Binance futures fees when you're using BNB to pay those fees in the futures market
// strategy(title="Donchian Channels", shorttitle="DC", overlay=true, default_qty_type = strategy.cash, default_qty_value = 150, initial_capital = 1000, currency = currency.USD, commission_type = "percent", commission_value = 0.036)
// The built-in Donchian Channels + an added EMA input which I grouped with the historical bars from the Donchian Channels
length          = input(20, minval=1, group = "Indicators")
lower           = lowest(length)
upper           = highest(length)
basis           = avg(upper, lower)
emaInput        = input(title = "EMA Input", type = input.integer, defval = 200, minval = 10, maxval = 400, step = 1, group = "Indicators")
// I've made three new inputs, for risk/reward ratio and for the standard pullback deviation. My advise is to not use the pullback inputs as I'm not 100% sure if they work as intended or not
riskreward      = input(title = "Risk/Reward Ratio", type = input.float, defval = 1.50, minval = 0.01, maxval = 100, step = 0.01, group = "Risk/Reward")
pullbackLong    = input(title = "Distance from Long pullback %", type = input.float, defval = 0.995, minval = 0.001, maxval = 2, step = 0.001, group = "Risk/Reward")
pullbackShort   = input(title = "Distance from Short pullback %", type = input.float, defval = 1.005, minval = 0.001, maxval = 2, step = 0.001, group = "Risk/Reward")

// Input backtest range, you can adjust these in the input options, just standard stuff
fromMonth       = input(defval = 1,    title = "From Month",      type = input.integer, minval = 1, maxval = 12, group = "Backtest Date Range")
fromDay         = input(defval = 1,    title = "From Day",        type = input.integer, minval = 1, maxval = 31, group = "Backtest Date Range")
fromYear        = input(defval = 2000, title = "From Year",       type = input.integer, minval = 1970,           group = "Backtest Date Range")
thruMonth       = input(defval = 1,    title = "Thru Month",      type = input.integer, minval = 1, maxval = 12, group = "Backtest Date Range")
thruDay         = input(defval = 1,    title = "Thru Day",        type = input.integer, minval = 1, maxval = 31, group = "Backtest Date Range")
thruYear        = input(defval = 2099, title = "Thru Year",       type = input.integer, minval = 1970,           group = "Backtest Date Range")
// Date variable also standard stuff
inDataRange     = (time >= timestamp(syminfo.timezone, fromYear, fromMonth, fromDay, 0, 0)) and (time < timestamp(syminfo.timezone, thruYear, thruMonth, thruDay, 0, 0))

// I had to makes these variables because the system has to remember whether the previous 'breakout' was a high or a low
// Also, because I based my stoploss on the upper/lower band of the indicator I had to find a way to change this value just once without losing the value, that was added, on the next bar
var previousishigh = false
var previousislow = false
var longprofit = 0.0
var shortprofit = 0.0
var stoplossLong = 0.0
var stoplossShort = 0.0
// These are used as our entry variables
emaCheck = ema(close, emaInput)
longcond = high >= upper and close > emaCheck
shortcond = low <= lower and close < emaCheck

// With these two if statements I'm changing the boolean variable above to true, we need this to decide out entry position
if high >= upper
    previousishigh := true
if low <= lower
    previousislow := true

// Made a last minute change on this part. To clean up our entry signals we don't want our breakouts, while IN a position, to change. This way we do not instantly open a new position, almost always in the opposite direction, upon exiting one
if strategy.position_size > 0 or strategy.position_size < 0 
    previousishigh := false
    previousislow := false

// Strategy inputs
// Long - previous 'breakout' has to be a low, the current price has to be a new high and above the EMA, we're not allowed to be in a position and ofcourse it has to be within our given data for backtesting purposes
if previousislow == true and longcond and strategy.position_size == 0 and inDataRange
    strategy.entry("Long Entry", strategy.long, comment = "Entry Long")
    stoplossLong := lower * pullbackLong
    longprofit := ((((1 - stoplossLong / close) * riskreward) + 1) * close)
    strategy.exit("Long Exit", "Long Entry", limit = longprofit, stop = stoplossLong, comment = "Long Exit")

// Short - Previous 'breakout' has to be a high, current price has to be a new low and lowe than the 200EMA, we're not allowed to trade when we're in a position and it has to be within our given data for backtesting purposes
if previousishigh == true and shortcond and strategy.position_size == 0 and inDataRange
    strategy.entry("Short Entry", strategy.short, comment = "Entry Short")
    stoplossShort := upper * pullbackShort
    shortprofit := (close - ((((1 - close / stoplossShort) * riskreward) * close)))
    strategy.exit("Short Exit", "Short Entry", limit = shortprofit, stop = stoplossShort, comment = "Short Exit")
    
// This plots the Donchian Channels on the chart which is just using the built-in Donchian Channels
plot(basis, "Basis", color=color.blue)
u = plot(upper, "Upper", color=color.green)
l = plot(lower, "Lower", color=color.red)
fill(u, l, color=#0094FF, transp=95, title="Background")

// These plots are to show if the variables are working as intended, it's a mess I know but I didn't have any better ideas, they work well enough for me
// plot(previousislow ? close * 0.95 : na, color=color.red, linewidth=2, style=plot.style_linebr)
// plot(previousishigh ? close * 1.05 : na, color=color.green, style=plot.style_linebr)
// plot(longprofit, color=color.purple)
// plot(shortprofit, color=color.silver)
// plot(stoplossLong)
// plot(stoplossShort)
// plot(strategy.position_size)