Chiến lược chốt lời đa khung thời gian


Ngày tạo: 2023-10-30 12:02:43 sửa đổi lần cuối: 2023-10-30 12:02:43
sao chép: 1 Số nhấp chuột: 708
1
tập trung vào
1617
Người theo dõi

Chiến lược chốt lời đa khung thời gian

Tổng quan

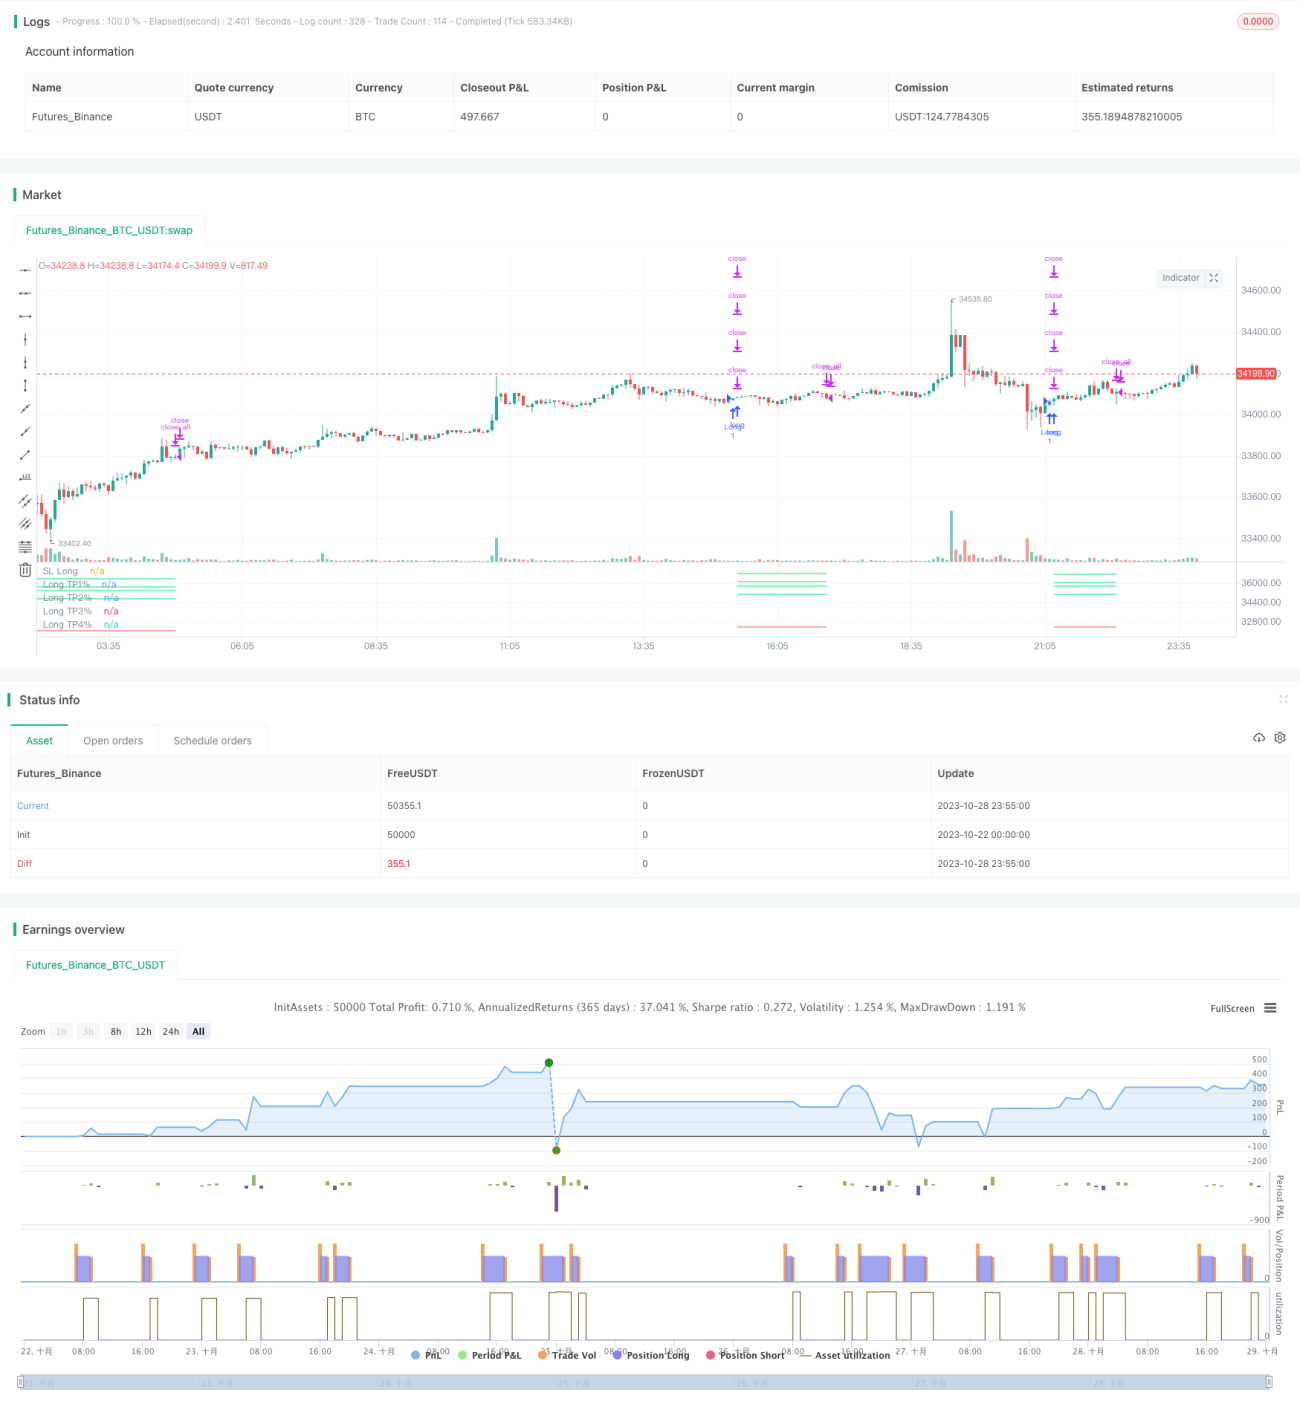
Chiến lược này được thiết kế để thực hiện quản lý dừng trong nhiều khung thời gian. Chiến lược này đồng thời sử dụng dừng phần trăm và dừng khu vực giá quan trọng trên khung thời gian chính, để quản lý dừng chính xác và hiệu quả hơn.

Nguyên tắc chiến lược

Chiến lược này bắt đầu bằng việc đưa ra các chỉ số xu hướng sóng và đưa ra nhiều tín hiệu dựa trên các chỉ số vàng.

Trong quản lý ngăn chặn, chiến lược sử dụng hai phương pháp ngăn chặn:

  1. Chấm phần trăm: Đặt nhiều giá dừng dựa trên một phần trăm của giá nhập cảnh.

  2. Hạn chế nhiều khung thời gian: vẽ đường trung bình trên đường biểu đồ ngày và 4 giờ, lấy giá của các đường trung bình này làm giá dừng.

Đối với phần trăm dừng, chiến lược đặt 4 phần trăm giá dừng khác nhau. Khi giá chạm vào mỗi giá dừng, phần trăm được đặt sẽ được giải quyết.

Đối với các lệnh dừng nhiều khung thời gian, chiến lược vẽ đường trung bình 100 ngày, đường trung bình 200 ngày trên đường ngày và đường 4 giờ. Lấy giá của các đường trung bình này làm giá dừng, và khi giá chạm vào vị trí bình thường.

Ngoài ra, chiến lược cũng đặt giá dừng lỗ. Khi giá thấp hơn giá dừng lỗ, tất cả các vị trí đều bị xóa.

Toàn bộ chiến lược cho phép quản lý ngưng ngưng toàn diện và tinh tế hơn bằng cách kết hợp sử dụng ngưng ngưng phần trăm và ngưng ngưng nhiều khung thời gian.

Lợi thế chiến lược

  • Sử dụng nén phần trăm, nén theo tỷ lệ cố định, tránh nén quá sớm hoặc nén không đầy đủ.

  • Với phân tích nhiều khung thời gian, thiết lập giá dừng chính xác hơn và chọn điểm dừng tốt hơn.

  • Có nhiều tầng ngăn chặn, có thể ngăn chặn một loạt, giảm nguy cơ.

  • Thiết lập giá dừng lỗ, kiểm soát hiệu quả rủi ro giảm giá.

  • Phương pháp này kết hợp với việc sử dụng phần trăm và nhiều khung thời gian, làm cho hệ thống được toàn diện và tinh tế hơn.

Phân tích rủi ro

  • Tỷ lệ dừng phụ thuộc vào cài đặt tham số, nếu cài đặt tham số không đúng, nó sẽ dẫn đến dừng quá sớm hoặc quá muộn.

  • Phân tích nhiều khung thời gian phụ thuộc vào chỉ số đường trung bình, đường trung bình có một chút chậm trễ, có thể có sự lệch.

  • Đặt điểm dừng không đúng có thể gây ra các điểm dừng không cần thiết.

  • Các tham số cần được tối ưu hóa thích hợp để có thể kết hợp tốt nhất giữa % và nhiều khung thời gian.

Hướng tối ưu hóa

  • Có thể thử nghiệm nhiều chỉ số đường trung bình hơn, chọn đường trung bình tốt hơn làm giá dừng quan trọng.

  • Các phương pháp dự đoán mô hình có thể được thử nghiệm, dự đoán các khu vực giá quan trọng như giá dừng.

  • Có thể giới thiệu thêm các quy tắc chặn như tỷ lệ chặn mong đợi, chặn di chuyển, v.v. để chặn toàn diện hơn.

  • Có thể kiểm tra các tham số dừng phần trăm tối ưu trong các thời gian giữ vị trí khác nhau.

  • Có thể tối ưu hóa các tham số ngăn chặn bằng cách phản hồi, làm cho lợi nhuận rủi ro tổng thể tốt hơn.

Tóm tắt

Chính sách này thực hiện quản lý dừng linh hoạt và chính xác bằng cách kết hợp dừng phần trăm và dừng nhiều khung thời gian. Chính sách có những lợi thế như lựa chọn điểm dừng tốt hơn, dừng toàn diện hơn. Ngoài ra còn có các vấn đề về cài đặt tham số, vị trí dừng lỗ.

Mã nguồn chiến lược
/*backtest
start: 2023-10-22 00:00:00
end: 2023-10-29 00:00:00
period: 5m
basePeriod: 1m
exchanges: [{"eid":"Futures_Binance","currency":"BTC_USDT"}]
*/

// This source code is subject to the terms of the Mozilla Public License 2.0 at https://mozilla.org/MPL/2.0/
// © TrendCrypto2022
//@version=5
// strategy("Take profit Multi timeframe", overlay=true, margin_long=100, margin_short=100)
takepercent  = input.bool(title="Take profit %", defval=true ,group="Set up take profit")
takemtf  = input.bool(title="Take profit Multi timeframe", defval=false ,group="Set up take profit")

//Paste your strategy at here. This is example strategy. I use WaveTrend indicator

//WaveTrend indicator
n1 = input(10, "Channel Length")
n2 = input(21, "Average Length")
oblv1 = input(60, "Over Bought Lv 1")
oblv2 = input(53, "Over Bought Lv 2")
oslv1 = input(-60, "Over Sold Lv 1")
oslv2 = input(-53, "Over Sold Lv 2")
 
ap = hlc3 
esa = ta.ema(ap, n1)
d = ta.ema(math.abs(ap - esa), n1)
ci = (ap - esa) / (0.015 * d)
tci = ta.ema(ci, n2)
 
wt1 = tci
wt2 = ta.sma(wt1,4)

//Strategy
buy = ta.crossover(wt1, wt2) and wt1 < -40
if (buy)
    strategy.entry("Long", strategy.long)


//Resistant in time D and 4H
ema_len1 = input.int(title='Ema1', defval=100, group='Take profit Mtf')
ema_len2 = input.int(title='Ema2', defval=200, group='Take profit Mtf')
src = input.source(title='Source', defval=close, group='Take profit Mtf')
tf1 = input.timeframe(title='Time frame 1', defval='240', group='Take profit Mtf')
tf2 = input.timeframe(title='Time frame 2', defval='D', group='Take profit Mtf')
htf_ma1 = ta.ema(src, ema_len1)
htf_ma2 = ta.ema(src, ema_len2)
ema1 = request.security(syminfo.tickerid, tf1, htf_ma1)
ema2 = request.security(syminfo.tickerid, tf1, htf_ma2)
ema3 = request.security(syminfo.tickerid, tf2, htf_ma1)
ema4 = request.security(syminfo.tickerid, tf2, htf_ma2)

//Plot
plotema1 = plot(ema1, color=color.new(color.silver, 0), style=plot.style_line, linewidth=1, offset=0, title='Ema100 4h', display=display.none)
plotema2 = plot(ema2, color=color.new(color.silver, 0), style=plot.style_line, linewidth=1, offset=0, title='Ema200 4h', display=display.none)
plotema3 = plot(ema3, color=color.new(color.orange, 20), style=plot.style_line, linewidth=1, offset=0, title='Ema100 D', display=display.none)
plotema4 = plot(ema4, color=color.new(color.orange, 20), style=plot.style_line, linewidth=1, offset=0, title='Ema200 D', display=display.none)

//Label take profit multitime frame
var label labelema1 = na
label.delete(labelema1)
labelema1 := label.new(x=time + 120, y=ema1, text='\n*****Ema100 4H: ' + str.tostring(math.round(ema1,4)) + '', color=color.new(#000000, 100), textcolor =  color.yellow, size=size.small, style=label.style_label_left, xloc=xloc.bar_time, yloc=yloc.price)

var label labelema2 = na
label.delete(labelema2)
labelema2 := label.new(x=time + 120, y=ema2, text='\n*****Ema200 4H: ' + str.tostring(math.round(ema2,4)) + '', color=color.new(#000000, 100), textcolor = color.yellow, size=size.small, style=label.style_label_left, xloc=xloc.bar_time, yloc=yloc.price)

var label labelema3 = na
label.delete(labelema3)
labelema3 := label.new(x=time + 120, y=ema3, text='\n*****Ema100 1D: ' + str.tostring(math.round(ema3,4)) + '', color=color.new(#000000, 100), textcolor = color.yellow, size=size.small, style=label.style_label_left, xloc=xloc.bar_time, yloc=yloc.price)

var label labelema4 = na
label.delete(labelema4)
labelema4 := label.new(x=time + 120, y=ema4, text='\n*****Ema200 1D: ' + str.tostring(math.round(ema4,4)) + '', color=color.new(#000000, 100), textcolor = color.yellow, size=size.small, style=label.style_label_left, xloc=xloc.bar_time, yloc=yloc.price)

//Set up take profit %
percent(pcnt) =>
    strategy.position_size != 0 ? math.round(pcnt / 100 * strategy.position_avg_price / syminfo.mintick) : float(na)
TP1=input.float(3, title="TP1 %", step=0.1, group="Take profit %")
TP2=input.float(5, title="TP2 %", step=1, group="Take profit %")
TP3=input.float(6, title="TP3 %", step=1, group="Take profit %")
TP4=input.float(8, title="TP4 %", step=1, group="Take profit %")

SL=input.float(5, title="Stop Loss %", step=1, group="Take profit %")
qty1=input.float(5, title="% Close At TP1", step=1, group="Take profit %")
qty2=input.float(5, title="% Close At TP2", step=1, group="Take profit %")
qty3=input.float(5, title="% Close At TP3", step=1, group="Take profit %")
qty4=input.float(5, title="% Close At TP4", step=1, group="Take profit %")
lossPnt_L = percent(SL)

//Set up take profit multi timeframe
a = array.from((ema1), (ema2), (ema3), (ema4))
tpmtf1 = array.min(a)
tpmtf2 = array.min(a, 2)
tpmtf3 = array.min(a, 3)
tpmtf4 = array.min(a, 4)
//Set up exit
long_sl_level = strategy.position_avg_price - lossPnt_L*syminfo.mintick
if takepercent == true
    strategy.exit("TP1%", "Long", qty_percent = qty1, profit = percent(TP1), loss = lossPnt_L)
    strategy.exit("TP2%", "Long", qty_percent = qty2, profit = percent(TP2), loss = lossPnt_L)
    strategy.exit("TP3%", "Long", qty_percent = qty3, profit = percent(TP3), loss = lossPnt_L)
    strategy.exit("TP4%", "Long", qty_percent = qty4, profit = percent(TP3), loss = lossPnt_L)
    strategy.close_all(when= ta.crossunder(wt1, wt2) and wt1 > 0, comment="Close All")


if takemtf == true and array.max(a, 1) > strategy.position_avg_price
    strategy.exit("TP1Mtf", "Long", qty_percent = qty1, limit = tpmtf1, stop = long_sl_level)
    strategy.exit("TP2Mtf", "Long", qty_percent = qty2, limit = tpmtf2, stop = long_sl_level)
    strategy.exit("TP3Mtf", "Long", qty_percent = qty3, limit = tpmtf3, stop = long_sl_level)
    strategy.close_all(when= ta.crossunder(wt1, wt2) and wt1 > 0, comment="Close All")

// Plot TP & SL
long_tp1_level = strategy.position_avg_price + percent(TP1)*syminfo.mintick
long_tp2_level = strategy.position_avg_price + percent(TP2)*syminfo.mintick
long_tp3_level = strategy.position_avg_price + percent(TP3)*syminfo.mintick
long_tp4_level = strategy.position_avg_price + percent(TP4)*syminfo.mintick

plot(strategy.position_size > 0 ? long_sl_level : na, color=color.red, style=plot.style_linebr, title="SL Long")

plot(strategy.position_size > 0 ? long_tp1_level : na, color=color.lime, style=plot.style_linebr, title="Long TP1%")
plot(strategy.position_size > 0 ? long_tp2_level : na, color=color.lime, style=plot.style_linebr, title="Long TP2%")
plot(strategy.position_size > 0 ? long_tp3_level : na, color=color.lime, style=plot.style_linebr, title="Long TP3%")
plot(strategy.position_size > 0 ? long_tp4_level : na, color=color.lime, style=plot.style_linebr, title="Long TP4%")

plot(strategy.position_size > 0 ? tpmtf1 : na, color=color.orange, style=plot.style_linebr, title="Long TP1Mtf", display = display.none)
plot(strategy.position_size > 0 ? tpmtf2 : na, color=color.orange, style=plot.style_linebr, title="Long TP2Mtf", display = display.none)
plot(strategy.position_size > 0 ? tpmtf3 : na, color=color.orange, style=plot.style_linebr, title="Long TP3Mtf", display = display.none)

//Label TP
if strategy.position_size > 0
    var label labellongtp1 = na
    label.delete(labellongtp1)
    labellongtp1 := label.new(x=time + 120, y=long_tp1_level, text='\nTP1: ' + str.tostring(math.round(long_tp1_level,2)) + '', color=color.new(#000000, 100), textcolor = color.lime, size=size.small, style=label.style_label_left, xloc=xloc.bar_time, yloc=yloc.price)
     
    var label labellongtp2 = na
    label.delete(labellongtp2)
    labellongtp2 := label.new(x=time + 120, y=long_tp2_level, text='\nTP2: ' + str.tostring(math.round(long_tp2_level,2)) + '', color=color.new(#000000, 100), textcolor = color.lime, size=size.small, style=label.style_label_left, xloc=xloc.bar_time, yloc=yloc.price)
     
    var label labellongtp3 = na
    label.delete(labellongtp3)
    labellongtp3 := label.new(x=time + 120, y=long_tp3_level, text='\nTP3: ' + str.tostring(math.round(long_tp3_level,2)) + '', color=color.new(#000000, 100), textcolor = color.lime, size=size.small, style=label.style_label_left, xloc=xloc.bar_time, yloc=yloc.price)
        
    var label labellongtp4 = na
    label.delete(labellongtp4)
    labellongtp4 := label.new(x=time + 120, y=long_tp4_level, text='\nTP4: ' + str.tostring(math.round(long_tp4_level,2)) + '', color=color.new(#000000, 100), textcolor = color.lime, size=size.small, style=label.style_label_left, xloc=xloc.bar_time, yloc=yloc.price)