Chiến lược giao dịch trung bình di chuyển ba

Tác giả:ChaoZhang, Ngày: 2023-11-02 14:47:45
Tags:

img

Tổng quan

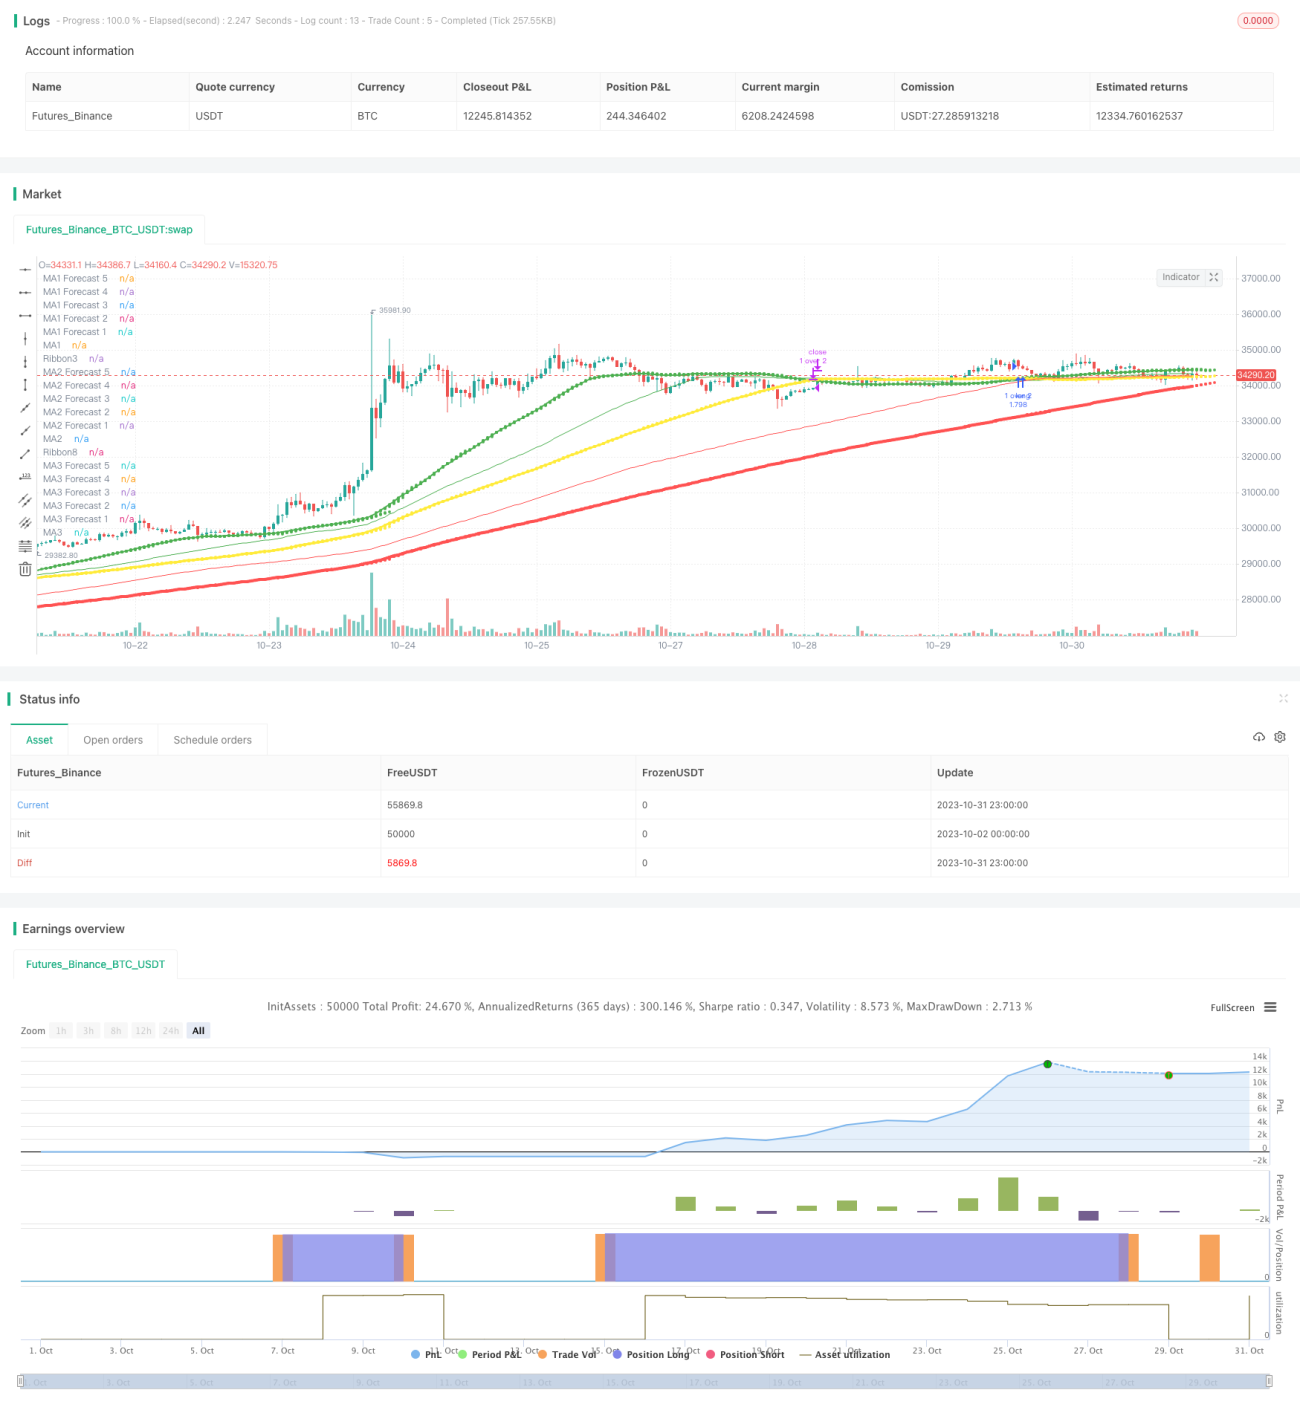
Chiến lược này là một chiến lược giao dịch theo xu hướng dựa trên ba đường trung bình động. Nó sử dụng ba đường trung bình động với các khoảng thời gian khác nhau cho các quyết định dài và ngắn, đó là một chiến lược theo dõi xu hướng điển hình.

Chiến lược logic

  1. Chiến lược sử dụng 3 đường trung bình động: MA1, MA2 và MA3. Thời gian của 3 đường trung bình động được thiết lập bởi người dùng, thường là MA1 < MA2 < MA3, ví dụ, MA1 là 50 thời gian, MA2 là 100 thời gian và MA3 là 200 thời gian.

  2. Chiến lược chủ yếu tham chiếu MA1 cho các quyết định giao dịch. Khi giai đoạn ngắn MA1 vượt qua giai đoạn dài MA2 hoặc MA3, mua dài; khi MA1 vượt dưới MA2 hoặc MA3, mua ngắn.

  3. Chiến lược có thể chọn chỉ giao dịch chéo của MA1 và MA2, hoặc chỉ giao dịch chéo của MA1 và MA3, hoặc giao dịch cả hai chéo.

  4. Khi một tín hiệu chéo xảy ra, mở một vị trí bằng cách sử dụng lệnh thị trường. Lợi nhuận và dừng lỗ được đặt là một tỷ lệ phần trăm nhất định của giá đóng, chẳng hạn như 30% lấy lợi nhuận và 15% dừng lỗ.

  5. Để tối ưu hóa, thời gian của các đường MA có thể được điều chỉnh, tỷ lệ phần trăm lợi nhuận và dừng lỗ có thể được điều chỉnh, các chỉ số khác có thể được thêm để lọc các tín hiệu, v.v.

Phân tích lợi thế

  1. Sử dụng nhiều đường trung bình động cho việc ra quyết định có thể lọc hiệu quả các đột phá sai.

  2. Việc áp dụng các kết hợp MA với các khoảng thời gian khác nhau có thể điều chỉnh động các vị trí trong xu hướng và đạt được theo dõi xu hướng.

  3. Nó linh hoạt để chỉ giao dịch Golden Cross, hoặc chỉ giao dịch Death Cross, hoặc cả hai, với các phương pháp giao dịch đa dạng.

  4. Cơ chế dừng lỗ có thể kiểm soát hiệu quả lỗ đơn.

Phân tích rủi ro

  1. Là một chiến lược theo dõi xu hướng, nó có xu hướng dừng lỗ trong các thị trường giới hạn phạm vi.

  2. Nếu thời gian MA được thiết lập không đúng cách, nó có thể dẫn đến giao dịch thường xuyên và tỷ lệ thắng thấp hơn.

  3. Nếu không cắt giảm lỗ kịp thời sau khi phá vỡ thất bại, nó có thể dẫn đến tổn thất lớn.

  4. Nếu cài đặt lấy lợi nhuận và dừng lỗ quá lỏng lẻo, lợi nhuận hoặc lỗ đơn có thể quá lớn.

Hướng dẫn tối ưu hóa

  1. Tối ưu hóa các tham số của MA để tìm ra kết hợp tham số tốt nhất.

  2. Thêm các chỉ số khác để lọc thời gian nhập cảnh, chẳng hạn như MACD, KDJ v.v.

  3. Tối ưu hóa điểm lấy lợi nhuận và dừng lỗ để cải thiện tỷ lệ lợi nhuận-rủi ro của chiến lược.

  4. Thêm kích thước vị trí như số lượng cố định cho mỗi lệnh hoặc quản lý tiền.

  5. Thêm stop loss offset cho breakout để tối ưu hóa chiến lược stop loss.

Tóm lại

Nói chung, đây là một chiến lược theo xu hướng điển hình bằng cách đánh giá sự chéo chéo của nhiều đường MA. Đây là một chiến lược theo dõi xu hướng tương đối ổn định. Có thể cải thiện thêm thông qua điều chỉnh tham số, lọc chỉ số, kích thước vị trí vv. Nhưng ý tưởng cốt lõi là đơn giản và rõ ràng, phù hợp cho người mới bắt đầu học và thực hành. Nếu các tham số được tối ưu hóa đúng cách, nó có thể đạt được lợi nhuận ổn định trong các thị trường xu hướng mạnh.


/*backtest
start: 2023-10-02 00:00:00
end: 2023-11-01 00:00:00
period: 1h
basePeriod: 15m
exchanges: [{"eid":"Futures_Binance","currency":"BTC_USDT"}]
*/

//@version=4

//
// Pine Script v4
// @author BigBitsIO
// Script Library: https://www.tradingview.com/u/BigBitsIO/#published-scripts
//

// study(title, shorttitle, overlay, format, precision)
// https://www.tradingview.com/pine-script-reference/#fun_strategy  
strategy(shorttitle = "TManyMA Strategy - STA - Stops", title="Triple Many Moving Averages", overlay=true, pyramiding=1, default_qty_type=strategy.percent_of_equity, default_qty_value=100)

// MA#Period is a variable used to store the indicator lookback period.  In this case, from the input.
// input - https://www.tradingview.com/pine-script-docs/en/v4/annotations/Script_inputs.html
MA1Period = input(50, title="MA1 Period", minval=1, step=1)
MA1Type = input(title="MA1 Type", defval="SMA", options=["RMA", "SMA", "EMA", "WMA", "HMA", "DEMA", "TEMA", "VWMA"])
MA1Source = input(title="MA1 Source", type=input.source, defval=close)
MA1Resolution = input(title="MA1 Resolution", defval="00 Current", options=["00 Current", "01 1m", "02 3m", "03 5m", "04 15m", "05 30m", "06 45m", "07 1h", "08 2h", "09 3h", "10 4h", "11 1D", "12 1W", "13 1M"])
MA1Visible = input(title="MA1 Visible", type=input.bool, defval=true) // Will automatically hide crossBovers containing this MA

MA2Period = input(100, title="MA2 Period", minval=1, step=1)
MA2Type = input(title="MA2 Type", defval="SMA", options=["RMA", "SMA", "EMA", "WMA", "HMA", "DEMA", "TEMA", "VWMA"])
MA2Source = input(title="MA2 Source", type=input.source, defval=close)
MA2Resolution = input(title="MA2 Resolution", defval="00 Current", options=["00 Current", "01 1m", "02 3m", "03 5m", "04 15m", "05 30m", "06 45m", "07 1h", "08 2h", "09 3h", "10 4h", "11 1D", "12 1W", "13 1M"])
MA2Visible = input(title="MA2 Visible", type=input.bool, defval=true) // Will automatically hide crossovers containing this MA

MA3Period = input(200, title="MA3 Period", minval=1, step=1)
MA3Type = input(title="MA3 Type", defval="SMA", options=["RMA", "SMA", "EMA", "WMA", "HMA", "DEMA", "TEMA", "VWMA"])
MA3Source = input(title="MA3 Source", type=input.source, defval=close)
MA3Resolution = input(title="MA3 Resolution", defval="00 Current", options=["00 Current", "01 1m", "02 3m", "03 5m", "04 15m", "05 30m", "06 45m", "07 1h", "08 2h", "09 3h", "10 4h", "11 1D", "12 1W", "13 1M"])
MA3Visible = input(title="MA3 Visible", type=input.bool, defval=true) // Will automatically hide crossovers containing this MA

ShowCrosses = input(title="Show Crosses", type=input.bool, defval=false)

ForecastBias = input(title="Forecast Bias", defval="Neutral", options=["Neutral", "Bullish", "Bearish"])
ForecastBiasPeriod = input(14, title="Forecast Bias Period")
ForecastBiasMagnitude = input(1, title="Forecast Bias Magnitude", minval=0.25, maxval=20, step=0.25)
ShowForecasts = input(title="Show Forecasts", type=input.bool, defval=true)

ShowRibbons = input(title="Show Ribbons", type=input.bool, defval=true)

TradeMA12Crosses = input(title="Trade MA 1-2 Crosses", type=input.bool, defval=true)
TradeMA13Crosses = input(title="Trade MA 1-3 Crosses", type=input.bool, defval=true)
TradeMA23Crosses = input(title="Trade MA 2-3 Crosses", type=input.bool, defval=true)

TakeProfitPercent = input(30, title="Take Profit Percent", minval=0.01, step=0.5)
StopLossPercent = input(15, title="Stop Loss Percent", minval=0.01, step=0.5)


// MA# is a variable used to store the actual moving average value.
// if statements - https://www.tradingview.com/pine-script-reference/#op_if
// MA functions - https://www.tradingview.com/pine-script-reference/ (must search for appropriate MA)
// custom functions in  pine - https://www.tradingview.com/wiki/Declaring_Functions
ma(MAType, MASource, MAPeriod) =>
    if MAType == "SMA"
        sma(MASource, MAPeriod)
    else
        if MAType == "EMA"
            ema(MASource, MAPeriod)
        else
            if MAType == "WMA"
                wma(MASource, MAPeriod)
            else
                if MAType == "RMA"
                    rma(MASource, MAPeriod)
                else
                    if MAType == "HMA"
                        wma(2*wma(MASource, MAPeriod/2)-wma(MASource, MAPeriod), round(sqrt(MAPeriod)))
                    else
                        if MAType == "DEMA"
                            e = ema(MASource, MAPeriod)
                            2 * e - ema(e, MAPeriod)
                        else
                            if MAType == "TEMA"
                                e = ema(MASource, MAPeriod)
                                3 * (e - ema(e, MAPeriod)) + ema(ema(e, MAPeriod), MAPeriod)
                            else
                                if MAType == "VWMA"
                                    vwma(MASource, MAPeriod)
                                
res(MAResolution) =>
    if MAResolution == "00 Current"
        timeframe.period
    else
        if MAResolution == "01 1m"
            "1"
        else
            if MAResolution == "02 3m"
                "3"
            else
                if MAResolution == "03 5m"
                    "5"
                else
                    if MAResolution == "04 15m"
                        "15"
                    else
                        if MAResolution == "05 30m"
                            "30"
                        else
                            if MAResolution == "06 45m"
                                "45"
                            else
                                if MAResolution == "07 1h"
                                    "60"
                                else
                                    if MAResolution == "08 2h"
                                        "120"
                                    else
                                        if MAResolution == "09 3h"
                                            "180"
                                        else
                                            if MAResolution == "10 4h"
                                                "240"
                                            else
                                                if MAResolution == "11 1D"
                                                    "1D"
                                                else
                                                    if MAResolution == "12 1W"
                                                        "1W"
                                                    else
                                                        if MAResolution == "13 1M"
                                                            "1M"

// https://www.tradingview.com/pine-script-reference/#fun_request.security
MA1 = request.security(syminfo.tickerid, res(MA1Resolution), ma(MA1Type, MA1Source, MA1Period))     
MA2 = request.security(syminfo.tickerid, res(MA2Resolution), ma(MA2Type, MA2Source, MA2Period))
MA3 = request.security(syminfo.tickerid, res(MA3Resolution), ma(MA3Type, MA3Source, MA3Period))   
                    
// Plotting crossover/unders for all combinations of crosses
// Crossovers no longer detected in label code, they need to be re-used for strategy - crosses and visibility must be set
MA12Crossover = MA1Visible and MA2Visible and crossover(MA1, MA2)
MA12Crossunder = MA1Visible and MA2Visible and crossunder(MA1, MA2)
MA13Crossover = MA1Visible and MA3Visible and crossover(MA1, MA3)
MA13Crossunder = MA1Visible and MA3Visible and crossunder(MA1, MA3)
MA23Crossover = MA2Visible and MA3Visible and crossover(MA2, MA3)
MA23Crossunder = MA2Visible and MA3Visible and crossunder(MA2, MA3)

// https://www.tradingview.com/pine-script-reference/v4/#fun_label%7Bdot%7Dnew
if ShowCrosses and MA12Crossunder
    lun1 = label.new(bar_index, na, tostring(MA1Period)+' '+MA1Type+' crossed under '+tostring(MA2Period)+' '+MA2Type, 
      color=color.red, 
      textcolor=color.red,
      style=label.style_xcross, size=size.small)
    label.set_y(lun1, MA1)
if ShowCrosses and MA12Crossover
    lup1 = label.new(bar_index, na, tostring(MA1Period)+' '+MA1Type+' crossed over '+tostring(MA2Period)+' '+MA2Type, 
      color=color.green, 
      textcolor=color.green,
      style=label.style_xcross, size=size.small)
    label.set_y(lup1, MA1)
if ShowCrosses and MA13Crossunder
    lun2 = label.new(bar_index, na, tostring(MA1Period)+' '+MA1Type+' crossed under '+tostring(MA3Period)+' '+MA3Type, 
      color=color.red, 
      textcolor=color.red,
      style=label.style_xcross, size=size.small)
    label.set_y(lun2, MA1)
if ShowCrosses and MA13Crossover
    lup2 = label.new(bar_index, na, tostring(MA1Period)+' '+MA1Type+' crossed over '+tostring(MA3Period)+' '+MA3Type, 
      color=color.green, 
      textcolor=color.green,
      style=label.style_xcross, size=size.small)
    label.set_y(lup2, MA1)
if ShowCrosses and MA23Crossunder
    lun3 = label.new(bar_index, na, tostring(MA2Period)+' '+MA2Type+' crossed under '+tostring(MA3Period)+' '+MA3Type, 
      color=color.red, 
      textcolor=color.red,
      style=label.style_xcross, size=size.small)
    label.set_y(lun3, MA2)
if ShowCrosses and MA23Crossover
    lup3 = label.new(bar_index, na, tostring(MA2Period)+' '+MA2Type+' crossed over '+tostring(MA3Period)+' '+MA3Type, 
      color=color.green, 
      textcolor=color.green,
      style=label.style_xcross, size=size.small)
    label.set_y(lup3, MA2) 

// plot - This will draw the information on the chart
// plot - https://www.tradingview.com/pine-script-docs/en/v4/annotations/plot_annotation.html
plot(MA1Visible ? MA1 : na, color=color.green, linewidth=2, title="MA1")
plot(MA2Visible ? MA2 : na, color=color.yellow, linewidth=3, title="MA2")
plot(MA3Visible ? MA3 : na, color=color.red, linewidth=4, title="MA3")


// Forecasting - forcasted prices are calculated using our MAType and MASource for the MAPeriod - the last X candles.
//              it essentially replaces the oldest X candles, with the selected source * X candles
// Bias - We'll add an "adjustment" for each additional candle being forecasted based on ATR of the previous X candles
// custom functions in  pine - https://www.tradingview.com/wiki/Declaring_Functions
bias(Bias, BiasPeriod) =>
    if Bias == "Neutral"
        0
    else
        if Bias == "Bullish"
            (atr(BiasPeriod) * ForecastBiasMagnitude)
        else
            if Bias == "Bearish"
                ((atr(BiasPeriod)  * ForecastBiasMagnitude) * -1) // multiplying by -1 to make it a negative, bearish bias


// Note - Can not show forecasts on different resolutions at the moment, x-axis is an issue
Bias = bias(ForecastBias, ForecastBiasPeriod) // 14 is default atr period
MA1Forecast1 = (request.security(syminfo.tickerid, res(MA1Resolution), ma(MA1Type, MA1Source, MA1Period - 1)) * (MA1Period - 1) + ((MA1Source * 1) + (Bias * 1))) / MA1Period 
MA1Forecast2 = (request.security(syminfo.tickerid, res(MA1Resolution), ma(MA1Type, MA1Source, MA1Period - 2)) * (MA1Period - 2) + ((MA1Source * 2) + (Bias * 2))) / MA1Period
MA1Forecast3 = (request.security(syminfo.tickerid, res(MA1Resolution), ma(MA1Type, MA1Source, MA1Period - 3)) * (MA1Period - 3) + ((MA1Source * 3) + (Bias * 3))) / MA1Period
MA1Forecast4 = (request.security(syminfo.tickerid, res(MA1Resolution), ma(MA1Type, MA1Source, MA1Period - 4)) * (MA1Period - 4) + ((MA1Source * 4) + (Bias * 4))) / MA1Period
MA1Forecast5 = (request.security(syminfo.tickerid, res(MA1Resolution), ma(MA1Type, MA1Source, MA1Period - 5)) * (MA1Period - 5) + ((MA1Source * 5) + (Bias * 5))) / MA1Period


plot(MA1Resolution == "00 Current" and ShowForecasts and MA1Visible ? MA1Forecast1 : na, color=color.green, linewidth=1, style=plot.style_circles, title="MA1 Forecast 1", offset=1, show_last=1)
plot(MA1Resolution == "00 Current" and ShowForecasts and MA1Visible ? MA1Forecast2 : na, color=color.green, linewidth=1, style=plot.style_circles, title="MA1 Forecast 2", offset=2, show_last=1)
plot(MA1Resolution == "00 Current" and ShowForecasts and MA1Visible ? MA1Forecast3 : na, color=color.green, linewidth=1, style=plot.style_circles, title="MA1 Forecast 3", offset=3, show_last=1)
plot(MA1Resolution == "00 Current" and ShowForecasts and MA1Visible ? MA1Forecast4 : na, color=color.green, linewidth=1, style=plot.style_circles, title="MA1 Forecast 4", offset=4, show_last=1)
plot(MA1Resolution == "00 Current" and ShowForecasts and MA1Visible ? MA1Forecast5 : na, color=color.green, linewidth=1, style=plot.style_circles, title="MA1 Forecast 5", offset=5, show_last=1)


MA2Forecast1 = (request.security(syminfo.tickerid, res(MA2Resolution), ma(MA2Type, MA2Source, MA2Period - 1)) * (MA2Period - 1) + ((MA1Source * 1) + (Bias * 1))) / MA2Period
MA2Forecast2 = (request.security(syminfo.tickerid, res(MA2Resolution), ma(MA2Type, MA2Source, MA2Period - 2)) * (MA2Period - 2) + ((MA1Source * 2) + (Bias * 2))) / MA2Period
MA2Forecast3 = (request.security(syminfo.tickerid, res(MA2Resolution), ma(MA2Type, MA2Source, MA2Period - 3)) * (MA2Period - 3) + ((MA1Source * 3) + (Bias * 3))) / MA2Period
MA2Forecast4 = (request.security(syminfo.tickerid, res(MA2Resolution), ma(MA2Type, MA2Source, MA2Period - 4)) * (MA2Period - 4) + ((MA1Source * 4) + (Bias * 4))) / MA2Period
MA2Forecast5 = (request.security(syminfo.tickerid, res(MA2Resolution), ma(MA2Type, MA2Source, MA2Period - 5)) * (MA2Period - 5) + ((MA1Source * 5) + (Bias * 5))) / MA2Period

plot(MA2Resolution == "00 Current" and ShowForecasts and MA2Visible ? MA2Forecast1 : na, color=color.yellow, linewidth=1, style=plot.style_circles, title="MA2 Forecast 1", offset=1, show_last=1)
plot(MA2Resolution == "00 Current" and ShowForecasts and MA2Visible ? MA2Forecast2 : na, color=color.yellow, linewidth=1, style=plot.style_circles, title="MA2 Forecast 2", offset=2, show_last=1)
plot(MA2Resolution == "00 Current" and ShowForecasts and MA2Visible ? MA2Forecast3 : na, color=color.yellow, linewidth=1, style=plot.style_circles, title="MA2 Forecast 3", offset=3, show_last=1)
plot(MA2Resolution == "00 Current" and ShowForecasts and MA2Visible ? MA2Forecast4 : na, color=color.yellow, linewidth=1, style=plot.style_circles, title="MA2 Forecast 4", offset=4, show_last=1)
plot(MA2Resolution == "00 Current" and ShowForecasts and MA2Visible ? MA2Forecast5 : na, color=color.yellow, linewidth=1, style=plot.style_circles, title="MA2 Forecast 5", offset=5, show_last=1)


MA3Forecast1 = (request.security(syminfo.tickerid, res(MA3Resolution), ma(MA3Type, MA3Source, MA3Period - 1)) * (MA3Period - 1) + ((MA1Source * 1) + (Bias * 1))) / MA3Period
MA3Forecast2 = (request.security(syminfo.tickerid, res(MA3Resolution), ma(MA3Type, MA3Source, MA3Period - 2)) * (MA3Period - 2) + ((MA1Source * 2) + (Bias * 2))) / MA3Period
MA3Forecast3 = (request.security(syminfo.tickerid, res(MA3Resolution), ma(MA3Type, MA3Source, MA3Period - 3)) * (MA3Period - 3) + ((MA1Source * 3) + (Bias * 3))) / MA3Period
MA3Forecast4 = (request.security(syminfo.tickerid, res(MA3Resolution), ma(MA3Type, MA3Source, MA3Period - 4)) * (MA3Period - 4) + ((MA1Source * 4) + (Bias * 4))) / MA3Period
MA3Forecast5 = (request.security(syminfo.tickerid, res(MA3Resolution), ma(MA3Type, MA3Source, MA3Period - 5)) * (MA3Period - 5) + ((MA1Source * 5) + (Bias * 5))) / MA3Period

plot(MA3Resolution == "00 Current" and ShowForecasts and MA3Visible ? MA3Forecast1 : na, color=color.red, linewidth=1, style=plot.style_circles, title="MA3 Forecast 1", offset=1, show_last=1)
plot(MA3Resolution == "00 Current" and ShowForecasts and MA3Visible ? MA3Forecast2 : na, color=color.red, linewidth=1, style=plot.style_circles, title="MA3 Forecast 2", offset=2, show_last=1)
plot(MA3Resolution == "00 Current" and ShowForecasts and MA3Visible ? MA3Forecast3 : na, color=color.red, linewidth=1, style=plot.style_circles, title="MA3 Forecast 3", offset=3, show_last=1)
plot(MA3Resolution == "00 Current" and ShowForecasts and MA3Visible ? MA3Forecast4 : na, color=color.red, linewidth=1, style=plot.style_circles, title="MA3 Forecast 4", offset=4, show_last=1)
plot(MA3Resolution == "00 Current" and ShowForecasts and MA3Visible ? MA3Forecast5 : na, color=color.red, linewidth=1, style=plot.style_circles, title="MA3 Forecast 5", offset=5, show_last=1)


// Ribbon related code
// For Ribbons to work - they must use the same MAType, MAResolution and MASource.  This is to ensure the ribbons are fair between one to the other.
// Ribbons also will usually look better if MA1Period < MA2Period and MA2Period < MA3Period

// custom functions in  pine - https://www.tradingview.com/wiki/Declaring_Functions
// This function is used to calculate the period to be used on a ribbon based on existing MAs
rperiod(P1, P2, Step, Ribbons) =>
    ((abs(P1 - P2)) / (Ribbons + 1) * Step) + min(P1, P2)
    // divide by +1 so that 5 lines can show.  Divide by 5 and one line shows up on another MA

// MA1-MA2
Ribbon1 = request.security(syminfo.tickerid, res(MA1Resolution), ma(MA1Type, MA1Source, rperiod(MA1Period, MA2Period, 1, 5)))
Ribbon2 = request.security(syminfo.tickerid, res(MA1Resolution), ma(MA1Type, MA1Source, rperiod(MA1Period, MA2Period, 2, 5)))
Ribbon3 = request.security(syminfo.tickerid, res(MA1Resolution), ma(MA1Type, MA1Source, rperiod(MA1Period, MA2Period, 3, 5)))
Ribbon4 = request.security(syminfo.tickerid, res(MA1Resolution), ma(MA1Type, MA1Source, rperiod(MA1Period, MA2Period, 4, 5)))
Ribbon5 = request.security(syminfo.tickerid, res(MA1Resolution), ma(MA1Type, MA1Source, rperiod(MA1Period, MA2Period, 5, 5)))

plot(ShowRibbons and MA1Type == MA2Type and MA1Resolution == MA2Resolution and MA1Source == MA2Source ? Ribbon1 : na, color=color.green, linewidth=1, style=plot.style_line, title="Ribbon1", transp=90)
plot(ShowRibbons and MA1Type == MA2Type and MA1Resolution == MA2Resolution and MA1Source == MA2Source ? Ribbon2 : na, color=color.green, linewidth=1, style=plot.style_line, title="Ribbon2", transp=85)
plot(ShowRibbons and MA1Type == MA2Type and MA1Resolution == MA2Resolution and MA1Source == MA2Source ? Ribbon3 : na, color=color.green, linewidth=1, style=plot.style_line, title="Ribbon3", transp=80)
plot(ShowRibbons and MA1Type == MA2Type and MA1Resolution == MA2Resolution and MA1Source == MA2Source ? Ribbon4 : na, color=color.yellow, linewidth=1, style=plot.style_line, title="Ribbon4", transp=75)
plot(ShowRibbons and MA1Type == MA2Type and MA1Resolution == MA2Resolution and MA1Source == MA2Source ? Ribbon5 : na, color=color.yellow, linewidth=1, style=plot.style_line, title="Ribbon5", transp=70)

// MA2-MA3
Ribbon6 = request.security(syminfo.tickerid, res(MA2Resolution), ma(MA2Type, MA2Source, rperiod(MA2Period, MA3Period, 1, 5)))
Ribbon7 = request.security(syminfo.tickerid, res(MA2Resolution), ma(MA2Type, MA2Source, rperiod(MA2Period, MA3Period, 2, 5)))
Ribbon8 = request.security(syminfo.tickerid, res(MA2Resolution), ma(MA2Type, MA2Source, rperiod(MA2Period, MA3Period, 3, 5)))
Ribbon9 = request.security(syminfo.tickerid, res(MA2Resolution), ma(MA2Type, MA2Source, rperiod(MA2Period, MA3Period, 4, 5)))
Ribbon10 = request.security(syminfo.tickerid, res(MA2Resolution), ma(MA2Type, MA2Source, rperiod(MA2Period, MA3Period, 5, 5)))
        
plot(ShowRibbons and MA2Type == MA3Type and MA2Resolution == MA3Resolution and MA2Source == MA3Source ? Ribbon6 : na, color=color.yellow, linewidth=1, style=plot.style_line, title="Ribbon6", transp=70)
plot(ShowRibbons and MA2Type == MA3Type and MA2Resolution == MA3Resolution and MA2Source == MA3Source ? Ribbon7 : na, color=color.yellow, linewidth=1, style=plot.style_line, title="Ribbon7", transp=75)
plot(ShowRibbons and MA2Type == MA3Type and MA2Resolution == MA3Resolution and MA2Source == MA3Source ? Ribbon8 : na, color=color.red, linewidth=1, style=plot.style_line, title="Ribbon8", transp=80)
plot(ShowRibbons and MA2Type == MA3Type and MA2Resolution == MA3Resolution and MA2Source == MA3Source ? Ribbon9 : na, color=color.red, linewidth=1, style=plot.style_line, title="Ribbon9", transp=85)
plot(ShowRibbons and MA2Type == MA3Type and MA2Resolution == MA3Resolution and MA2Source == MA3Source ? Ribbon10 : na, color=color.red, linewidth=1, style=plot.style_line, title="Ribbon10", transp=90)

// Strategy Specific
ProfitTarget = (close * (TakeProfitPercent / 100)) / syminfo.mintick
LossTarget = (close * (StopLossPercent / 100)) / syminfo.mintick

if MA12Crossover and TradeMA12Crosses
    //https://www.tradingview.com/pine-script-reference/#fun_strategy{dot}entry
    strategy.entry("1 over 2", true) // buy by market
    strategy.exit("profit or loss", "1 over 2", profit = ProfitTarget, loss = LossTarget)
if MA12Crossunder and TradeMA12Crosses
    //https://www.tradingview.com/pine-script-reference/#fun_strategy{dot}close
    strategy.close("1 over 2") // sell by market
    
if MA13Crossover and TradeMA13Crosses
    //https://www.tradingview.com/pine-script-reference/#fun_strategy{dot}entry
    strategy.entry("1 over 3", true) // buy by market
    strategy.exit("profit or loss", "1 over 3", profit = ProfitTarget, loss = LossTarget)
if MA13Crossunder and TradeMA13Crosses
    //https://www.tradingview.com/pine-script-reference/#fun_strategy{dot}close
    strategy.close("1 over 3") // sell by market
    
if MA23Crossover and TradeMA23Crosses
    //https://www.tradingview.com/pine-script-reference/#fun_strategy{dot}entry
    strategy.entry("2 over 3", true) // buy by market
    strategy.exit("profit or loss", "2 over 3", profit = ProfitTarget, loss = LossTarget)
if MA23Crossunder and TradeMA23Crosses
    //https://www.tradingview.com/pine-script-reference/#fun_strategy{dot}close
    strategy.close("2 over 3") // sell by market
    

Thêm nữa