Chiến lược xu hướng siêu Ichimoku

Tổng quan
Chiến lược vượt trội là chiến lược giao dịch xu hướng dựa trên các chỉ số vượt trội để đưa ra quyết định giao dịch. Chiến lược này sử dụng đường chuyển đổi, đường chuẩn và mối quan hệ giữa các chỉ số vượt trội để xác định hướng xu hướng hiện tại và kết hợp với sự hồi phục của giá để tham gia.
Chiến lược siêu một được sử dụng chủ yếu cho các giao dịch xu hướng trên đường dài trung bình, có thể kiếm lợi nhuận trong xu hướng lớn hơn. Chiến lược này cũng có khả năng nhận biết xu hướng mạnh mẽ.
Nguyên tắc chiến lược
Chiến lược này dựa trên các yếu tố sau:
-
**Mối quan hệ giữa đường chuyển đổi và đường chuẩn:**Đường chuyển đổi sẽ tăng khi lên, giảm khi xuống
-
**Màu sắc của những dải mây:**Khi đám mây màu xanh lá cây, bạn sẽ thấy con chim ưng, khi màu đỏ, bạn sẽ thấy con chim ưng.
-
**Giá đã được điều chỉnh lại:**Các nhà đầu tư khác cũng có thể tham gia, nhưng họ chỉ có thể tham gia khi giá cả nằm ngoài đường chuyển đổi và đường chuẩn.
Cụ thể, các tín hiệu giao dịch của chiến lược là:
Gửi thêm tín hiệu:
- Đường chuyển đổi cao hơn đường chuẩn
- Giá cao hơn đường chuyển đổi và đường chuẩn
- Đường chuyển đổi và đường chuẩn cao hơn dải mây
- Giá thu hồi dưới đường chuyển đổi và đường chuẩn
Đánh dấu không khí:
- Đường chuyển đổi thấp hơn đường chuẩn
- Giá thấp hơn đường chuyển đổi và đường chuẩn
- Đường chuyển đổi và đường chuẩn dưới vùng mây
- Giá thu hồi trên đường chuyển đổi và đường chuẩn
Khi đồng thời đáp ứng tín hiệu làm nhiều / trống, hãy thực hiện hoạt động mở vị trí theo tình trạng vị trí.
Phân tích lợi thế
Chiến lược siêu một có những lợi thế sau:
-
Sử dụng một bộ chỉ số siêu một để xác định hướng xu hướng, độ chính xác cao hơn
-
Đường chuyển đổi và đường chuẩn có thể xác định rõ xu hướng ngắn hạn, và dải mây có thể xác định xu hướng dài hạn
-
Điều kiện yêu cầu giá quay trở lại đường xoay, tránh thiệt hại do phá vỡ giả
-
Kiểm soát rủi ro sử dụng giá dừng tối đa trong thời gian gần đây để kiểm soát hiệu quả tổn thất đơn lẻ
-
Lợi nhuận ổn định hơn thua lỗ hợp lý
-
Có thể áp dụng trong các chu kỳ khác nhau, phù hợp với giao dịch xu hướng đường dài
-
Kế hoạch chiến lược rõ ràng, dễ hiểu, có nhiều khả năng tối ưu hóa tham số
-
Có thể hoạt động tốt trong nhiều môi trường thị trường
Phân tích rủi ro
Chiến lược vượt qua 1 cũng có những rủi ro sau:
-
Trong một thị trường chấn động, stop loss có thể được kích hoạt thường xuyên, ảnh hưởng đến hiệu quả lợi nhuận
-
Khi xu hướng thay đổi nhanh chóng, không thể đảo ngược vị trí kịp thời có thể dẫn đến tổn thất
-
Tỷ lệ lợi nhuận và lỗ hổng được thiết lập không phù hợp với tất cả các giống và cần điều chỉnh các tham số cho các tiêu chuẩn khác nhau
-
Có thể có lợi nhuận hạn chế khi có ít không gian để di chuyển sau khi vượt qua vùng mây
-
Các tham số chỉ số cần được kiểm tra và tối ưu hóa nhiều lần, không phù hợp với các giống có tham số được điều chỉnh thường xuyên
Bạn có thể làm giảm nguy cơ bằng cách:
-
Tối ưu hóa các tham số để phù hợp hơn với các đặc điểm khác nhau về chu kỳ và giống
-
Kết hợp các chỉ số khác để lọc tín hiệu nhập cảnh, tránh phá vỡ giả trong thị trường chấn động
-
Động thái điều chỉnh vị trí dừng để giảm khả năng dừng bị kích hoạt
-
Kiểm tra các thiết lập tỷ lệ lợi nhuận khác nhau
-
Sử dụng các phương pháp như hình dạng biểu đồ để xác định tín hiệu xu hướng mạnh hoặc yếu
Hướng tối ưu hóa
Chiến lược vượt qua một có thể được tối ưu hóa từ:
-
Tối ưu hóa các tham số đường chuyển đổi và đường chuẩn để phù hợp hơn với đặc điểm của các loại được giao dịch
-
Tối ưu hóa các tham số của dải mây để dải mây có thể đánh giá chính xác hơn về xu hướng dài hạn
-
Tối ưu hóa thuật toán dừng lỗ, chẳng hạn như thiết lập dừng lỗ theo ATR hoặc dừng động
-
Bộ lọc tín hiệu kết hợp với các chỉ số khác, cấu hình nhiều điều kiện lọc hơn, giảm khả năng nhập sai
-
Tối ưu hóa các thiết lập so sánh lợi nhuận và thua lỗ, thích ứng với các chiến lược trên các giống khác nhau và các đặc điểm về chu kỳ
-
Sử dụng phương pháp Martingale để quản lý vị thế, thích ứng với tần số biến động khác nhau của thị trường
-
Sử dụng phương pháp học máy để tối ưu hóa các tham số để đạt được sự ổn định cao hơn
-
Thiết lập các khoảng thời gian giao dịch khác nhau, điều chỉnh cho các đặc điểm giao dịch trong và giữa các phiên giao dịch
Tóm tắt
Chiến lược vượt trội là một chiến lược rất phù hợp cho giao dịch xu hướng đường dài và trung bình. Nó có lợi thế rõ ràng trong việc sử dụng chỉ số vượt trội để xác định hướng xu hướng, đồng thời kết hợp với việc điều chỉnh giá để vào thị trường có thể ngăn chặn một cách hiệu quả. Bằng cách thiết lập tham số tối ưu hóa, chiến lược có thể đạt được lợi nhuận ổn định trên nhiều giống và nhiều chu kỳ.
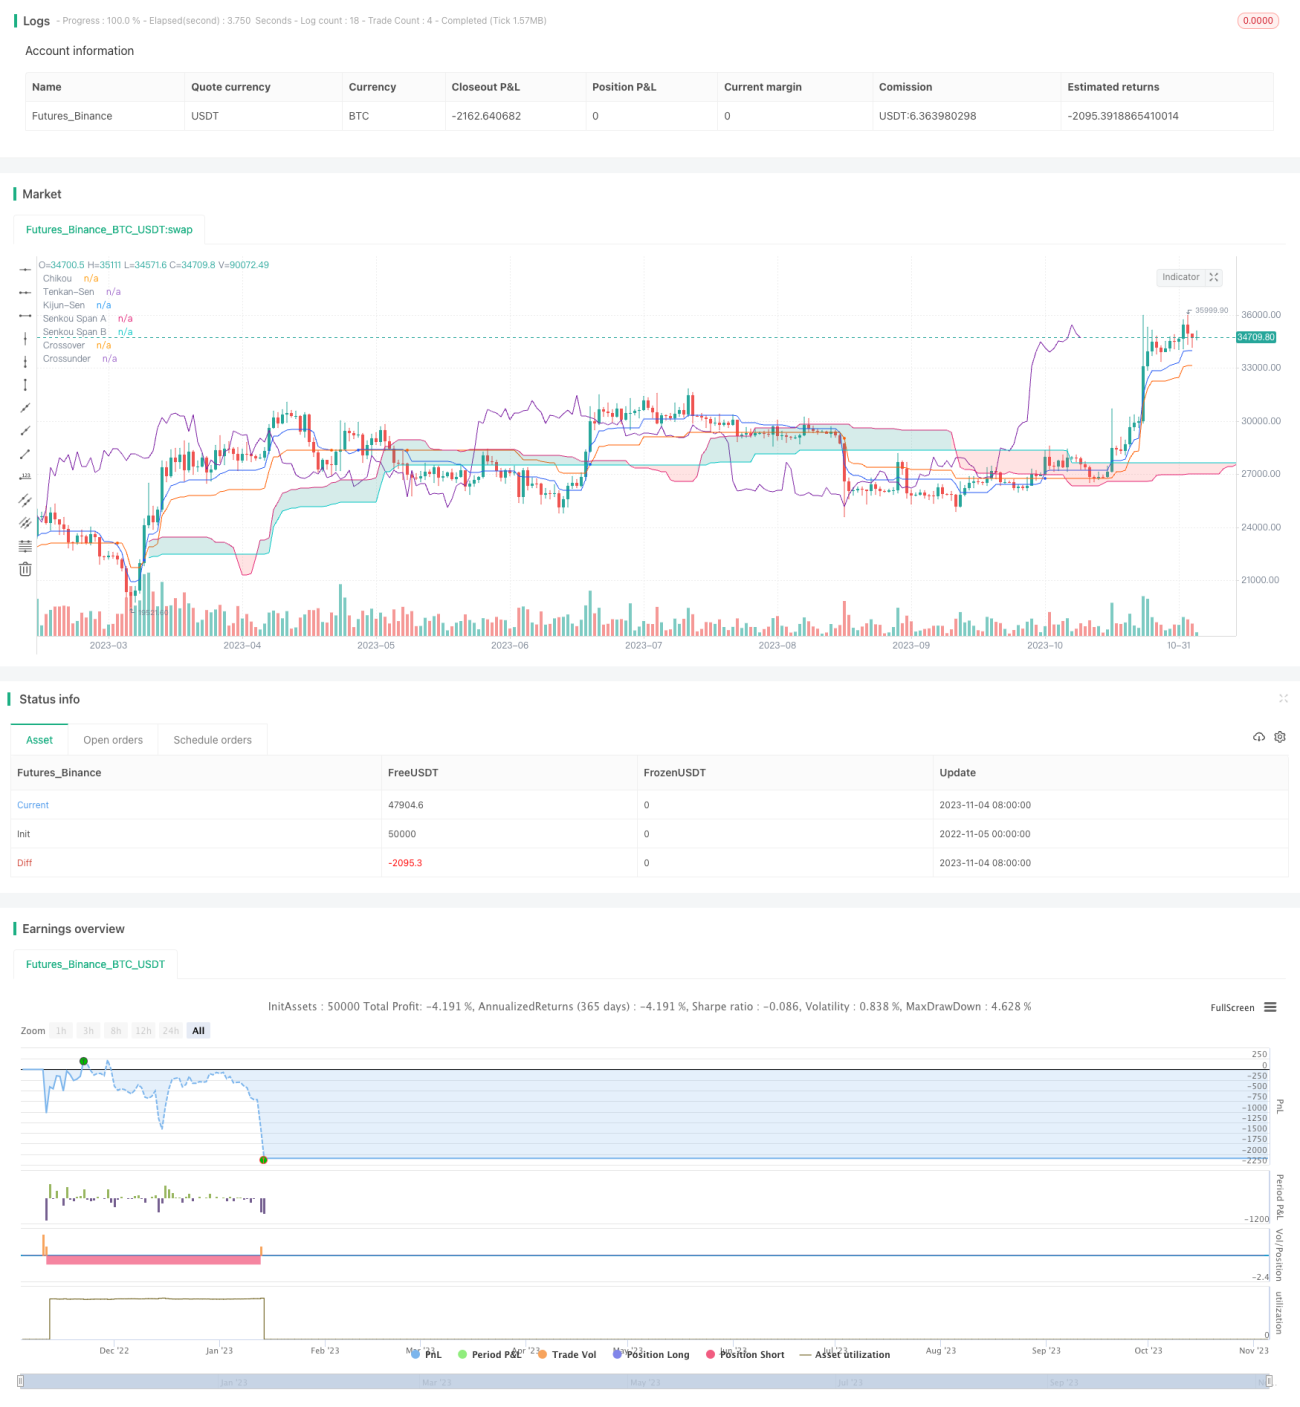
/*backtest
start: 2022-11-05 00:00:00
end: 2023-11-05 00:00:00
period: 1d
basePeriod: 1h
exchanges: [{"eid":"Futures_Binance","currency":"BTC_USDT"}]
*/

// Strategy based on the the SuperIchi indicator.
//
// Strategy was designed for the purpose of back testing.
// See strategy documentation for info on trade entry logic.- 1