
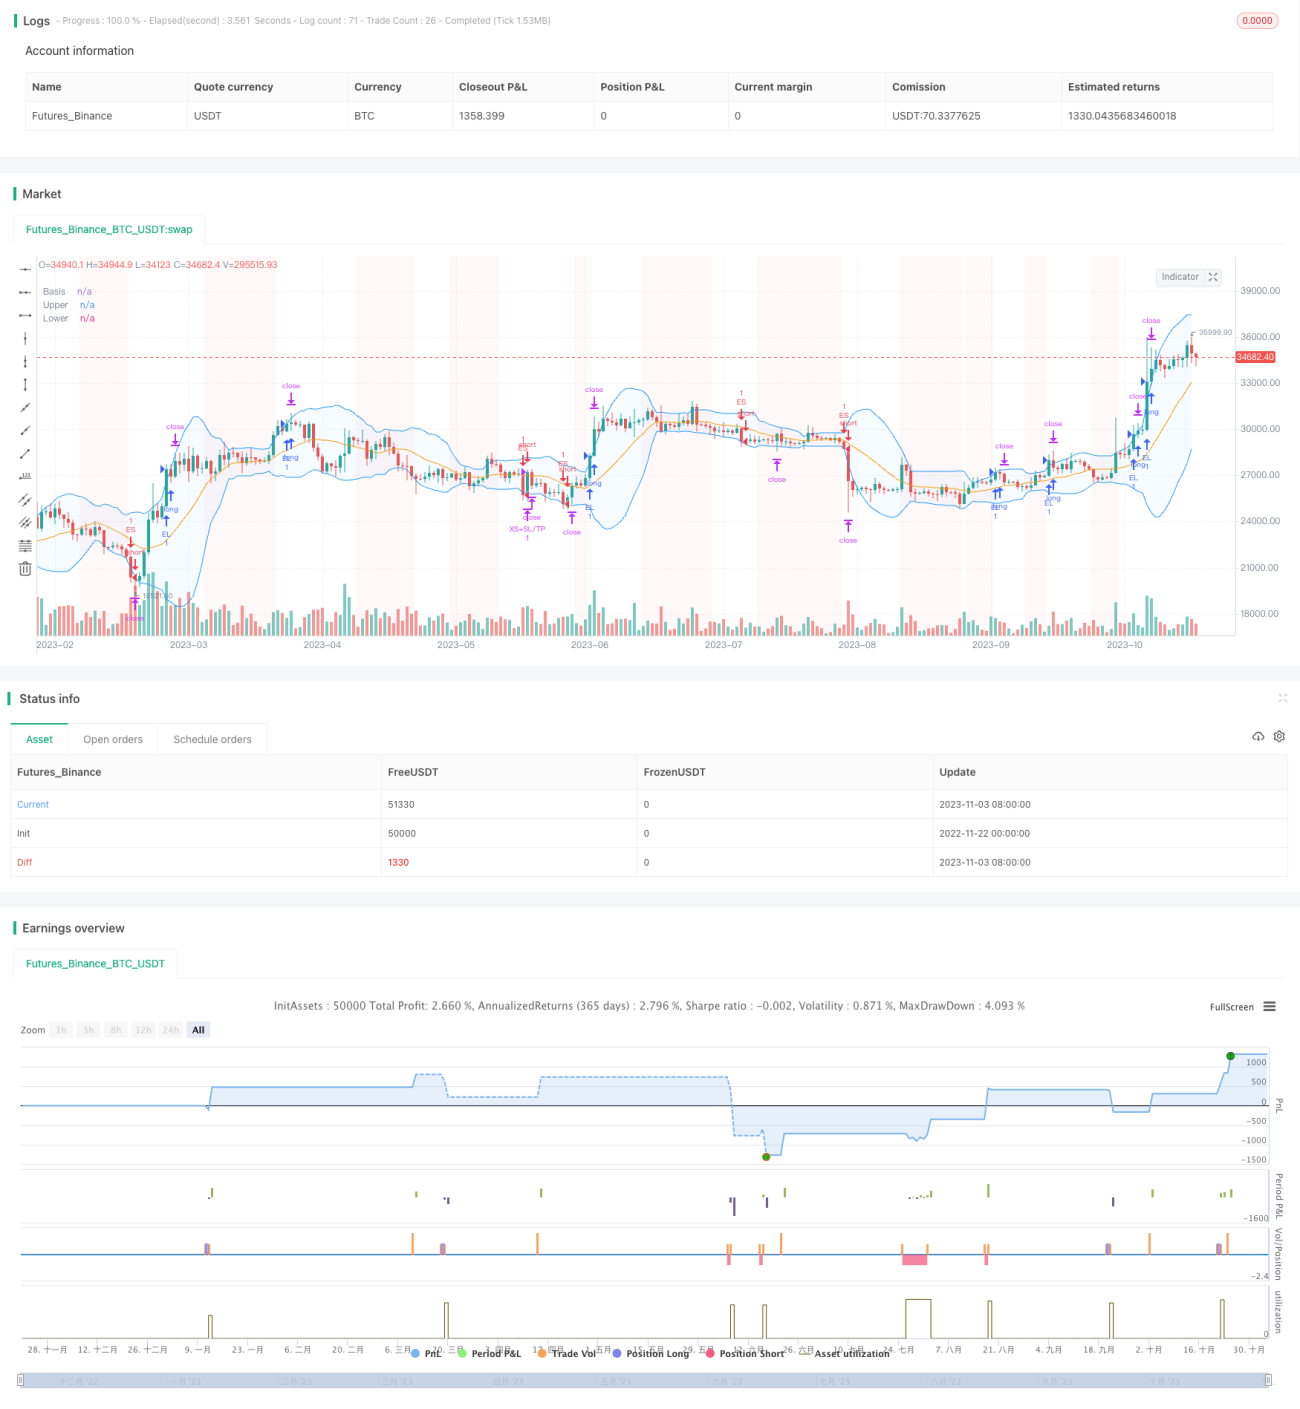
Chiến lược phá vỡ Brin Belt là một chiến lược theo dõi xu hướng ngắn hạn dựa trên chỉ số Brin Belt. Nó có thể thực hiện các hoạt động theo cả hai hướng đầu nhiều và đầu trống, áp dụng cho các hợp đồng hiện tại và vĩnh viễn, đặc biệt áp dụng cho các tình huống xu hướng.
Chiến lược này có khả năng cấu hình cao, cho phép người dùng thiết lập các tham số trong thời gian và độ lệch, bộ lọc xu hướng, bộ lọc biến động, bộ lọc hướng giao dịch, bộ lọc tỷ lệ thay đổi và bộ lọc ngày. Ngoài ra, nó cũng thiết lập dừng lỗ, dừng và theo dõi dừng lỗ cho các vị trí đầu nhiều đầu và đầu rỗng, đảm bảo phương pháp quản lý rủi ro toàn diện.
Các chỉ số cốt lõi của chiến lược này là các vùng Brin. Các vùng Brin bao gồm ba đường trung tâm, đường trên và đường dưới, đại diện cho đường trung bình của giá cả, giới hạn trên và giới hạn dưới của sự biến động. Khi giá phá vỡ đường trên, hãy làm nhiều hơn; Khi giá phá vỡ đường dưới, hãy làm trống.
Ngoài ra, chiến lược cũng có nhiều bộ lọc phụ để tránh giao dịch Noise. Các bộ lọc này bao gồm:
Trình lọc xu hướng: giá làm nhiều trên đường trung bình di chuyển, giá làm rỗng dưới đường trung bình di chuyển;
Bộ lọc biến động: chỉ giao dịch khi biến động mở rộng;
Bộ lọc hướng giao dịch: tùy thuộc vào thuộc tính của biểu tượng, bạn có thể chọn giao dịch chỉ nhiều, chỉ trần hoặc giao dịch hai chiều;
Bộ lọc tỷ lệ thay đổi: giá được nhập khi tỷ lệ thay đổi so với giá đóng cửa ngày giao dịch trước đạt đến một mức nhất định;
Bộ lọc ngày: Cài đặt khoảng thời gian để đo lại.
Tín hiệu giao dịch được tạo ra khi tất cả các điều kiện lọc được đáp ứng. Đặt lệnh dừng, dừng lỗ và theo dõi dừng lỗ đảm bảo quản lý rủi ro. Ngoài ra, thiết lập lỗ tối đa trong ngày tránh rút lui lớn trong một ngày.
Chiến lược này có những ưu điểm sau:
Các nhà đầu tư đã sử dụng các chỉ số BRI như là một tín hiệu giao dịch cốt lõi, có độ tin cậy cao.
Thiết kế bộ lọc đa dạng tránh sai lệch giao dịch, có thể cấu hình được;
Cứu thương, ngăn chặn, theo dõi, ngăn chặn toàn diện và linh hoạt;
Cài đặt lỗ tối đa trong ngày có hiệu quả kiểm soát rút tiền trong một ngày.
Nó phù hợp với thị trường đang có xu hướng và có tiềm năng thu nhập lớn.
Chiến lược này cũng có những rủi ro:
Brinh đai phá vỡ dễ bị phá vỡ ở đầu và dưới, có thể gây ra thiệt hại;
Trong thị trường này, các bộ lọc có thể quá nghiêm ngặt và bỏ lỡ các cơ hội giao dịch.
Một vụ nhảy vọt lớn có thể dẫn đến thiệt hại trực tiếp vượt qua ngưỡng dừng lỗ;
Trong những trường hợp cực đoan, không thể hoàn toàn tránh được những tổn thất lớn.
Đối với các rủi ro trên, điều kiện lọc có thể được nới lỏng thích hợp, hoặc can thiệp bằng tay để đóng một số vị trí, giảm khoảng cách dừng lỗ, v.v.
Chiến lược này có thể được tối ưu hóa theo các khía cạnh sau:
Cố gắng thử các tổ hợp tham số khác nhau để tìm ra phạm vi tham số tốt nhất.
Thêm mô hình học máy để tối ưu hóa động của các tham số;
Nghiên cứu các phương pháp hiệu quả hơn, chẳng hạn như dừng thời gian, dừng tần số;
Các nhà nghiên cứu đã nghiên cứu các yếu tố khác nhau của tình trạng khủng hoảng, bao gồm:
Kết hợp các sản phẩm liên quan, thực hiện đánh giá thống kê.
Chiến lược phá vỡ vòng Brin là một chiến lược theo dõi xu hướng đường ngắn đáng tin cậy. Nó sử dụng chỉ số vòng Brin làm tín hiệu và thiết lập nhiều bộ lọc để đảm bảo độ tin cậy của tín hiệu. Đồng thời, cơ chế ngăn chặn và kiểm soát rủi ro toàn diện kiểm soát rủi ro. Chiến lược này phù hợp với thị trường xu hướng hoạt động và có tiềm năng thu lợi nhuận tốt.
/*backtest
start: 2022-11-22 00:00:00
end: 2023-11-04 05:20:00
period: 1d
basePeriod: 1h
exchanges: [{"eid":"Futures_Binance","currency":"BTC_USDT"}]
*/
//@version=5
strategy("Bollinger Bands - Breakout Strategy",overlay=true
)
// Define the length of the Bollinger Bands
bbLengthInput = input.int (15,title="Length", group="Bollinger Bands", inline="BB")
bbDevInput = input.float (2.0,title="StdDev", group="Bollinger Bands", inline="BB")
// Define the settings for the Trend Filter
trendFilterInput = input.bool(false, title="Above/Below", group = "Trend Filter", inline="Trend")
trendFilterPeriodInput = input(223,title="", group = "Trend Filter", inline="Trend")
trendFilterType = input.string (title="", defval="EMA",options=["EMA","SMA","RMA", "WMA"], group = "Trend Filter", inline="Trend")
volatilityFilterInput = input.bool(true,title="StdDev", group = "Volatility Filter", inline="Vol")
volatilityFilterStDevLength = input(15,title="",group = "Volatility Filter", inline="Vol")
volatilityStDevMaLength = input(15,title=">MA",group = "Volatility Filter", inline="Vol")
// ROC Filter
// f_security function by LucF for PineCoders available here: https://www.tradingview.com/script/cyPWY96u-How-to-avoid-repainting-when-using-security-PineCoders-FAQ/
f_security(_sym, _res, _src, _rep) => request.security(_sym, _res, _src[not _rep and barstate.isrealtime ? 1 : 0])[_rep or barstate.isrealtime ? 0 : 1]
high_daily = f_security(syminfo.tickerid, "D", high, false)
roc_enable = input.bool(false, "", group="ROC Filter from CloseD", inline="roc")
roc_threshold = input.float(1, "Treshold", step=0.5, group="ROC Filter from CloseD", inline="roc")
closed = f_security(syminfo.tickerid,"1D",close, false)
roc_filter= roc_enable ? (close-closed)/closed*100 > roc_threshold : true
// Trade Direction Filter
// tradeDirectionInput = input.string("Auto",options=["Auto", "Long&Short","Long Only", "Short Only"], title="Trade", group="Direction Filter", tooltip="Auto: if a PERP is detected (in the symbol description), trade long and short\n Otherwise as per user-input")
// tradeDirection = switch tradeDirectionInput
// "Auto" => str.contains(str.lower(syminfo.description), "perp") or str.contains(str.lower(syminfo.description), ".p") ? strategy.direction.all : strategy.direction.long
// "Long&Short" => strategy.direction.all
// "Long Only" => strategy.direction.long
// "Short Only" => strategy.direction.short
// => strategy.direction.all
// strategy.risk.allow_entry_in(tradeDirection)
// Calculate and plot the Bollinger Bands
[bbMiddle, bbUpper, bbLower] = ta.bb (close, bbLengthInput, bbDevInput)
plot(bbMiddle, "Basis", color=color.orange)
bbUpperPlot = plot(bbUpper, "Upper", color=color.blue)
bbLowerrPlot = plot(bbLower, "Lower", color=color.blue)
fill(bbUpperPlot, bbLowerrPlot, title = "Background", color=color.new(color.blue, 95))
// Calculate and view Trend Filter
float tradeConditionMa = switch trendFilterType
"EMA" => ta.ema(close, trendFilterPeriodInput)
"SMA" => ta.sma(close, trendFilterPeriodInput)
"RMA" => ta.rma(close, trendFilterPeriodInput)
"WMA" => ta.wma(close, trendFilterPeriodInput)
// Default used when the three first cases do not match.
=> ta.wma(close, trendFilterPeriodInput)
trendConditionLong = trendFilterInput ? close > tradeConditionMa : true
trendConditionShort = trendFilterInput ? close < tradeConditionMa : true
plot(trendFilterInput ? tradeConditionMa : na, color=color.yellow)
// Calculate and view Volatility Filter
stdDevClose = ta.stdev(close,volatilityFilterStDevLength)
volatilityCondition = volatilityFilterInput ? stdDevClose > ta.sma(stdDevClose,volatilityStDevMaLength) : true
bbLowerCrossUnder = ta.crossunder(close, bbLower)
bbUpperCrossOver = ta.crossover(close, bbUpper)
bgcolor(volatilityCondition ? na : color.new(color.red, 95))
// Date Filter
start = input(timestamp("2017-01-01"), "Start", group="Date Filter")
finish = input(timestamp("2050-01-01"), "End", group="Date Filter")
date_filter = true
// Entry and Exit Conditions
entryLongCondition = bbUpperCrossOver and trendConditionLong and volatilityCondition and date_filter and roc_filter
entryShortCondition = bbLowerCrossUnder and trendConditionShort and volatilityCondition and date_filter and roc_filter
exitLongCondition = bbLowerCrossUnder
exitShortCondition = bbUpperCrossOver
// Orders
if entryLongCondition
strategy.entry("EL", strategy.long)
if entryShortCondition
strategy.entry("ES", strategy.short)
if exitLongCondition
strategy.close("EL")
if exitShortCondition
strategy.close("ES")
// Long SL/TP/TS
xl_ts_percent = input.float(2,step=0.5, title= "TS", group="Exit Long", inline="LTS", tooltip="Trailing Treshold %")
xl_to_percent = input.float(0.5, step=0.5, title= "TO", group="Exit Long", inline="LTS", tooltip="Trailing Offset %")
xl_ts_tick = xl_ts_percent * close/syminfo.mintick/100
xl_to_tick = xl_to_percent * close/syminfo.mintick/100
xl_sl_percent = input.float (2, step=0.5, title="SL",group="Exit Long", inline="LSLTP")
xl_tp_percent = input.float(9, step=0.5, title="TP",group="Exit Long", inline="LSLTP")
xl_sl_price = strategy.position_avg_price * (1-xl_sl_percent/100)
xl_tp_price = strategy.position_avg_price * (1+xl_tp_percent/100)
strategy.exit("XL+SL/TP", "EL", stop=xl_sl_price, limit=xl_tp_price, trail_points=xl_ts_tick, trail_offset=xl_to_tick,comment_loss= "XL-SL", comment_profit = "XL-TP",comment_trailing = "XL-TS")
// Short SL/TP/TS
xs_ts_percent = input.float(2,step=0.5, title= "TS",group="Exit Short", inline ="STS", tooltip="Trailing Treshold %")
xs_to_percent = input.float(0.5, step=0.5, title= "TO",group="Exit Short", inline ="STS", tooltip="Trailing Offset %")
xs_ts_tick = xs_ts_percent * close/syminfo.mintick/100
xs_to_tick = xs_to_percent * close/syminfo.mintick/100
xs_sl_percent = input.float (2, step=0.5, title="SL",group="Exit Short", inline="ESSLTP", tooltip="Stop Loss %")
xs_tp_percent = input.float(9, step=0.5, title="TP",group="Exit Short", inline="ESSLTP", tooltip="Take Profit %")
xs_sl_price = strategy.position_avg_price * (1+xs_sl_percent/100)
xs_tp_price = strategy.position_avg_price * (1-xs_tp_percent/100)
strategy.exit("XS+SL/TP", "ES", stop=xs_sl_price, limit=xs_tp_price, trail_points=xs_ts_tick, trail_offset=xs_to_tick,comment_loss= "XS-SL", comment_profit = "XS-TP",comment_trailing = "XS-TS")
max_intraday_loss = input.int(10, title="Max Intraday Loss (Percent)", group="Risk Management")
//strategy.risk.max_intraday_loss(max_intraday_loss, strategy.percent_of_equity)
// Monthly Returns table, modified from QuantNomad. Please put calc_on_every_tick = true to plot it.
monthly_table(int results_prec, bool results_dark) =>
new_month = month(time) != month(time[1])
new_year = year(time) != year(time[1])
eq = strategy.equity
bar_pnl = eq / eq[1] - 1
cur_month_pnl = 0.0
cur_year_pnl = 0.0
// Current Monthly P&L
cur_month_pnl := new_month ? 0.0 :
(1 + cur_month_pnl[1]) * (1 + bar_pnl) - 1
// Current Yearly P&L
cur_year_pnl := new_year ? 0.0 :
(1 + cur_year_pnl[1]) * (1 + bar_pnl) - 1
// Arrays to store Yearly and Monthly P&Ls
var month_pnl = array.new_float(0)
var month_time = array.new_int(0)
var year_pnl = array.new_float(0)
var year_time = array.new_int(0)
last_computed = false
if (not na(cur_month_pnl[1]) and (new_month or barstate.islast))
if (last_computed[1])
array.pop(month_pnl)
array.pop(month_time)
array.push(month_pnl , cur_month_pnl[1])
array.push(month_time, time[1])
if (not na(cur_year_pnl[1]) and (new_year or barstate.islast))
if (last_computed[1])
array.pop(year_pnl)
array.pop(year_time)
array.push(year_pnl , cur_year_pnl[1])
array.push(year_time, time[1])
last_computed := barstate.islast ? true : nz(last_computed[1])
// Monthly P&L Table
var monthly_table = table(na)
cell_hr_bg_color = results_dark ? #0F0F0F : #F5F5F5
cell_hr_text_color = results_dark ? #D3D3D3 : #555555
cell_border_color = results_dark ? #000000 : #FFFFFF
// ell_hr_bg_color = results_dark ? #0F0F0F : #F5F5F5
// cell_hr_text_color = results_dark ? #D3D3D3 : #555555
// cell_border_color = results_dark ? #000000 : #FFFFFF
if (barstate.islast)
monthly_table := table.new(position.bottom_right, columns = 14, rows = array.size(year_pnl) + 1, bgcolor=cell_hr_bg_color,border_width=1,border_color=cell_border_color)
table.cell(monthly_table, 0, 0, syminfo.tickerid + " " + timeframe.period, text_color=cell_hr_text_color, bgcolor=cell_hr_bg_color)
table.cell(monthly_table, 1, 0, "Jan", text_color=cell_hr_text_color, bgcolor=cell_hr_bg_color)
table.cell(monthly_table, 2, 0, "Feb", text_color=cell_hr_text_color, bgcolor=cell_hr_bg_color)
table.cell(monthly_table, 3, 0, "Mar", text_color=cell_hr_text_color, bgcolor=cell_hr_bg_color)
table.cell(monthly_table, 4, 0, "Apr", text_color=cell_hr_text_color, bgcolor=cell_hr_bg_color)
table.cell(monthly_table, 5, 0, "May", text_color=cell_hr_text_color, bgcolor=cell_hr_bg_color)
table.cell(monthly_table, 6, 0, "Jun", text_color=cell_hr_text_color, bgcolor=cell_hr_bg_color)
table.cell(monthly_table, 7, 0, "Jul", text_color=cell_hr_text_color, bgcolor=cell_hr_bg_color)
table.cell(monthly_table, 8, 0, "Aug", text_color=cell_hr_text_color, bgcolor=cell_hr_bg_color)
table.cell(monthly_table, 9, 0, "Sep", text_color=cell_hr_text_color, bgcolor=cell_hr_bg_color)
table.cell(monthly_table, 10, 0, "Oct", text_color=cell_hr_text_color, bgcolor=cell_hr_bg_color)
table.cell(monthly_table, 11, 0, "Nov", text_color=cell_hr_text_color, bgcolor=cell_hr_bg_color)
table.cell(monthly_table, 12, 0, "Dec", text_color=cell_hr_text_color, bgcolor=cell_hr_bg_color)
table.cell(monthly_table, 13, 0, "Year", text_color=cell_hr_text_color, bgcolor=cell_hr_bg_color)
for yi = 0 to array.size(year_pnl) - 1
table.cell(monthly_table, 0, yi + 1, str.tostring(year(array.get(year_time, yi))), text_color=cell_hr_text_color, bgcolor=cell_hr_bg_color)
y_color = array.get(year_pnl, yi) > 0 ? color.lime : array.get(year_pnl, yi) < 0 ? color.red : color.gray
table.cell(monthly_table, 13, yi + 1, str.tostring(math.round(array.get(year_pnl, yi) * 100, results_prec)), bgcolor = y_color)
for mi = 0 to array.size(month_time) - 1
m_row = year(array.get(month_time, mi)) - year(array.get(year_time, 0)) + 1
m_col = month(array.get(month_time, mi))
m_color = array.get(month_pnl, mi) > 0 ? color.lime : array.get(month_pnl, mi) < 0 ? color.red : color.gray
table.cell(monthly_table, m_col, m_row, str.tostring(math.round(array.get(month_pnl, mi) * 100, results_prec)), bgcolor = m_color)
results_prec = input(2, title = "Precision", group="Results Table")
results_dark = input.bool(defval=true, title="Dark Mode", group="Results Table")
monthly_table(results_prec, results_dark)