TrendSurfing - Chiến lược xu hướng giao cắt đường trung bình động kép
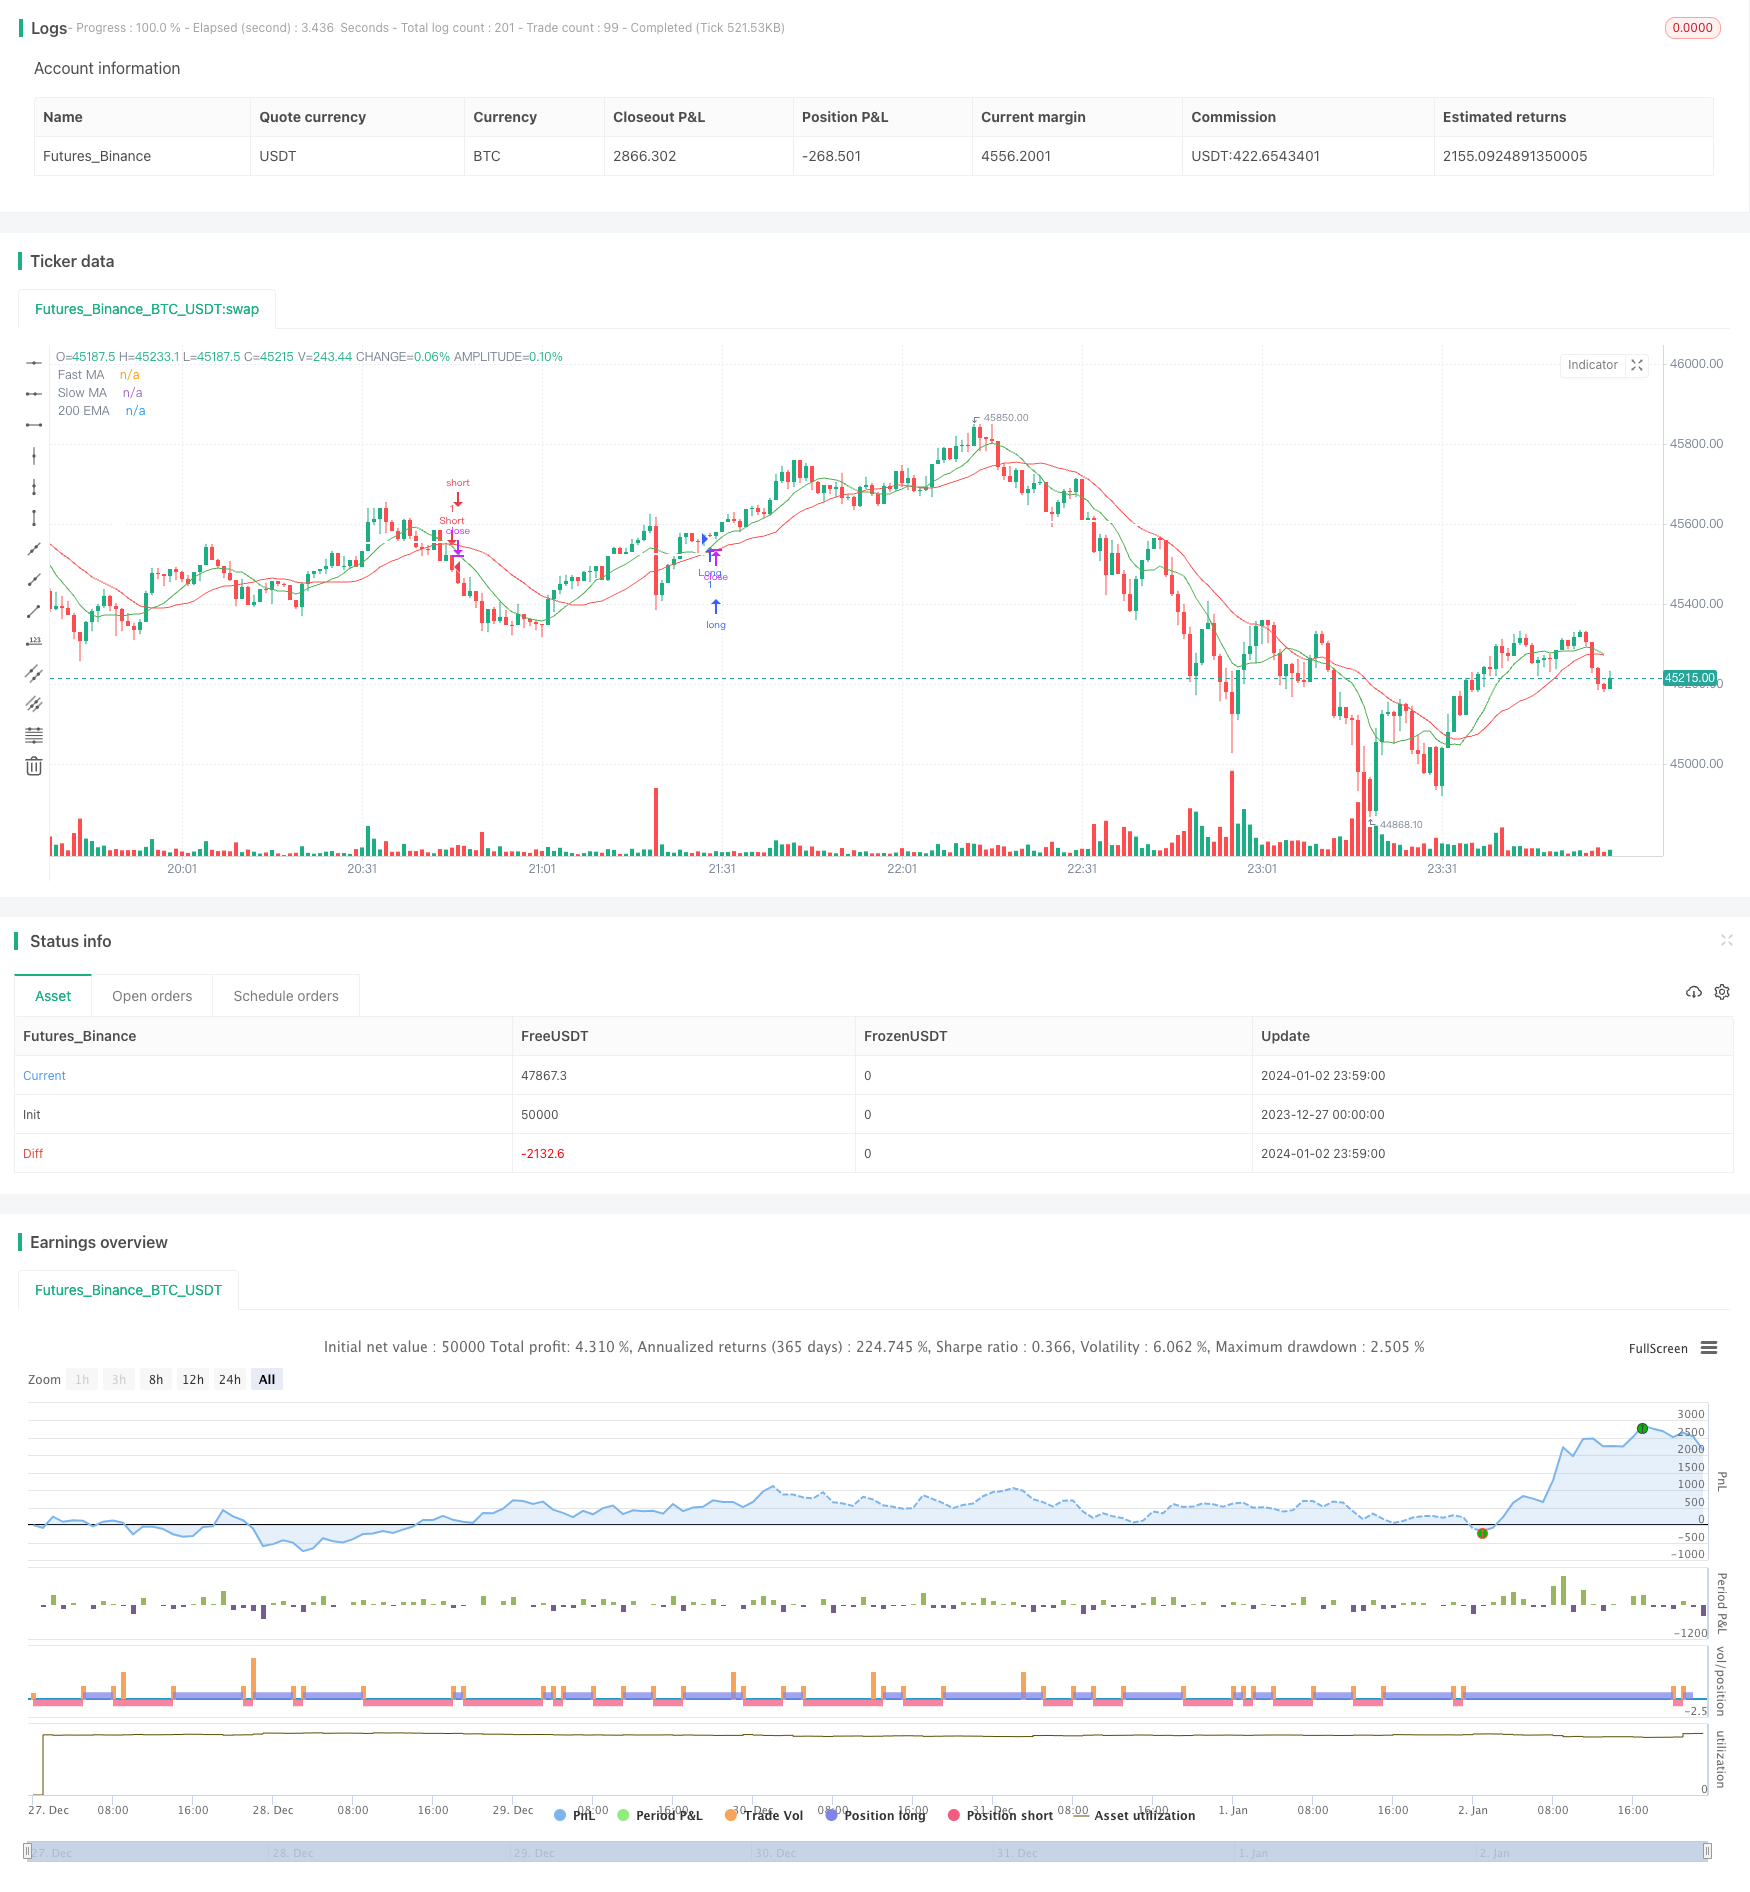
Tổng quan
Chiến lược TrendSurfing là một chiến lược theo dõi xu hướng với dấu hai đường ngang qua là tín hiệu giao dịch chính. Nó kết hợp đồng thời với chỉ số hình tam giác, 200 ngày EMA, chỉ số ROC và chỉ số RSI để lọc tiếng ồn và bắt được hướng xu hướng mới chính xác tại các điểm biến xu hướng. Chiến lược này phù hợp với các vị trí dài trung bình, có thể tăng trưởng ổn định trong thị trường bò.
Nguyên tắc chiến lược
Chiến lược TrendSurfing chủ yếu dựa trên các đường trung bình di chuyển nhanh và đường trung bình di chuyển chậm để tạo ra tín hiệu mua và bán. Một tín hiệu mua được tạo ra khi đi qua đường trung bình di chuyển chậm trên đường trung bình di chuyển nhanh và một tín hiệu bán được tạo ra khi đi qua đường trung bình di chuyển chậm dưới đường trung bình di chuyển nhanh.
Ngoài ra, chiến lược này cũng giới thiệu một số chỉ số phụ để lọc các tín hiệu giả hoặc xác định chất lượng xu hướng.
- Chỉ số ROC đánh giá xu hướng và tốc độ thay đổi giá
- Chỉ số RSI đánh giá mức độ quá mua quá bán
- 200 ngày EMA đánh giá xu hướng tổng thể
- Chỉ số thị giác hình tam giác đánh dấu điểm vào trên biểu đồ
Bằng cách đánh giá tổng hợp nhiều chỉ số, chiến lược TrendSurfing có thể xác định chính xác vị trí tại điểm biến hướng, theo dõi xu hướng rõ ràng trong đường dài và tránh bị lừa bởi tiếng ồn thị trường hoặc điều chỉnh đường ngắn.
Phân tích lợi thế
1. Ghi lại xu hướng rõ ràng
Chiến lược này sử dụng các điểm chuyển hướng cơ bản để đánh giá xu hướng thông qua đường trung bình, kết hợp với các chỉ số như EMA 200 ngày để lọc tiếng ồn đường ngắn và tập trung vào xu hướng đường dài.
2. Sự kết hợp của nhiều chỉ số xác nhận thời gian nhập học chất lượng cao
Ngoài đường trung bình, chiến lược này cũng giới thiệu các chỉ số như ROC, RSI, tránh các vùng chấn động ở các điểm biến động xu hướng để đảm bảo chất lượng nhập cảnh.
3. Chỉ số thị giác hình tam giác dễ đọc
Hình tam giác màu xanh lá cây cho thấy thời gian mua và hình tam giác màu đỏ cho thấy thời gian bán.
4. Các tham số có thể tùy chỉnh để đáp ứng các nhu cầu khác nhau
Người dùng có thể tự do điều chỉnh các tham số đường trung bình, độ dài ROC, độ dài RSI, v.v. để phù hợp với phong cách giao dịch của mình.
5. Cân nhắc quản lý dừng lỗ Chiến lược này sử dụng ATR nhân tỷ lệ rủi ro làm điểm dừng lỗ và điểm dừng để kiểm soát rủi ro của một giao dịch.
Phân tích rủi ro
1. Rủi ro bị bỏ phiếu
Bất kỳ chiến lược nào dựa trên giao nhau đều có nguy cơ bị lỗ hoặc dừng lỗ khi giao nhau.
Thiết lập tham số không đúng có thể dẫn đến tối ưu hóa quá mức
Người dùng nên tránh theo đuổi các tham số tiêu chuẩn, thay vì thiết lập các giá trị chỉ số quá lý tưởng. Các tham số nên được thử nghiệm theo các hoạt động và giống thị trường khác nhau.
3. Không có khả năng lọc toàn diện các sự kiện rủi ro hệ thống trên thị trường Trong trường hợp cực đoan, như vụ thiên thạch đen, vẫn có thể phải đối mặt với tổn thất lớn.
Hướng tối ưu hóa
Thiết lập các tham số thử nghiệm và tối ưu hóa
Giai đoạn đường trung bình, độ dài ROC, các tham số RSI phải được kiểm tra và tối ưu hóa để phù hợp hơn với các đặc điểm của các loại giao dịch khác nhau.
2. Kiểm tra và đưa ra các chỉ số hỗ trợ khác
Có thể tiếp tục kiểm tra hiệu quả kết hợp của các chỉ số khác như BOLL, KDJ và các điểm chéo đường trung bình.
3. Tối ưu hóa lệnh dừng lỗ kết hợp với giao dịch thuật toán
Tiếp theo, chúng tôi sẽ giới thiệu các thuật toán học máy để làm cho các trạm dừng lỗ trở nên thông minh hơn và thích ứng với môi trường thị trường thay đổi năng động.
4. Khám phá sự kết hợp với các chiến lược hoặc mô hình khác
Kết hợp với các chiến lược lựa chọn cổ phiếu cơ bản, chiến lược tháo gỡ thống kê, mô hình tối ưu hóa danh mục đầu tư, bạn có thể kiểm soát rủi ro hơn nữa để tăng lợi nhuận.
Tóm tắt
Chiến lược TrendSurfing là một chiến lược theo dõi xu hướng đơn giản, trực tiếp, có thể kiểm soát rủi ro. Nó xoay quanh tín hiệu giao dịch hình thành từ giao lộ hai đường cong và được lọc bằng nhiều chỉ số phụ. Chiến lược này phù hợp với các vị trí đường dài và dài, có thể theo dõi xu hướng thị trường bò. Chúng tôi sẽ tiếp tục tối ưu hóa chiến lược này bằng các phương tiện như kiểm tra tham số, mở rộng chỉ số và kiểm soát rủi ro để nó có thể hoạt động ổn định hơn trong thị trường rộng lớn hơn.
||
Overview
The TrendSurfing strategy is a trend tracking strategy based primarily on double moving average crossover signals. It also incorporates triangle visual indicators, 200-day EMA, ROC indicator and RSI indicator to filter out noise and accurately capture trend reversals. This strategy is suitable for medium-to-long-term holding and can achieve steady growth in a bull market.
Strategy Logic
The TrendSurfing strategy mainly relies on golden cross and death cross formed by fast moving average and slow moving average to generate buy and sell signals. When the fast MA crosses above the slow MA, a buy signal is generated. When the fast MA crosses below the slow MA, a sell signal is generated.
In addition, the strategy incorporates several auxiliary indicators to filter out false signals or determine trend quality, including:
- ROC indicator to determine price trend and momentum
- RSI oscillator to detect overbought/oversold levels
- 200-day EMA to determine overall trend direction
- Triangle visual indicators to mark entry points on chart
By comprehensively judging various indicators, the TrendSurfing strategy can accurately locate trend turning points and track definite medium-to-long term trends without being misguided by market noise or short-term corrections.
Advantage Analysis
1. Catch Medium-to-Long Term Trend
The strategy basically judges trend reversal based on MA crosses, and uses indicators like 200-day EMA to filter out short-term noise, with focus on medium-to-long term trend capture.
2. Multiple Indicators Ensure High Quality Entry
On top of MA crossover itself, the incorporation of ROC, RSI and other indicators enables avoidance of consolidation zones on reversal points and ensures quality entry.
3. Intuitive Triangle Visual Indicators
Green downward triangles indicate long entries, red upward triangles indicate short entries. Clean and straightforward.
4. Customizable Parameters for Different Needs
Users can freely adjust parameters like MA periods, ROC length, RSI length etc according to their own trading style.
5. Stop Loss and Take Profit Control
The strategy sets stop loss and take profit based on ATR value multiplied by risk percentage, enabling per trade risk control.
Risk Analysis
1. Risk of Missing Trades
Any MA crossover based strategy has inherent risk of missing trades or being stopped out when MA is oscillating.
2. Over-optimization from Improper Parameter Settings Users should avoid chasing hypothetically ideal parameter values. Parameters should be tested and adapted based on different market conditions and products.
3. Inability to Fully Filter Black Swan Events
Under extreme market conditions, strategies could still face large losses from market systemic risks.
Optimization Directions
1. Test and Optimize Parameter Values
Periods of MAs, length of ROC, values of RSI etc should go through rigorous backtesting and optimization to fit characteristics of different trading products.
2. Test and Incorporate Other Auxiliary Indicators
Continue testing combinations of other indicators like BOLL, KDJ etc with MA crosses for better performance.
3. Coordinate with Algorithmic Trading for Better Risk Control Introduce machine learning algorithms to enable more intelligent stop loss and take profit, adapting to dynamic market environments.
4. Explore Combinations with Other Strategies or Models
Combining with fundamentals-based stock picking strategies, statistical arbitrage strategies, portfolio optimization models etc could further enhance risk control and return.
Conclusion
The TrendSurfing strategy is a simple, straightforward trend tracking strategy with controllable risk. Trading signals are generated from MA crosses and filtered by multiple auxiliary indicators. It is suitable for medium-to-long term holding to steadily track bull market trends. We will continue optimizing this strategy through parameter testing, indicator expansion, risk control etc to achieve more reliable performance across diverse markets.
[/trans]
/*backtest
start: 2023-12-27 00:00:00
end: 2024-01-03 00:00:00
period: 1m
basePeriod: 1m
exchanges: [{"eid":"Futures_Binance","currency":"BTC_USDT"}]
*/

//@version=4
strategy("Moving Average Crossover with Triangles, 200 EMA, ROC, and RSI", overlay=true)

// Define input parameters
fast_length = input(9, title="Fast MA Length")
slow_length = input(21, title="Slow MA Length")
roc_length = input(14, title="ROC Length")
rsi_length = input(14, title="RSI Length")

// Calculate moving averages
fast_ma = sma(close, fast_length)
slow_ma = sma(close, slow_length)

// Plot moving averages
plot(fast_ma, color=color.green, title="Fast MA")
plot(slow_ma, color=color.red, title="Slow MA")

// Plot 200 EMA
ema_200 = ema(close, 200)
plot(ema_200, color=color.white, title="200 EMA", linewidth=2)

// Calculate Rate of Change (ROC)
roc = roc(close, roc_length)

// Calculate RSI
rsi = rsi(close, rsi_length)

// Define strategy entry and exit conditions
long_condition = crossover(fast_ma, slow_ma) and roc > 0 and close > ema_200 and rsi > 55
short_condition = crossunder(fast_ma, slow_ma) and roc < 0 and close < ema_200 and rsi < 45

// Execute strategy
strategy.entry("Long", strategy.long, when=long_condition)
strategy.entry("Short", strategy.short, when=short_condition)

// Define stop loss and take profit levels
risk_percent = input(1, title="Risk Percentage", minval=0.1, maxval=5, step=0.1) / 100
atr_value = atr(14)
stop_loss = close - atr_value * risk_percent
take_profit = close + atr_value * risk_percent

strategy.exit("Take Profit/Stop Loss", from_entry="Long", loss=stop_loss, profit=take_profit)
strategy.exit("Take Profit/Stop Loss", from_entry="Short", loss=stop_loss, profit=take_profit)

// Plot larger triangles on crossover and crossunder
plotshape(series=long_condition, title="Long Entry", color=color.green, style=shape.triangleup, location=location.belowbar, size=size.small)
plotshape(series=short_condition, title="Short Entry", color=color.red, style=shape.triangledown, location=location.abovebar, size=size.small)