Kết hợp các chiến lược giao dịch định lượng theo xu hướng và biến động
Tổng quan
Chiến lược biến động xu hướng kép là một chiến lược giao dịch định lượng kết hợp xu hướng và biến động. Nó sử dụng sự kết hợp của hai chỉ số để xác định hướng và cường độ của xu hướng và tìm kiếm thời gian đầu vào tốt nhất khi xu hướng biến động.
Nguyên tắc chiến lược
Chiến lược này chủ yếu sử dụng hai chỉ số công khai: Trend Surfers và Mawreez’s Trend Oscillator.
Trend Surfers là một chỉ số theo dõi xu hướng dừng. Bằng cách tính toán giá cao nhất và giá thấp nhất trong một chu kỳ nhất định, nó đánh giá xu hướng giá và đưa ra vị trí dừng khuyến nghị. Ví dụ, khi giá vượt qua mức giá cao nhất của đường 168 K gần đây nhất, đó là tín hiệu bullish; khi giá giảm xuống mức giá thấp nhất của đường 168 K gần đây nhất, đó là tín hiệu bullish.
Mawreez’s Trend Oscillator là một chỉ số dao động hai đường. Nó tương tự như MACD, bằng cách đánh giá chiều hướng và cường độ của xu hướng thông qua sự khác biệt của DI. Đường cong chỉ số là lạc quan trên trục 0 và đi xuống dưới.
Quy tắc giao dịch của chiến lược này là:
Tham gia nhiều đầu: Trend Surfers vượt qua đường cao nhất và chỉ số Mawreez’s Trend Oscillator mua khi giá là giá đắt Đầu không vào: Trend Surfers bán khi giảm xuống và chỉ số Mawreez’s Trend Oscillator giảm xuống
Phương pháp dừng lỗ là theo dõi xu hướng dừng lỗ và dừng cố định.
Phân tích lợi thế
Chiến lược này kết hợp các chỉ số xu hướng và chấn động, có thể nắm bắt xu hướng và tìm kiếm giá tốt hơn trong chấn động, với các ưu điểm sau:
- Bộ lọc chỉ số kép có thể ngăn chặn đột phá giả hiệu quả
- Kết hợp xu hướng và biến động, dễ dàng nắm bắt giá trong khu vực biến động với bố cục hút thấp hoặc đặt nhẹ ở mức cao
- Có thể kiểm soát rủi ro tốt bằng cách sử dụng nhiều phương pháp dừng lỗ
Phân tích rủi ro
Chiến lược này cũng có một số rủi ro:
- Gói chỉ số kép, dễ bị bỏ lỡ
- Chỉ số xu hướng và chỉ số chấn động có thể phát ra tín hiệu xung đột
- Lệnh dừng cố định có thể dừng quá sớm
Những rủi ro này có thể được tránh bằng các biện pháp sau:
- Thả lỏng các tham số chỉ số để giảm tỷ lệ nhiễu
- Tăng quy tắc đánh giá xu hướng, tránh xung đột chỉ số
- Động thái điều chỉnh vị trí dừng lỗ
Hướng tối ưu hóa
Chiến lược này có thể được tối ưu hóa hơn nữa:
- Kiểm tra các tham số khác nhau và tham số chu kỳ để tìm tham số tốt nhất
- Các quy tắc phán đoán phụ trợ như tăng biến động, khối lượng giao dịch
- Các chỉ số và tham số tối ưu hóa động học bằng công nghệ học máy
Tóm tắt
Lợi thế của chiến lược chấn động hai xu hướng là sử dụng tổng hợp theo dõi xu hướng và chỉ số chấn động, có thể xác định hướng xu hướng và nắm bắt cơ hội chấn động, có thể nâng cao lợi nhuận của chiến lược thông qua các tham số và các quy tắc tối ưu hóa. Chiến lược này có triển vọng phát triển tốt.
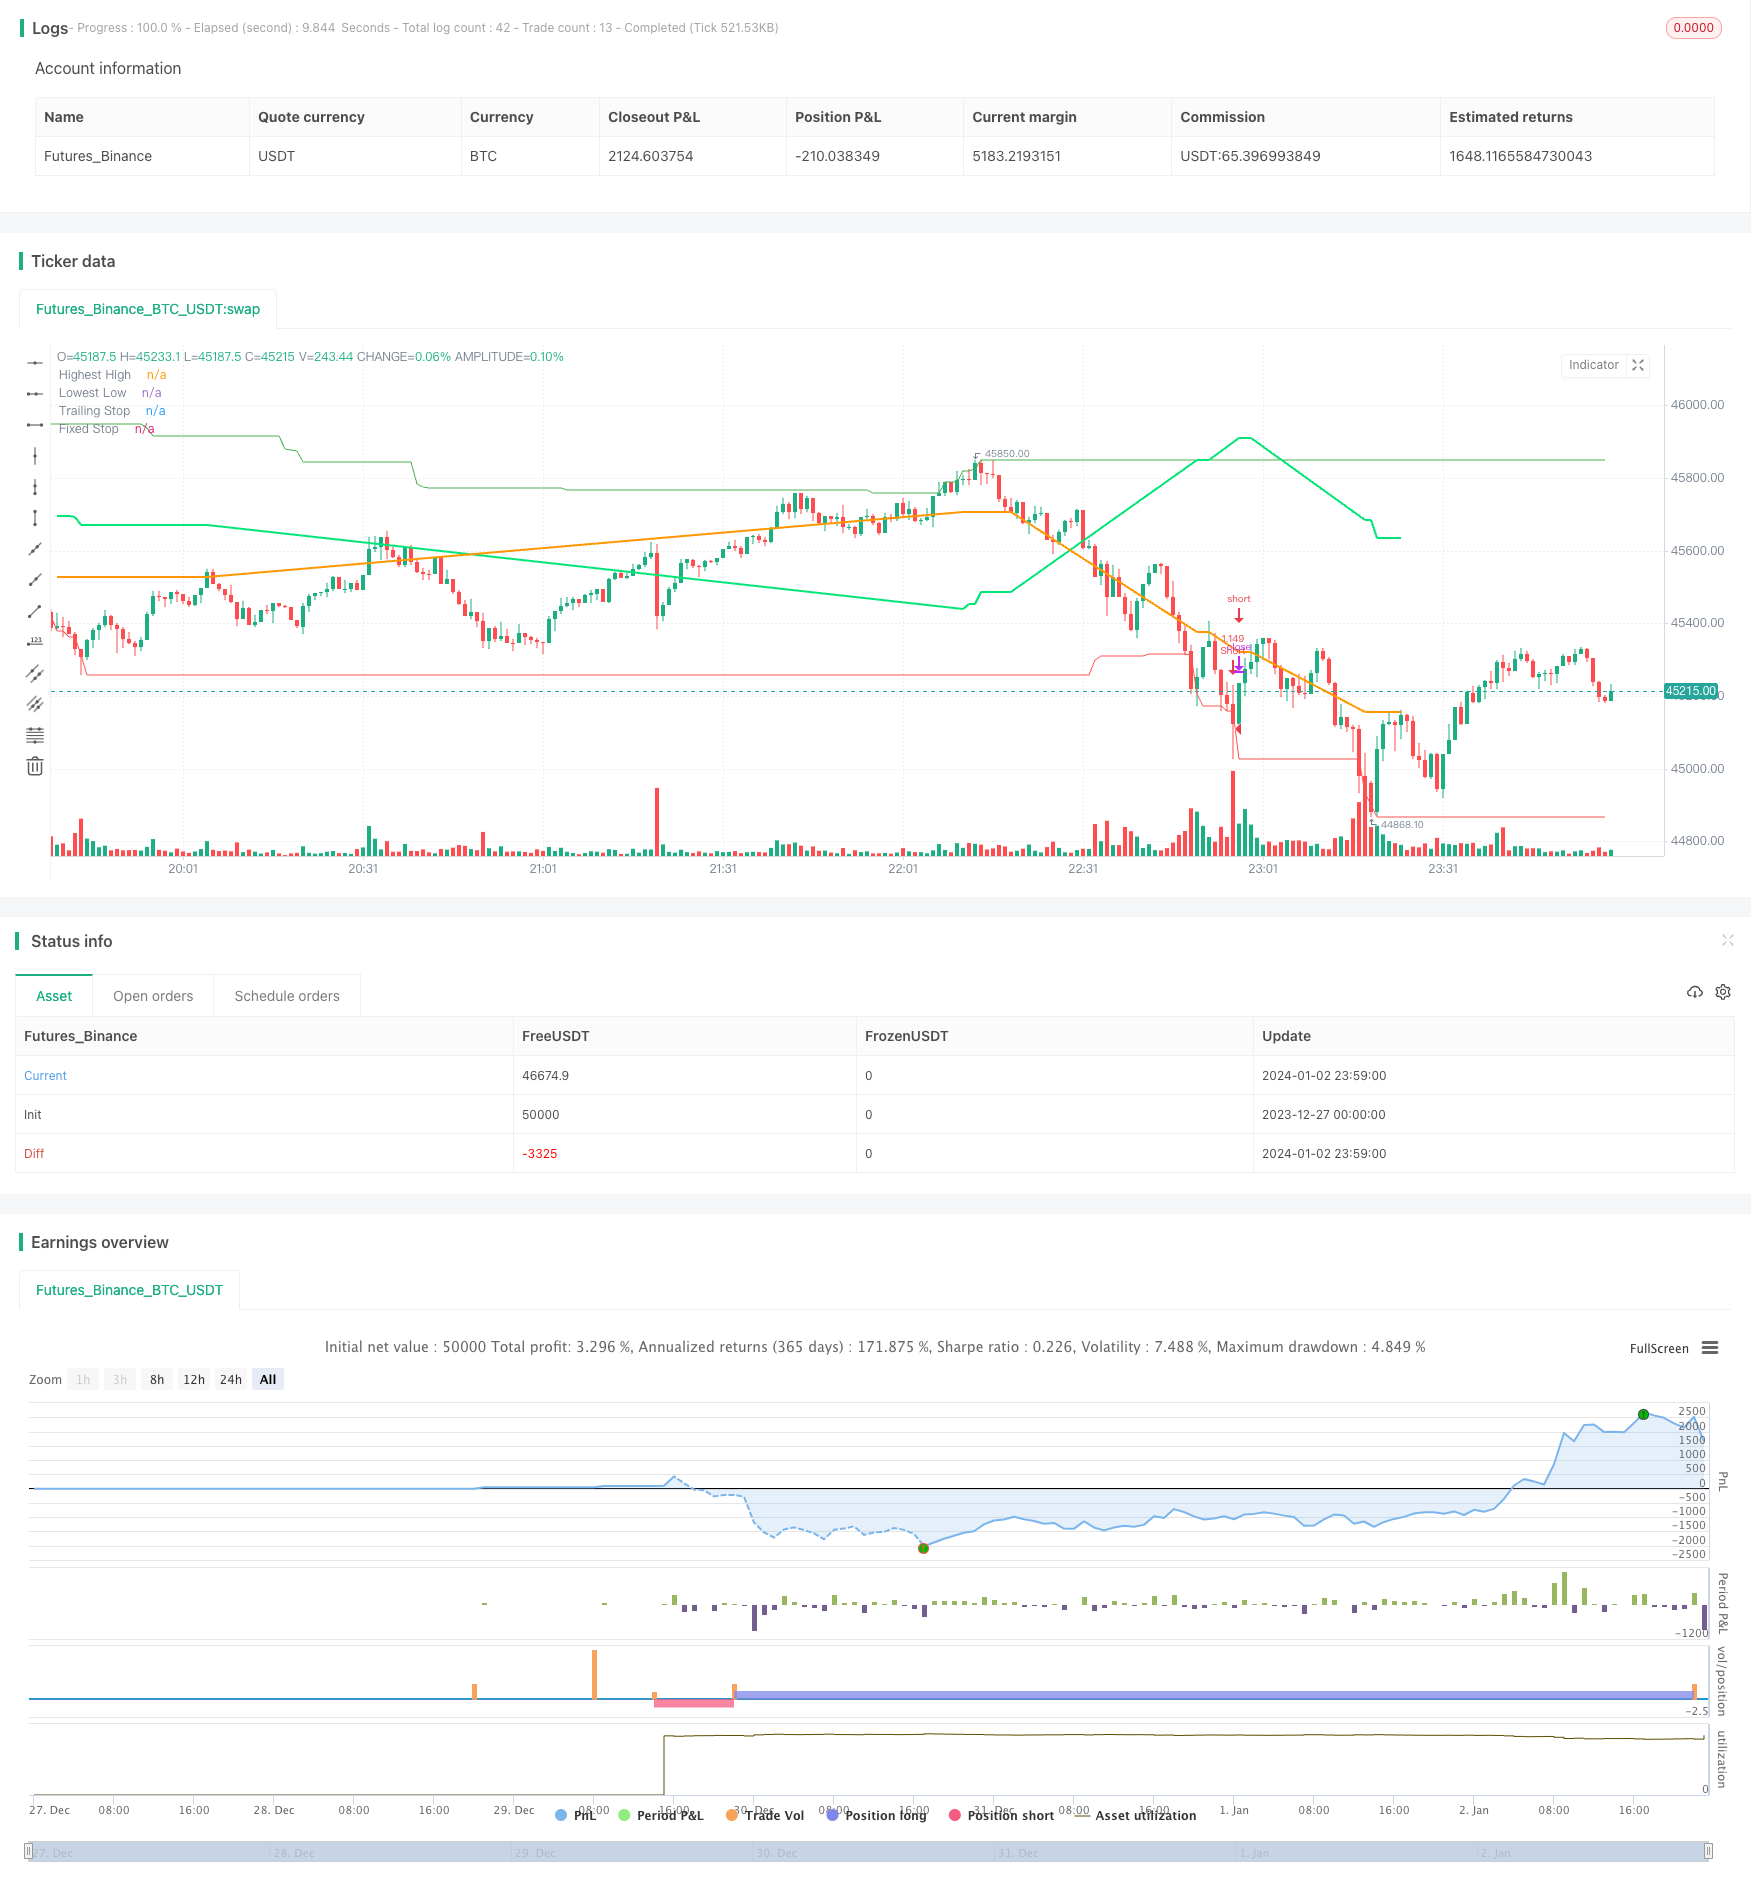
/*backtest
start: 2023-12-27 00:00:00
end: 2024-01-03 00:00:00
period: 1m
basePeriod: 1m
exchanges: [{"eid":"Futures_Binance","currency":"BTC_USDT"}]
*/

// This source code is subject to the terms of the Mozilla Public License 2.0 at https://mozilla.org/MPL/2.0/
// © myn

//@version=5
strategy('Strategy Myth-Busting #8 - TrendSurfers+TrendOsc - [MYN]', max_bars_back=5000, overlay=true, pyramiding=0, initial_capital=20000, currency='USD', default_qty_type=strategy.percent_of_equity, default_qty_value=100.0, commission_value=0.075, use_bar_magnifier = false)

/////////////////////////////////////
//* Put your strategy logic below *//
/////////////////////////////////////
//cAe9It4ynO4


// Strategies
// Trend Surfers - Premium Indicator
// Mawreez' Trend Oscillator Indicator

// Trading Setup / Rules


// Long Condition
// Trend Surfers Trailing stop line goes below (Crosses) lowest low
// Bullish Candle (red)
// Mawreeze Trend Oscilator Indicator is green


// Short Condition

// Trend Surfers Trailing stop line goes above (Crosses) highest high
// Bearish Candle (red)
// Mawreeze Trend Oscilator Indicator is red

// Stop loss middle between high and low Risk 1:2


//@version=5
//strategy(shorttitle='Trend Surfers - Breakout', title='Trend Surfers - Premium Breakout', overlay=true, calc_on_every_tick=false, initial_capital=100000, default_qty_type=strategy.percent_of_equity, default_qty_value=100, commission_type='percent', commission_value=0.04)

// Risk for position and pyramid
maxriskval = input.float(2, 'Max % risk', tooltip='Risk % over total equity / Position', group='Risk Management')
pairnumber = input.int(title='How many pairs', defval=1, tooltip='How many pairs are you trading with the strategy?', group='Risk Management')

// Emtry Exit
highPeriod = input.int(title='Highest High Period', defval=168, tooltip='Highest High of X bars - This will trigger a Long Entry when close is above. (Thin Green Line)', group='Entry Condition')
lowPeriod = input.int(title='Lowest Low Period', defval=168, tooltip='Lowest low of X bars - This will trigger a Short Entry when close is under. (Thin Red Line)', group='Entry Condition')
// Stoploss
trailingAtrPeriod = input.int(title='Trailing ATR Pediod', defval=10, tooltip='Average True Range for the Trailing Stop. (Thick Green Line) ', group='Exit Condition')
trailingAtrMultiplier = input.float(title='Trailing ATR Multiplier', defval=8, group='Exit Condition')
fixAtrPeriod = input.int(title='Fix ATR Pediod', defval=10, tooltip='Average True Range for the Fix Stoloss. (Thick Yellow Line)', group='Exit Condition')
fixAtrMultiplier = input.float(title='Fix ATR Multiplier', defval=2, group='Exit Condition')
// Pair info
pair = syminfo.basecurrency + syminfo.currency

// High Low Variable
highestHigh = ta.highest(high, highPeriod)[1]
lowestLow = ta.lowest(low, lowPeriod)[1]
trailingAtr = ta.atr(trailingAtrPeriod) * trailingAtrMultiplier

// Trade Condition
longConditionTrendSurfers = ta.crossover(close, highestHigh)
shortConditionTrendSurfers = ta.crossunder(close, lowestLow)

// Risk Variable
fixAtr = ta.atr(fixAtrPeriod) * fixAtrMultiplier
stopvaluelong = close[1] - fixAtr[1]
stopvalueshort = close[1] + fixAtr[1]

// Position size Long
maxpossize = strategy.equity / close
positionsizelong = maxriskval / 100 * strategy.equity / (close - stopvaluelong)
stopperclong = (close - stopvaluelong) / close * 100
leveragelong = math.max(1, math.ceil(positionsizelong / maxpossize)) * 2
posperclong = positionsizelong * close / strategy.equity * 100 / leveragelong / pairnumber
realposlong = posperclong / 100 * strategy.equity * leveragelong / close

// Position size Short
positionsizeshort = maxriskval / 100 * strategy.equity / (stopvalueshort - close)
stoppercshort = (close - stopvalueshort) / close * 100
leverageshort = math.max(1, math.ceil(positionsizeshort / maxpossize)) * 2
pospercshort = positionsizeshort * close / strategy.equity * 100 / leverageshort / pairnumber
realposshort = pospercshort / 100 * strategy.equity * leverageshort / close

// Alert Message
entry_long_message = '\nGo Long for ' + pair + 'NOW!' + '\nPosition Size % =' + str.tostring(posperclong) + '\nLeverage' + str.tostring(leveragelong) + '\nStoploss Price =' + str.tostring(stopvaluelong) + '\nClose any Short position that are open for ' + pair + '!' + '\n\nVisit TrendSurfersSignals.com' + '\nFor automated premium signals (FREE)'

entry_short_message = '\nGo Short for ' + pair + 'NOW!' + '\nPosition Size % =' + str.tostring(pospercshort) + '\nLeverage' + str.tostring(leverageshort) + '\nStoploss Price =' + str.tostring(stopvalueshort) + '\nClose any Long position that are open for ' + pair + '!' + '\n\nVisit TrendSurfersSignals.com' + '\nFor automated premium signals (FREE)'

exit_short_message = '\nExit Short for ' + pair + 'NOW!' + '\n\nVisit TrendSurfersSignals.com' + '\nFor automated premium signals (FREE)'

exit_long_message = '\nExit Long for ' + pair + 'NOW!' + '\n\nVisit TrendSurfersSignals.com' + '\nFor automated premium signals (FREE)'
// Order
// if longCondition
//     strategy.entry('Long', strategy.long, stop=highestHigh, comment='Long', qty=realposlong, alert_message=entry_long_message)
// if shortCondition
//     strategy.entry('Short', strategy.short, stop=lowestLow, comment='Short', qty=realposshort, alert_message=entry_short_message)

// Stoploss Trailing
longTrailing = close - trailingAtr
shortTrailing = close + trailingAtr

var longTrailingStop = 0.0
var shortTrailingStop = 999999.9

trailingStopLine = 0.0
trailingStopLine := na
fixedStopLine = 0.0
fixedStopLine := na
var inTrade = 0
if longConditionTrendSurfers or shortConditionTrendSurfers
    if 0 == inTrade
        if longConditionTrendSurfers
            inTrade := 1
            inTrade
        else
            inTrade := -1
            inTrade
if 1 == inTrade and (shortConditionTrendSurfers or low <= math.max(fixedStopLine[1], longTrailingStop))
    inTrade := 0
    inTrade
if -1 == inTrade and (longConditionTrendSurfers or high >= math.min(fixedStopLine[1], shortTrailingStop))
    inTrade := 0
    inTrade

longTrailingStop := if 1 == inTrade
    stopValue = longTrailing
    math.max(stopValue, longTrailingStop[1])
else
    0

shortTrailingStop := if -1 == inTrade
    stopValue = shortTrailing
    math.min(stopValue, shortTrailingStop[1])
else
    999999

// Fix Stoploss
firstPrice = 0.0
firstFixAtr = 0.0
firstPrice := na
firstFixAtr := na
if 0 != inTrade
    firstPrice := ta.valuewhen(inTrade != inTrade[1] and 0 != inTrade, close, 0)
    firstFixAtr := ta.valuewhen(inTrade != inTrade[1] and 0 != inTrade, fixAtr, 0)
    if 1 == inTrade
        fixedStopLine := firstPrice - firstFixAtr
        trailingStopLine := longTrailingStop
        trailingStopLine
    else
        fixedStopLine := firstPrice + firstFixAtr
        trailingStopLine := shortTrailingStop
        trailingStopLine

// if strategy.position_size > 0
//     strategy.exit(id='L Stop', stop=math.max(fixedStopLine, longTrailingStop), alert_message=exit_long_message)

// if strategy.position_size < 0
//     strategy.exit(id='S Stop', stop=math.min(fixedStopLine, shortTrailingStop), alert_message=exit_short_message)


// Plot
plot(highestHigh, color=color.new(color.green, 0), linewidth=1, title='Highest High')
plot(lowestLow, color=color.new(color.red, 0), linewidth=1, title='Lowest Low')
plot(trailingStopLine, color=color.new(color.lime, 0), linewidth=2, offset=1, title='Trailing Stop')
plot(fixedStopLine, color=color.new(color.orange, 0), linewidth=2, offset=1, title='Fixed Stop')

// Trend Surfers Trailing stop line goes above (Crossesover) highest high
// Bearish Candle (red)
// Mawreeze Trend Oscilator Indicator is red

trendSurfersShortEntry = trailingStopLine > highestHigh and close < close[1]
trendSurfersLongEntry = trailingStopLine < lowestLow and close > close[1]


//@version=5

// Taken from the TradingView house rules regarding scripts:

// "All open source scripts that do not mention a specific open source license
// in their comments are licensed under the Mozilla Public License 2.0.
// Following the Mozilla License, any script reusing open source code originally
// published by someone else must also be open source, unless specific
// permission is granted by the original author."

//indicator('Mawreez\' Trend Oscillator', precision=3)

len = input.int(title='DI Length', minval=1, defval=14)
sens = input.float(title='Sensitivity', defval=25)

// Lag-free smoothing of a given series
smooth(series, len) =>
    f28 = ta.ema(series, len)
    f30 = ta.ema(f28, len)
    vC = f28 * 1.5 - f30 * 0.5
    f38 = ta.ema(vC, len)
    f40 = ta.ema(f38, len)
    v10 = f38 * 1.5 - f40 * 0.5
    f48 = ta.ema(v10, len)
    f50 = ta.ema(f48, len)
    f48 * 1.5 - f50 * 0.5

// Constructing the +DI and -DI
up = ta.change(high)
down = -ta.change(low)
plus_dm = up > 0 and up > down ? up : 0
minus_dm = down > 0 and down > up ? down : 0
range_1 = ta.rma(ta.tr, len)
plus_di = smooth(ta.rma(plus_dm, len) / range_1, 3)
minus_di = smooth(ta.rma(minus_dm, len) / range_1, 3)

// Constructing and plotting the modified ADX
adj_adx = 100 * math.abs(plus_di - minus_di) / (plus_di + minus_di) - sens
adj_adx := (minus_di > plus_di ? -1 : 1) * (adj_adx < 0 ? 0 : adj_adx)
//plot(smooth(adj_adx, 3), color=plus_di > minus_di ? color.green : color.red, style=plot.style_columns)

trendOscShortEntry = plus_di < minus_di
trendOscLongEntry = plus_di > minus_di


//////////////////////////////////////
//* Put your strategy rules below *//
/////////////////////////////////////

longCondition = trendSurfersLongEntry and trendOscLongEntry
shortCondition = trendSurfersShortEntry and trendOscShortEntry

//define as 0 if do not want to use
closeLongCondition = 0
closeShortCondition = 0


// ADX
//░░░░░░░░░░░░░░░░░░░░░░░░░░░░░░░░░░░░░░░░░░░░░░░░░░░░░░░░░░░░░░░░░░░░░░░░░░░░░░░░░░░░░░░░░░░░░░░░░░░░░░░░░░░░░░░░░░░░░░░░░░░░░░░░░░░░░░░░░░░░░░░░░░

adxEnabled = input.bool(defval = false , title = "Average Directional Index (ADX)", tooltip = "", group ="ADX" )
adxlen = input(14, title="ADX Smoothing", group="ADX")
adxdilen = input(14, title="DI Length", group="ADX")
adxabove = input(25, title="ADX Threshold", group="ADX")

adxdirmov(len) =>
	adxup = ta.change(high)
	adxdown = -ta.change(low)
	adxplusDM = na(adxup) ? na : (adxup > adxdown and adxup > 0 ? adxup : 0)
	adxminusDM = na(adxdown) ? na : (adxdown > adxup and adxdown > 0 ? adxdown : 0)
	adxtruerange = ta.rma(ta.tr, len)
	adxplus = fixnan(100 * ta.rma(adxplusDM, len) / adxtruerange)
	adxminus = fixnan(100 * ta.rma(adxminusDM, len) / adxtruerange)
	[adxplus, adxminus]
adx(adxdilen, adxlen) =>
	[adxplus, adxminus] = adxdirmov(adxdilen)
	adxsum = adxplus + adxminus
	adx = 100 * ta.rma(math.abs(adxplus - adxminus) / (adxsum == 0 ? 1 : adxsum), adxlen)

adxsig = adxEnabled ? adx(adxdilen, adxlen) : na
isADXEnabledAndAboveThreshold = adxEnabled ? (adxsig > adxabove) : true

//Backtesting Time Period (Input.time not working as expected as of 03/30/2021.  Giving odd start/end dates
//░░░░░░░░░░░░░░░░░░░░░░░░░░░░░░░░░░░░░░░░░░░░░░░░░░░░░░░░░░░░░░░░░░░░░░░░░░░░░░░░░░░░░░░░░░░░░░░░░░░░░░░░░░░░░░░░░░░░░░░░░░░░░░░░░░░░░░░░░░░░░░░░░░
useStartPeriodTime = input.bool(true, 'Start', group='Date Range', inline='Start Period')
startPeriodTime = input(timestamp('1 Jan 2019'), '', group='Date Range', inline='Start Period')
useEndPeriodTime = input.bool(true, 'End', group='Date Range', inline='End Period')
endPeriodTime = input(timestamp('31 Dec 2030'), '', group='Date Range', inline='End Period')

start = useStartPeriodTime ? startPeriodTime >= time : false
end = useEndPeriodTime ? endPeriodTime <= time : false
calcPeriod = true

// Trade Direction
// ░░░░░░░░░░░░░░░░░░░░░░░░░░░░░░░░░░░░░░░░░░░░░░░░░░░░░░░░░░░░░░░░░░░░░░░░░░░░░░░░░░░░░░░░░░░░░░░░░░░░░░░░░░░░░░░░░░░░░░░░░░░░░░░░░░░░░░░░░░░░░░░░░░
tradeDirection = input.string('Long and Short', title='Trade Direction', options=['Long and Short', 'Long Only', 'Short Only'], group='Trade Direction')

// Percent as Points
// ░░░░░░░░░░░░░░░░░░░░░░░░░░░░░░░░░░░░░░░░░░░░░░░░░░░░░░░░░░░░░░░░░░░░░░░░░░░░░░░░░░░░░░░░░░░░░░░░░░░░░░░░░░░░░░░░░░░░░░░░░░░░░░░░░░░░░░░░░░░░░░░░░░
per(pcnt) =>
    strategy.position_size != 0 ? math.round(pcnt / 100 * strategy.position_avg_price / syminfo.mintick) : float(na)

// Take profit 1
// ░░░░░░░░░░░░░░░░░░░░░░░░░░░░░░░░░░░░░░░░░░░░░░░░░░░░░░░░░░░░░░░░░░░░░░░░░░░░░░░░░░░░░░░░░░░░░░░░░░░░░░░░░░░░░░░░░░░░░░░░░░░░░░░░░░░░░░░░░░░░░░░░░░
tp1 = input.float(title='Take Profit 1 - Target %', defval=100, minval=0.0, step=0.5, group='Take Profit', inline='Take Profit 1')
q1 = input.int(title='% Of Position', defval=100, minval=0, group='Take Profit', inline='Take Profit 1')

// Take profit 2
// ░░░░░░░░░░░░░░░░░░░░░░░░░░░░░░░░░░░░░░░░░░░░░░░░░░░░░░░░░░░░░░░░░░░░░░░░░░░░░░░░░░░░░░░░░░░░░░░░░░░░░░░░░░░░░░░░░░░░░░░░░░░░░░░░░░░░░░░░░░░░░░░░░░
tp2 = input.float(title='Take Profit 2 - Target %', defval=100, minval=0.0, step=0.5, group='Take Profit', inline='Take Profit 2')
q2 = input.int(title='% Of Position', defval=100, minval=0, group='Take Profit', inline='Take Profit 2')

// Take profit 3
// ░░░░░░░░░░░░░░░░░░░░░░░░░░░░░░░░░░░░░░░░░░░░░░░░░░░░░░░░░░░░░░░░░░░░░░░░░░░░░░░░░░░░░░░░░░░░░░░░░░░░░░░░░░░░░░░░░░░░░░░░░░░░░░░░░░░░░░░░░░░░░░░░░░
tp3 = input.float(title='Take Profit 3 - Target %', defval=100, minval=0.0, step=0.5, group='Take Profit', inline='Take Profit 3')
q3 = input.int(title='% Of Position', defval=100, minval=0, group='Take Profit', inline='Take Profit 3')

// Take profit 4
// ░░░░░░░░░░░░░░░░░░░░░░░░░░░░░░░░░░░░░░░░░░░░░░░░░░░░░░░░░░░░░░░░░░░░░░░░░░░░░░░░░░░░░░░░░░░░░░░░░░░░░░░░░░░░░░░░░░░░░░░░░░░░░░░░░░░░░░░░░░░░░░░░░░
tp4 = input.float(title='Take Profit 4 - Target %', defval=100, minval=0.0, step=0.5, group='Take Profit')

/// Stop Loss
// ░░░░░░░░░░░░░░░░░░░░░░░░░░░░░░░░░░░░░░░░░░░░░░░░░░░░░░░░░░░░░░░░░░░░░░░░░░░░░░░░░░░░░░░░░░░░░░░░░░░░░░░░░░░░░░░░░░░░░░░░░░░░░░░░░░░░░░░░░░░░░░░░░░
stoplossPercent = input.float(title='Stop Loss (%)', defval=999, minval=0.01, group='Stop Loss') * 0.01
slLongClose = close < strategy.position_avg_price * (1 - stoplossPercent)
slShortClose = close > strategy.position_avg_price * (1 + stoplossPercent)

/// Leverage
// ░░░░░░░░░░░░░░░░░░░░░░░░░░░░░░░░░░░░░░░░░░░░░░░░░░░░░░░░░░░░░░░░░░░░░░░░░░░░░░░░░░░░░░░░░░░░░░░░░░░░░░░░░░░░░░░░░░░░░░░░░░░░░░░░░░░░░░░░░░░░░░░░░░
leverage = input.float(1, 'Leverage', step=.5, group='Leverage')
contracts = math.min(math.max(.000001, strategy.equity / close * leverage), 1000000000)


/// Trade State Management
// ░░░░░░░░░░░░░░░░░░░░░░░░░░░░░░░░░░░░░░░░░░░░░░░░░░░░░░░░░░░░░░░░░░░░░░░░░░░░░░░░░░░░░░░░░░░░░░░░░░░░░░░░░░░░░░░░░░░░░░░░░░░░░░░░░░░░░░░░░░░░░░░░░░

isInLongPosition = strategy.position_size > 0
isInShortPosition = strategy.position_size < 0

/// ProfitView Alert Syntax String Generation
// ░░░░░░░░░░░░░░░░░░░░░░░░░░░░░░░░░░░░░░░░░░░░░░░░░░░░░░░░░░░░░░░░░░░░░░░░░░░░░░░░░░░░░░░░░░░░░░░░░░░░░░░░░░░░░░░░░░░░░░░░░░░░░░░░░░░░░░░░░░░░░░░░░░

alertSyntaxPrefix = input.string(defval='CRYPTANEX_99FTX_Strategy-Name-Here', title='Alert Syntax Prefix', group='ProfitView Alert Syntax')
alertSyntaxBase = alertSyntaxPrefix + '\n#' + str.tostring(open) + ',' + str.tostring(high) + ',' + str.tostring(low) + ',' + str.tostring(close) + ',' + str.tostring(volume) + ','


/// Trade Execution
// ░░░░░░░░░░░░░░░░░░░░░░░░░░░░░░░░░░░░░░░░░░░░░░░░░░░░░░░░░░░░░░░░░░░░░░░░░░░░░░░░░░░░░░░░░░░░░░░░░░░░░░░░░░░░░░░░░░░░░░░░░░░░░░░░░░░░░░░░░░░░░░░░░░

longConditionCalc = (longCondition and isADXEnabledAndAboveThreshold)
shortConditionCalc = (shortCondition and isADXEnabledAndAboveThreshold)

if calcPeriod
    if longConditionCalc and tradeDirection != 'Short Only' and isInLongPosition == false
        strategy.entry('Long', strategy.long, qty=contracts)

        alert(message=alertSyntaxBase + 'side:long', freq=alert.freq_once_per_bar_close)

    if shortConditionCalc and tradeDirection != 'Long Only' and isInShortPosition == false
        strategy.entry('Short', strategy.short, qty=contracts)

        alert(message=alertSyntaxBase + 'side:short', freq=alert.freq_once_per_bar_close)

    //Inspired from Multiple %% profit exits example by adolgo https://www.tradingview.com/script/kHhCik9f-Multiple-profit-exits-example/
    strategy.exit('TP1', qty_percent=q1, profit=per(tp1))
    strategy.exit('TP2', qty_percent=q2, profit=per(tp2))
    strategy.exit('TP3', qty_percent=q3, profit=per(tp3))
    strategy.exit('TP4', profit=per(tp4))

    strategy.close('Long', qty_percent=100, comment='SL Long', when=slLongClose)
    strategy.close('Short', qty_percent=100, comment='SL Short', when=slShortClose)

    strategy.close_all(when=closeLongCondition or closeShortCondition, comment='Close Postion')

/// Dashboard
// ░░░░░░░░░░░░░░░░░░░░░░░░░░░░░░░░░░░░░░░░░░░░░░░░░░░░░░░░░░░░░░░░░░░░░░░░░░░░░░░░░░░░░░░░░░░░░░░░░░░░░░░░░░░░░░░░░░░░░░░░░░░░░░░░░░░░░░░░░░░░░░░░░░
// Inspired by https://www.tradingview.com/script/uWqKX6A2/ - Thanks VertMT

showDashboard = input.bool(group="Dashboard", title="Show Dashboard", defval=false)

f_fillCell(_table, _column, _row, _title, _value, _bgcolor, _txtcolor) =>
    _cellText = _title + "\n" + _value
    table.cell(_table, _column, _row, _cellText, bgcolor=_bgcolor, text_color=_txtcolor, text_size=size.auto)

// Draw dashboard table
if showDashboard
    var bgcolor = color.new(color.black,0)

    // Keep track of Wins/Losses streaks
    newWin  = (strategy.wintrades  > strategy.wintrades[1]) and (strategy.losstrades == strategy.losstrades[1]) and (strategy.eventrades == strategy.eventrades[1])
    newLoss = (strategy.wintrades == strategy.wintrades[1]) and (strategy.losstrades  > strategy.losstrades[1]) and (strategy.eventrades == strategy.eventrades[1])

    varip int winRow     = 0
    varip int lossRow    = 0
    varip int maxWinRow  = 0
    varip int maxLossRow = 0

    if newWin
        lossRow := 0
        winRow := winRow + 1
    if winRow > maxWinRow
        maxWinRow := winRow

    if newLoss
        winRow := 0
        lossRow := lossRow + 1
    if lossRow > maxLossRow
        maxLossRow := lossRow


    // Prepare stats table
    var table dashTable = table.new(position.bottom_right, 1, 15, border_width=1)


    if barstate.islastconfirmedhistory
        // Update table
        dollarReturn = strategy.netprofit
        f_fillCell(dashTable, 0, 0, "Start:", str.format("{0,date,long}", strategy.closedtrades.entry_time(0)) , bgcolor, color.white) // + str.format(" {0,time,HH:mm}", strategy.closedtrades.entry_time(0))
        f_fillCell(dashTable, 0, 1, "End:", str.format("{0,date,long}", strategy.opentrades.entry_time(0)) , bgcolor, color.white) // + str.format(" {0,time,HH:mm}", strategy.opentrades.entry_time(0))
        _profit = (strategy.netprofit / strategy.initial_capital) * 100
        f_fillCell(dashTable, 0, 2, "Net Profit:", str.tostring(_profit, '##.##') + "%", _profit > 0 ? color.green : color.red, color.white)
        _numOfDaysInStrategy = (strategy.opentrades.entry_time(0) - strategy.closedtrades.entry_time(0)) / (1000 * 3600 * 24)
        f_fillCell(dashTable, 0, 3, "Percent Per Day", str.tostring(_profit / _numOfDaysInStrategy, '#########################.#####')+"%", _profit > 0 ? color.green : color.red, color.white)
        _winRate = ( strategy.wintrades / strategy.closedtrades ) * 100
        f_fillCell(dashTable, 0, 4, "Percent Profitable:", str.tostring(_winRate, '##.##') + "%", _winRate < 50 ? color.red : _winRate < 75 ? #999900 : color.green, color.white)
        f_fillCell(dashTable, 0, 5, "Profit Factor:", str.tostring(strategy.grossprofit / strategy.grossloss,  '##.###'), strategy.grossprofit > strategy.grossloss ? color.green : color.red, color.white)
        f_fillCell(dashTable, 0, 6, "Total Trades:", str.tostring(strategy.closedtrades), bgcolor, color.white)
        f_fillCell(dashTable, 0, 8, "Max Wins In A Row:", str.tostring(maxWinRow, '######') , bgcolor, color.white)
        f_fillCell(dashTable, 0, 9, "Max Losses In A Row:", str.tostring(maxLossRow, '######') , bgcolor, color.white)