Chiến lược giao dịch đường trung bình động phổ rộng dao động
Tổng quan
Chiến lược này dựa trên các trung bình di chuyển quang phổ rộng, hình thành tín hiệu giao dịch bằng cách tạo ra các dấu hiệu giao dịch bằng cách sử dụng các trung bình di chuyển nhanh và chậm. Các trung bình di chuyển quang phổ rộng bao gồm nhiều loại từ trung bình di chuyển đơn giản đến trung bình di chuyển dao động, có thể điều chỉnh sự kết hợp tự do thông qua các tham số và có khả năng thích ứng mạnh mẽ.
Nguyên tắc chiến lược
Chiến lược này sử dụng hàm trung bình di chuyển biến thể, có thể tạo ra 12 loại trung bình di chuyển khác nhau. Nguyên tắc cơ bản là tính toán hai trung bình di chuyển: đường nhanh (Close MA) và đường chậm (Open MA), tạo ra tín hiệu mua khi đi qua đường chậm trên đường nhanh và tạo ra tín hiệu bán khi đi qua đường chậm dưới đường nhanh.
Logic quan trọng là tạo ra hai đường trung bình di chuyển thông qua hàm biến:closeSeries = variant(basisType, close, basisLen, offsetSigma, offsetALMA)VàopenSeries = variant(basisType, open, basisLen, offsetSigma, offsetALMA)Chức năng variant bao gồm 12 loại phương pháp tính toán trung bình khác nhau, có thể được lựa chọn tự do thông qua các tham số BasisType. Như vậy, kết hợp các trung bình di chuyển phổ rộng được thực hiện.
Lập luận tạo tín hiệu giao dịch cơ bản là:longCond = xlong Và shortCond = xshortCó thể nói, nếu bạn đi qua đường dây nhanh, bạn sẽ làm nhiều hơn, nhưng nếu đi qua đường dây chậm, bạn sẽ không làm gì cả.
Quy tắc đầu vào chiến lược là khi điều kiện longCond hoặc shortCond được đáp ứng, mỗi điều kiện sẽ được thực hiện một lần nữa. Quy tắc dừng lỗ là khi giá di chuyển đến điểm dừng lỗ được đặt trước.
Phân tích lợi thế
Ưu điểm lớn nhất của chiến lược này là có thể tự do kết hợp nhiều loại moving average khác nhau. Các thị trường khác nhau có chu kỳ khác nhau, và không chắc chắn là loại moving average nào phù hợp nhất, chiến lược này cung cấp khả năng tùy chỉnh mạnh mẽ. Người dùng có thể xác định sự kết hợp tham số tốt nhất bằng cách thử nghiệm lặp lại, để đưa ra các giải pháp tối ưu cho thị trường cụ thể.
Một lợi thế khác là logic của chiến lược đơn giản và rõ ràng, nhưng cung cấp chức năng mạnh mẽ. Người dùng dễ dàng hiểu và sử dụng chiến lược. Đồng thời, tham số đầu vào phong phú cũng cung cấp không gian tối ưu hóa đầy đủ cho người dùng cao cấp.
Phân tích rủi ro
Rủi ro lớn nhất của chiến lược này là có một mức độ chậm trễ của đường trung bình di chuyển phổ quát. Nó có thể gây ra tổn thất lớn khi có sự phá vỡ giá bất thường. Ngoài ra, nếu lựa chọn tham số không đúng, nó cũng có thể dẫn đến tần suất giao dịch quá cao hoặc tạo ra tín hiệu dư thừa.
Để giảm rủi ro, khuyến nghị kết hợp các chỉ số khác để đánh giá hiệu quả của tín hiệu, tránh bị phá vỡ giả. Ngoài ra, tối ưu hóa và kiểm tra lại các tham số cũng rất cần thiết, cần phải thử nghiệm lặp lại để tìm ra sự kết hợp các tham số tối ưu.
Hướng tối ưu hóa
Chiến lược này có một số hướng tối ưu hóa chính:
- Kiểm tra nhiều loại kết hợp trung bình di chuyển hơn để tìm kiếm kết hợp tốt nhất
- Thêm bộ lọc để tránh các tín hiệu giả, ví dụ như kết hợp với chỉ số khối lượng giao dịch
- Tối ưu hóa tham số chiều dài của đường trung bình di chuyển, tìm tham số tốt nhất
- Tối ưu hóa quy mô vị trí và tham số dừng lỗ
- Thử các loại và chu kỳ khác nhau
Bằng cách tối ưu hóa một số hướng trên, bạn có thể liên tục nâng cao hiệu suất thực tế của chiến lược.
Tóm tắt
Chiến lược giao dịch này dựa trên đường trung bình di chuyển phổ rộng tạo ra tính linh hoạt cao. Nó cung cấp tính năng tùy chỉnh mạnh mẽ, người dùng có thể tự do chọn và kết hợp các loại trung bình khác nhau.
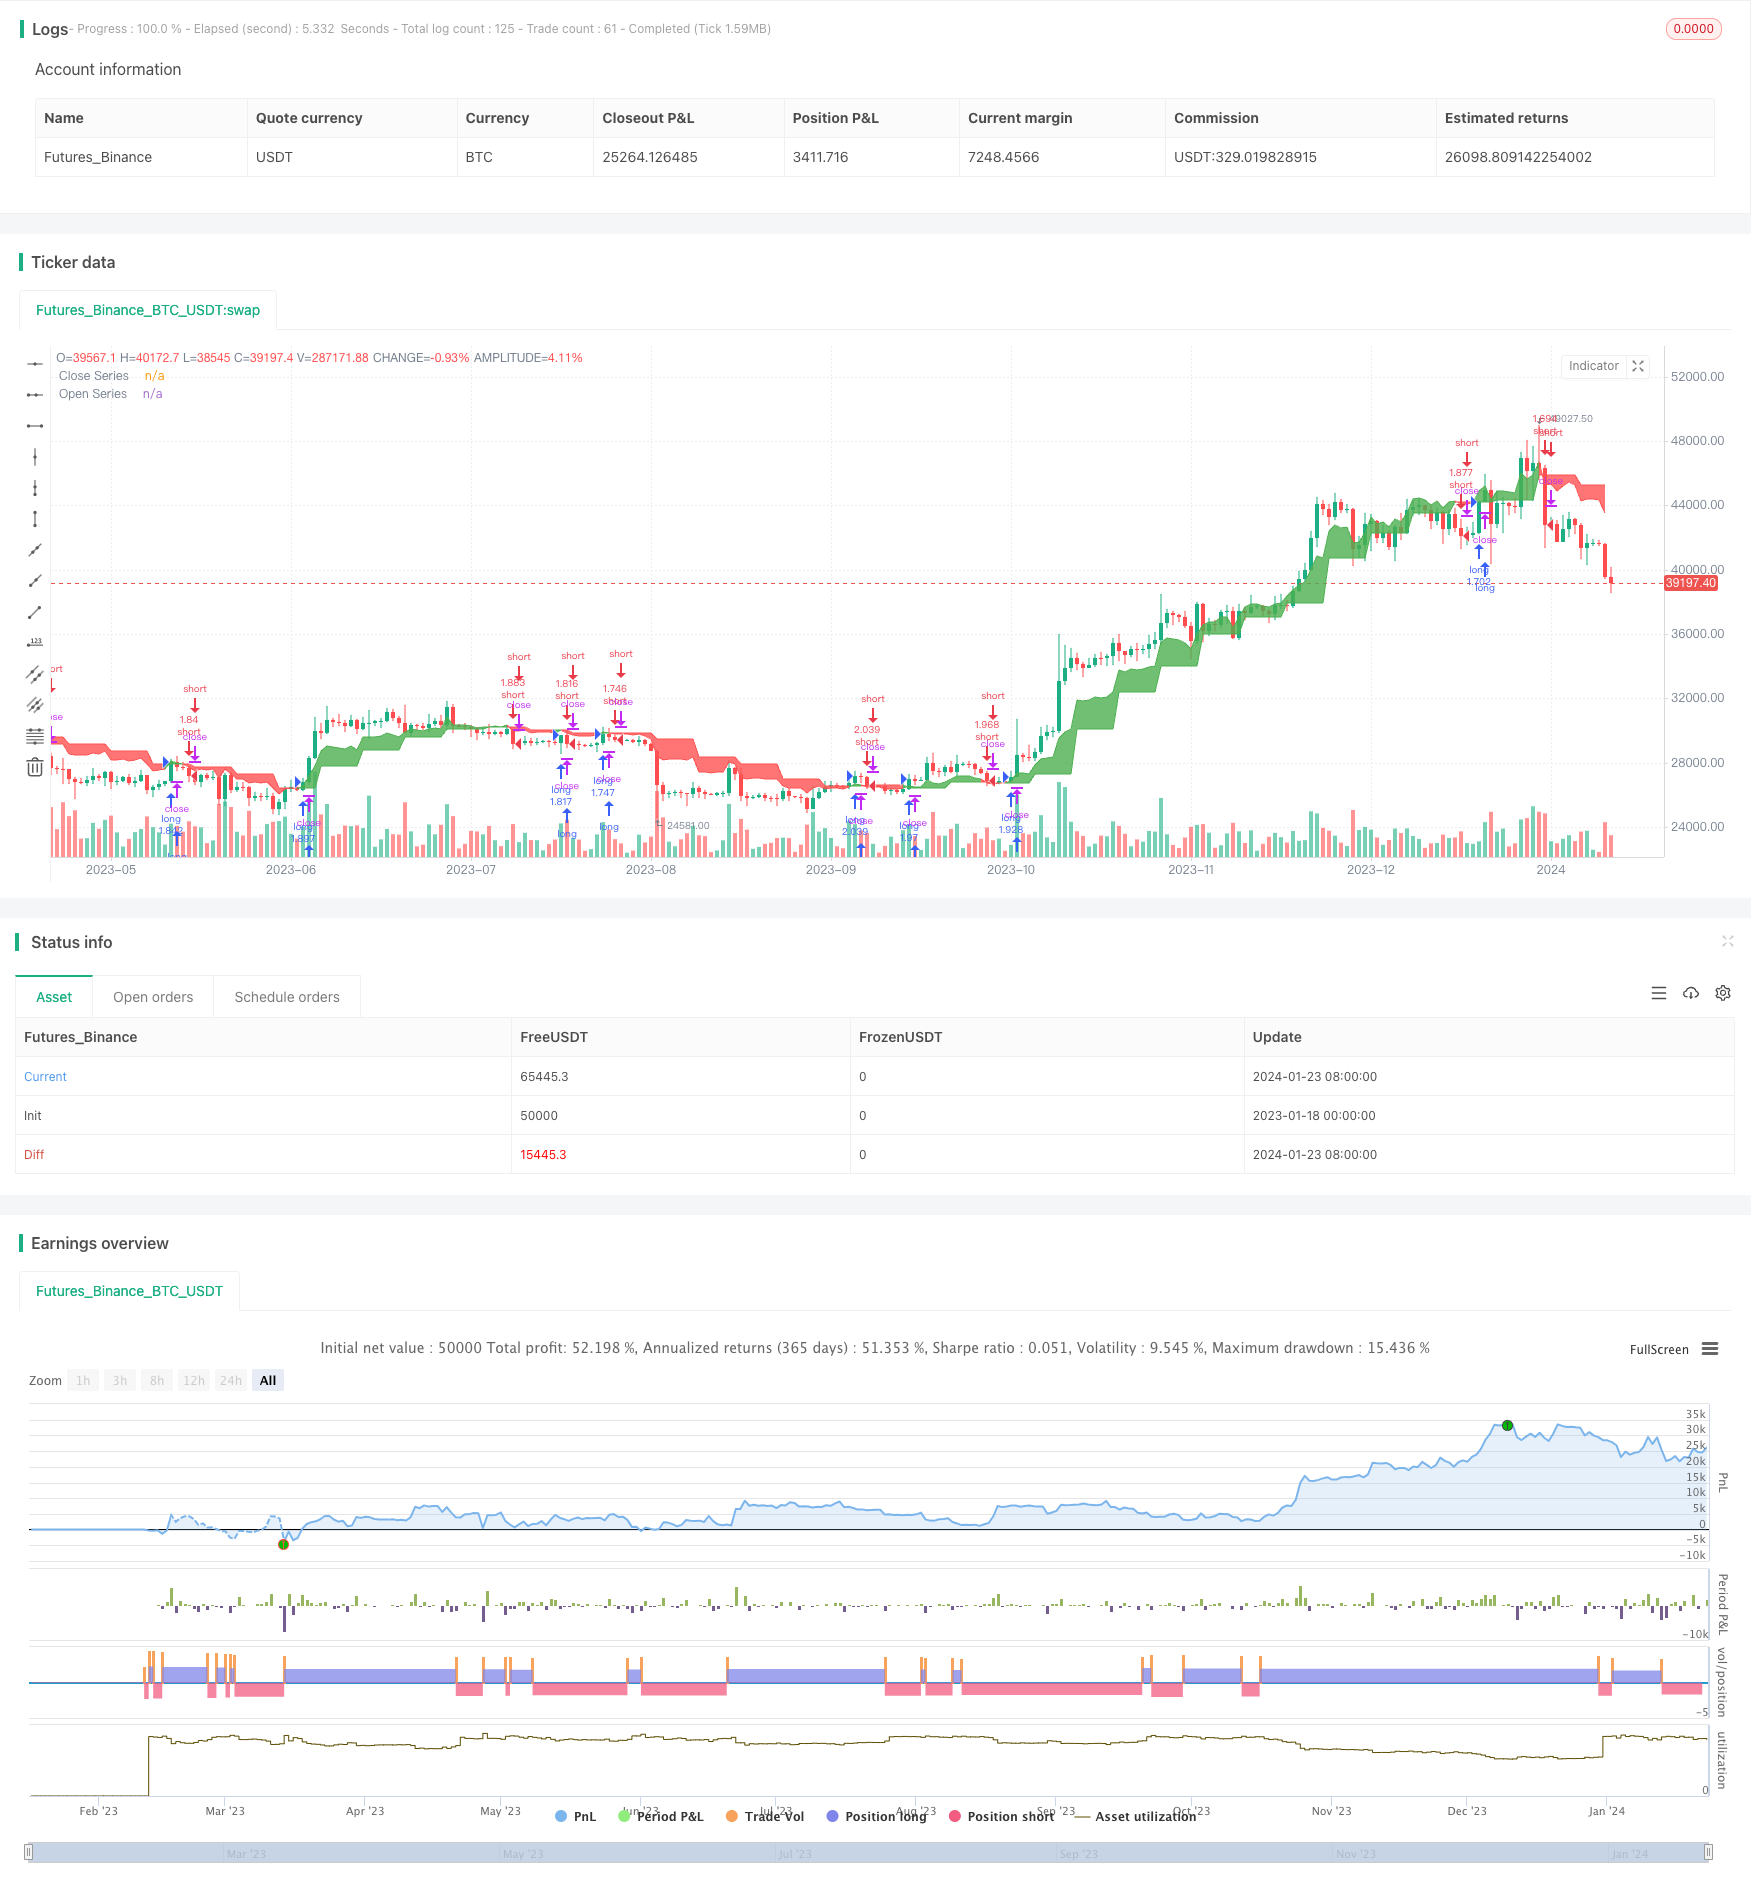
/*backtest
start: 2023-01-18 00:00:00
end: 2024-01-24 00:00:00
period: 1d
basePeriod: 1h
exchanges: [{"eid":"Futures_Binance","currency":"BTC_USDT"}]
*/

//@version=4
//

strategy(title="Long/Short", shorttitle="Banana Maker", overlay=true, pyramiding=0, default_qty_type=strategy.percent_of_equity, default_qty_value=100, calc_on_every_tick=false)


// === INPUTS ===
useRes = input(defval=true, title="Use Alternate Resolution?")
intRes = input(defval=7, title="Multiplier for Alernate Resolution")
stratRes = timeframe.ismonthly ? tostring(timeframe.multiplier * intRes, "###M") :
   timeframe.isweekly ? tostring(timeframe.multiplier * intRes, "###W") :
   timeframe.isdaily ? tostring(timeframe.multiplier * intRes, "###D") :
   timeframe.isintraday ? tostring(timeframe.multiplier * intRes, "####") : '60'
basisType = input(defval="DEMA", title="MA Type: ", options=["SMA", "EMA", "DEMA", "TEMA", "WMA", "VWMA", "SMMA", "HullMA", "LSMA", "ALMA", "SSMA", "TMA"])
basisLen = input(defval=8, title="MA Period", minval=1)
offsetSigma = input(defval=6, title="Offset for LSMA / Sigma for ALMA", minval=0)
offsetALMA = input(defval=0.85, title="Offset for ALMA", minval=0, step=0.01)
scolor = input(false, title="Show coloured Bars to indicate Trend?")
delayOffset = input(defval=0, title="Delay Open/Close MA (Forces Non-Repainting)", minval=0, step=1)
tradeType = input("BOTH", title="What trades should be taken : ", options=["LONG", "SHORT", "BOTH", "NONE"])
// === /INPUTS ===

// Constants colours that include fully non-transparent option.
green100 = #008000FF
lime100 = #6ad279
red100 = #FF0000FF
blue100 = #0000FFFF
aqua100 = #00FFFFFF
darkred100 = #8B0000FF
gray100 = #808080FF

// === BASE FUNCTIONS ===
variant(type, src, len, offSig, offALMA) =>
    v1 = sma(src, len)  // Simple
    v2 = ema(src, len)  // Exponential
    v3 = 2 * v2 - ema(v2, len)  // Double Exponential
    v4 = 3 * (v2 - ema(v2, len)) + ema(ema(v2, len), len)  // Triple Exponential
    v5 = wma(src, len)  // Weighted
    v6 = vwma(src, len)  // Volume Weighted
    v7 = 0.0
    sma_1 = sma(src, len)  // Smoothed
    v7 := na(v7[1]) ? sma_1 : (v7[1] * (len - 1) + src) / len
    v8 = wma(2 * wma(src, len / 2) - wma(src, len), round(sqrt(len)))  // Hull
    v9 = linreg(src, len, offSig)  // Least Squares
    v10 = alma(src, len, offALMA, offSig)  // Arnaud Legoux
    v11 = sma(v1, len)  // Triangular (extreme smooth)
    // SuperSmoother filter
    // © 2013  John F. Ehlers
    a1 = exp(-1.414 * 3.14159 / len)
    b1 = 2 * a1 * cos(1.414 * 3.14159 / len)
    c2 = b1
    c3 = -a1 * a1
    c1 = 1 - c2 - c3
    v12 = 0.0
    v12 := c1 * (src + nz(src[1])) / 2 + c2 * nz(v12[1]) + c3 * nz(v12[2])
    type == "EMA" ? v2 : type == "DEMA" ? v3 :
       type == "TEMA" ? v4 : type == "WMA" ? v5 : type == "VWMA" ? v6 :
       type == "SMMA" ? v7 : type == "HullMA" ? v8 : type == "LSMA" ? v9 :
       type == "ALMA" ? v10 : type == "TMA" ? v11 : type == "SSMA" ? v12 : v1

// security wrapper for repeat calls* NEEDS REFINEMENT- backtesting this shows repaint. need new wrapper
reso(exp, use, res) =>
    security_1 = security(syminfo.tickerid, res, exp, gaps=barmerge.gaps_off, lookahead=barmerge.lookahead_on)
    use ? security_1 : exp


// === /BASE FUNCTIONS ===

// === SERIES SETUP ===
closeSeries = variant(basisType, close[delayOffset], basisLen, offsetSigma, offsetALMA)
openSeries = variant(basisType, open[delayOffset], basisLen, offsetSigma, offsetALMA)
// === /SERIES ===

// === PLOTTING ===

// alt resulution
closeSeriesAlt = reso(closeSeries, useRes, stratRes)
openSeriesAlt = reso(openSeries, useRes, stratRes)
//
trendColour = closeSeriesAlt > openSeriesAlt ? color.green : color.red
bcolour = closeSeries > openSeriesAlt ? lime100 : red100
barcolor(scolor ? bcolour : na, title="Bar Colours")
closeP = plot(closeSeriesAlt, title="Close Series", color=trendColour, linewidth=0, style=plot.style_line, transp=1)
openP = plot(openSeriesAlt, title="Open Series", color=trendColour, linewidth=0, style=plot.style_line, transp=1)
fill(closeP, openP, color=trendColour, transp=80)

// === /PLOTTING ===
//

//
// === ALERT conditions

xlong = crossover(closeSeriesAlt, openSeriesAlt)
xshort = crossunder(closeSeriesAlt, openSeriesAlt)
longCond = xlong  // alternative: longCond[1]? false : (xlong or xlong[1]) and close>closeSeriesAlt and close>=open
shortCond = xshort  // alternative: shortCond[1]? false : (xshort or xshort[1]) and close<closeSeriesAlt and close<=open


// === /ALERT conditions. needs work in study mode. the banana maker is the study script.
// Create alert for cross, shunt back 1 if source is not 'open', this should prevent repaint issue.
//shunt = RSIsrc == open ? 0 : 1
//shunt = 0
//c_alert = (buy[shunt]==1 or sell[shunt]==1)
//alertcondition(c_alert, title="QQECROSS Alert", message="QQECROSS Alert")
// show only when alert condition is met and bar closed.
//plotshape(c_alert,title= "Alert Indicator Closed", location=location.bottom, color=sell[shunt]==1?red:green, transp=0, style=shape.circle)

//Repaint city, study mode will help but wont trigger the alerts


// === STRATEGY ===
// stop loss
slPoints = input(defval=0, title="Initial Stop Loss Points (zero to disable)", minval=0)
tpPoints = input(defval=0, title="Initial Target Profit Points (zero for disable)", minval=0)
// Include bar limiting algorithm
ebar = input(defval=1000, title="Number of Bars for Back Testing", minval=0)
dummy = input(false, title="- SET to ZERO for Daily or Longer Timeframes")
//
// Calculate how many mars since last bar
tdays = (timenow - time) / 60000.0  // number of minutes since last bar
tdays := timeframe.ismonthly ? tdays / 1440.0 / 5.0 / 4.3 / timeframe.multiplier :
   timeframe.isweekly ? tdays / 1440.0 / 5.0 / timeframe.multiplier :
   timeframe.isdaily ? tdays / 1440.0 / timeframe.multiplier :
   tdays / timeframe.multiplier  // number of bars since last bar
//
//set up exit parameters
TP = tpPoints > 0 ? tpPoints : na
SL = slPoints > 0 ? slPoints : na

// Make sure we are within the bar range, Set up entries and exit conditions
if (ebar == 0 or tdays <= ebar) and tradeType != "NONE"
    strategy.entry("long", strategy.long, when=longCond == true and tradeType != "SHORT")
    strategy.entry("short", strategy.short, when=shortCond == true and tradeType != "LONG")
    strategy.close("long", when=shortCond == true and tradeType == "LONG")
    strategy.close("short", when=longCond == true and tradeType == "SHORT")
    strategy.exit("XL", from_entry="long", profit=TP, loss=SL)
    strategy.exit("XS", from_entry="short", profit=TP, loss=SL)


// === /STRATEGY ===
// eof