Chiến lược giao dịch đường trung bình động kép chéo khung thời gian
Tổng quan
Chiến lược này tạo ra các tín hiệu mua và bán trên hai khung thời gian khác nhau bằng cách tính toán hai loại moving average khác nhau. Đây là một chiến lược sandbox rất tốt, có thể được sử dụng để thử nghiệm các loại moving average khác nhau và các kết hợp khung thời gian khác nhau.
Nguyên tắc chiến lược
Chiến lược này sử dụng hai đường trung bình di chuyển, một đường trung bình di chuyển nhanh và một đường trung bình di chuyển chậm. Các khung thời gian của đường trung bình di chuyển nhanh lớn hơn hoặc bằng khung thời gian của biểu đồ. Một tín hiệu mua được tạo ra khi đường trung bình di chuyển nhanh vượt lên đường trung bình di chuyển chậm; một tín hiệu bán được tạo ra khi đường trung bình di chuyển nhanh vượt xuống đường trung bình di chuyển chậm.
Người dùng có thể chọn nhiều loại moving average khác nhau, chẳng hạn như SMA, EMA, KAMA, và các khung thời gian khác nhau, để có thể tìm ra tham số tốt nhất thông qua các thí nghiệm kết hợp.
Phân tích lợi thế
Ưu điểm lớn nhất của chiến lược này là có thể dễ dàng điều chỉnh các kết hợp khác nhau của các tham số thí nghiệm để tìm các thiết lập tham số tối ưu.
Người dùng có thể tự do chọn loại, thời gian và khung thời gian của hai loại trung bình di chuyển, hệ thống sẽ tính toán và hiển thị kết quả trong thời gian thực. Điều này dễ dàng hơn nhiều so với các chiến lược kết hợp để kiểm tra một tham số.
Và chiến lược này có tính năng dừng lỗ để giảm rủi ro và tăng khả năng kiếm tiền.
Phân tích rủi ro
Rủi ro lớn nhất của chiến lược này là thiết lập tham số không đúng có thể dẫn đến tín hiệu giao dịch quá thường xuyên, làm tăng chi phí giao dịch và mất điểm trượt.
Ngoài ra, đường trung bình di chuyển đôi có thể tạo ra các tín hiệu giả, và nếu các tham số được chọn không đúng, tín hiệu mua và bán có thể không đáng tin cậy.
Những rủi ro này có thể được giảm thiểu bằng cách tối ưu hóa các tham số, kết hợp các chỉ số khác.
Hướng tối ưu hóa
Bạn có thể xem xét thêm một bộ chỉ số khác dựa trên đường trung bình di chuyển đôi để lọc, chẳng hạn như chỉ số RSI để xác nhận tín hiệu mua và bán, do đó giảm tín hiệu giả.
Ngoài ra, bạn có thể thử tối ưu hóa đào tạo tham số của trung bình di chuyển để tìm ra sự kết hợp tham số tốt nhất. Bạn cũng có thể xem xét sử dụng phương pháp học máy để tối ưu hóa tham số động.
Tóm tắt
Chiến lược này là một sandbox thí nghiệm đường trung bình di chuyển đôi rất tốt. Ưu điểm của nó là có thể lặp lại một số tổ hợp tham số khác nhau để tìm chiến lược giao dịch tốt nhất. Tất nhiên, cũng có một số rủi ro đặt tham số không đúng, điều này cần phải lọc để giảm rủi ro bằng cách thêm các tổ hợp chỉ số khác. Nếu tiếp tục tối ưu hóa chiến lược, có thể sẽ có hiệu quả giao dịch tốt hơn.
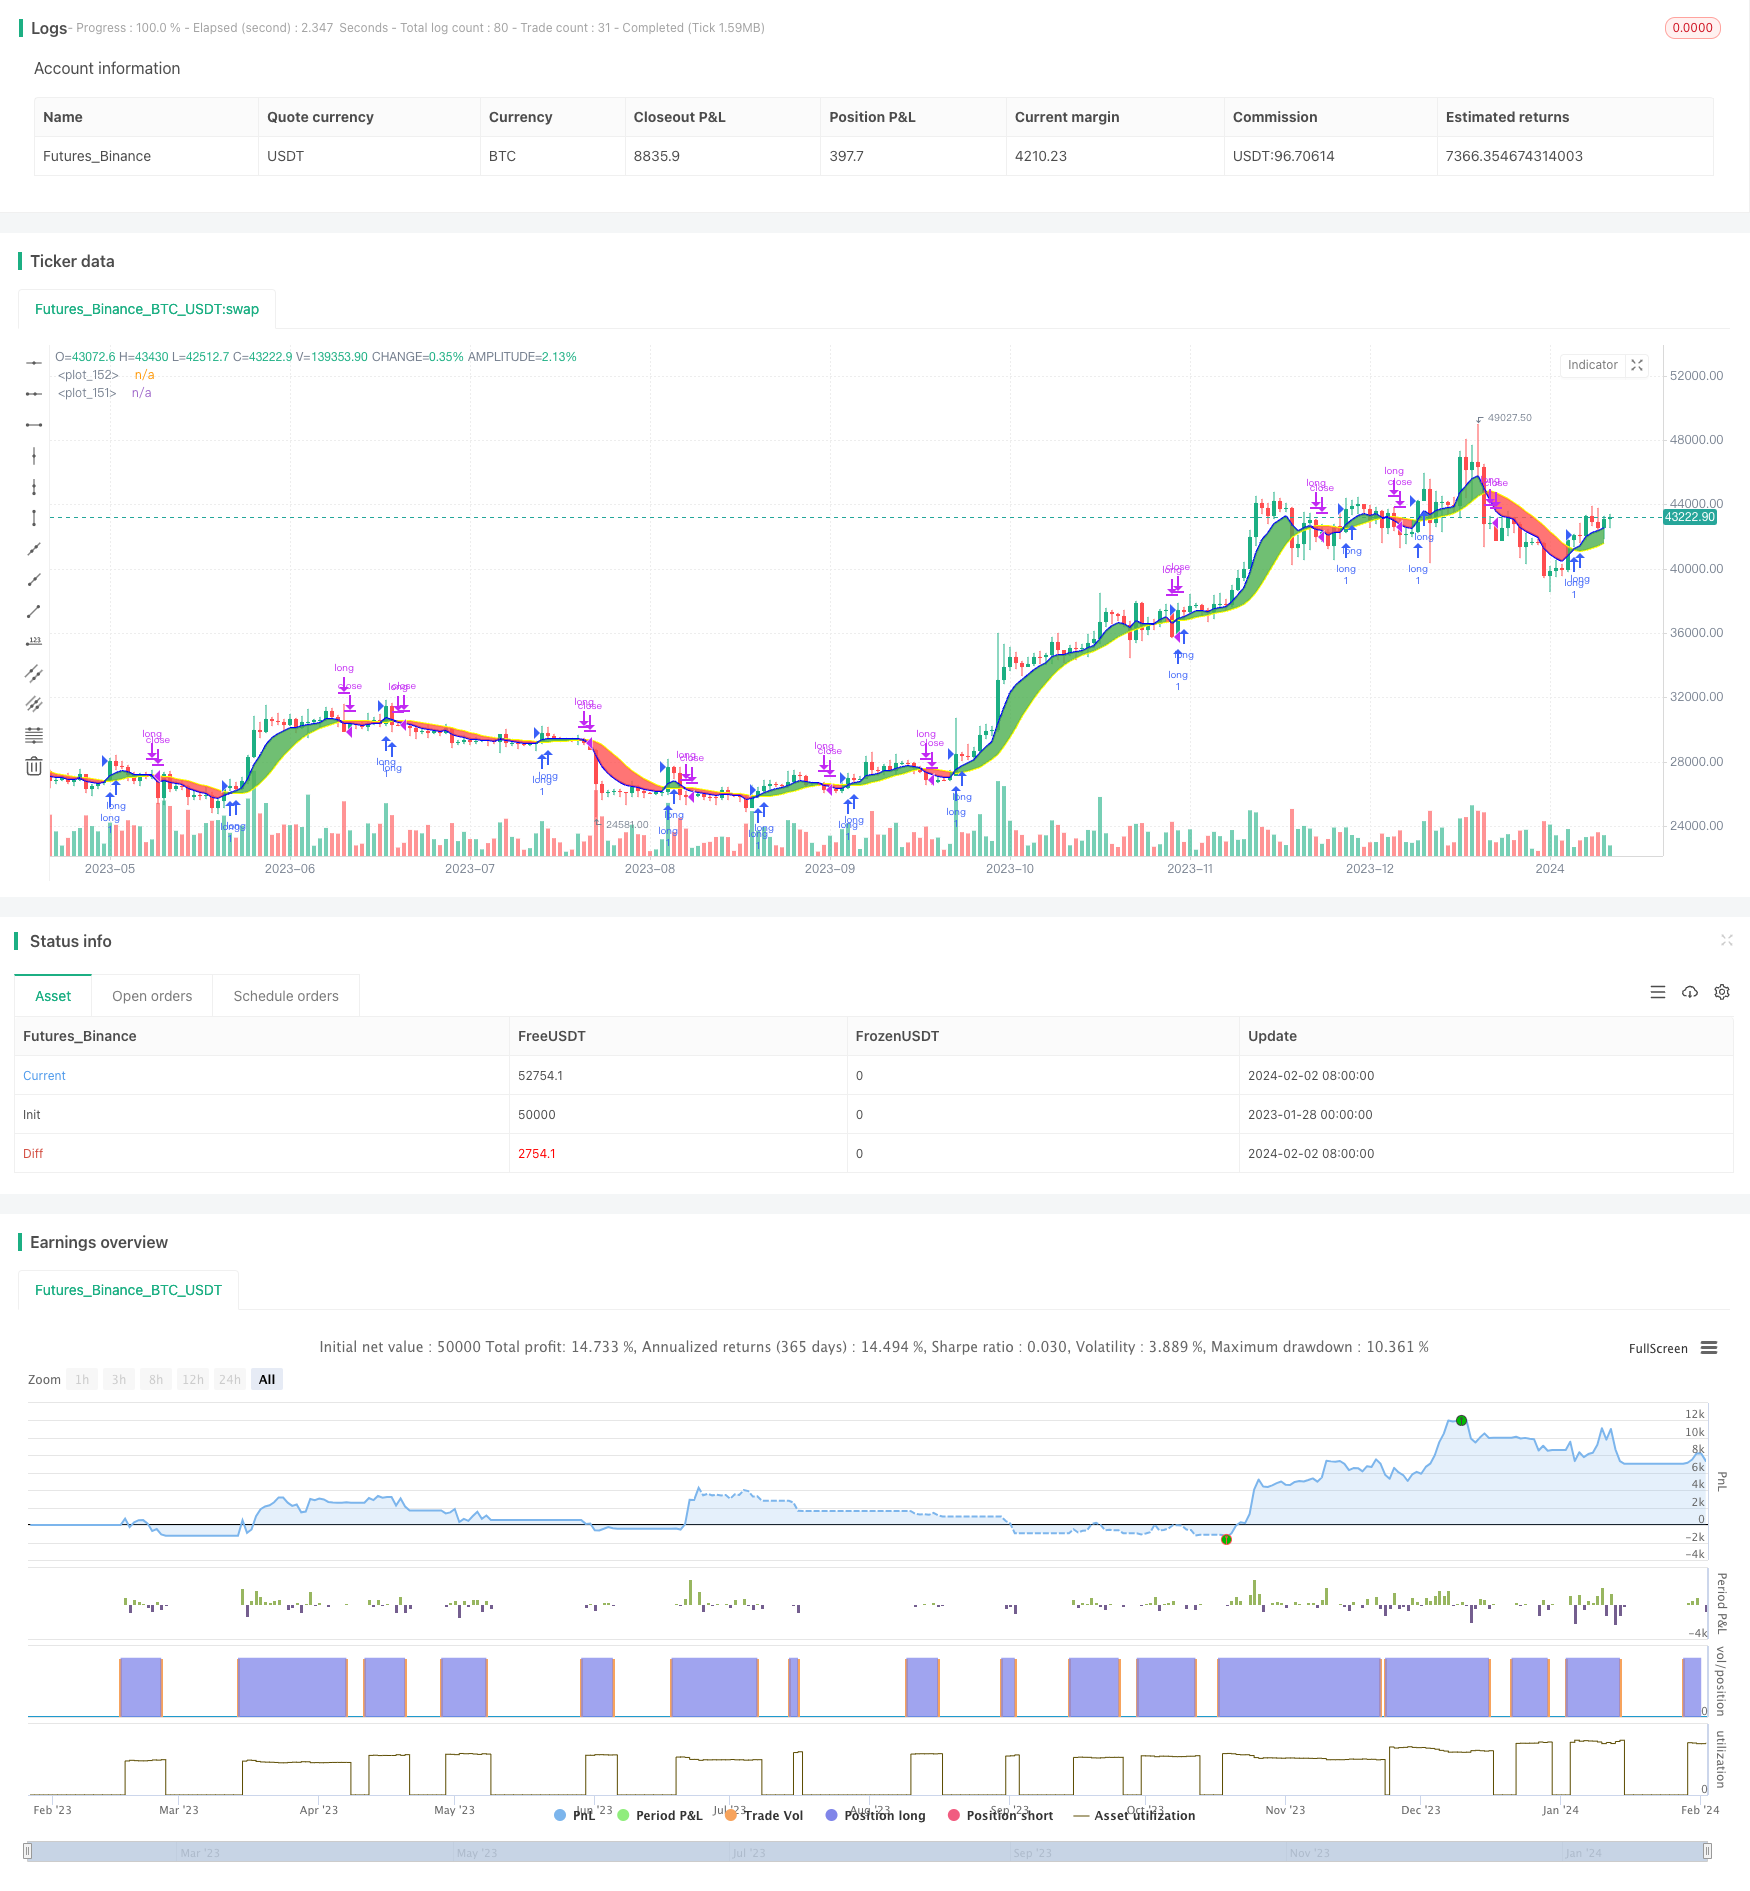
/*backtest
start: 2023-01-28 00:00:00
end: 2024-02-03 00:00:00
period: 1d
basePeriod: 1h
exchanges: [{"eid":"Futures_Binance","currency":"BTC_USDT"}]
*/

// This work is licensed under a Creative Commons Attribution-ShareAlike 4.0 International License https://creativecommons.org/licenses/by-sa/4.0/
// © dman103
// A moving averages SandBox strategy where you can experiment using two different moving averages (like KAMA, ALMA, HMA, JMA, VAMA and more) on different time frames to generate BUY and SELL signals, when they cross.
// Great sandbox for experimenting with different moving averages and different time frames.
//
// == How to use ==
// We select two types of moving averages on two different time frames:
//
// First is the FAST moving average that should be at the same time frame or higher.
// Second is the SLOW moving average that should be on the same time frame or higher.
// When FAST moving average cross over the SLOW moving average we have a BUY signal (for LONG)
// When FAST moving average cross under the SLOW moving average we have a SELL signal (for SHORT)


// WARNING: Using a lower time frame than your chart time frame will result in unrealistic results in your backtesting and bar replay.
// == NOTES ==
// You can select BOTH, LONG, SHORT or NONE in the strategy settings.
// You can also enable Stop Loss and Take Profit.
// More sandboxes to come, Follow to get notified.
// Can also act as indicator by settings 'What trades should be taken' to 'NONE'

//@version=4
strategy("Multi MA MTF SandBox Strategy","Multi MA SandBox",overlay=true)
tradeType = input("LONG", title="What trades should be taken:", options=["LONG", "SHORT", "BOTH", "NONE"])
fast_title = input(true,     title='---------------- Fast Moving Average (BLUE)----------------', type=input.bool)
ma_select1 = input(title="First Slow moving average", defval="EMA", options=["SMA", "EMA", "WMA", "HMA", "JMA", "KAMA", "TMA", "VAMA", "SMMA", "DEMA" , "VMA", "WWMA", "EMA_NO_LAG", "TSF","ALMA"])
resma_fast = input(title="First Time Frame", type=input.resolution, defval="")
lenma_fast = input(title="First MA Length", type=input.integer, defval=6)
slow_title = input(true,     title='---------------- Slow Moving Average (YELLOW)----------------', type=input.bool)
ma_select2 = input(title="Second Fast moving average", defval="JMA", options=["SMA", "EMA", "WMA", "HMA", "JMA", "KAMA", "TMA", "VAMA", "SMMA", "DEMA" , "VMA", "WWMA", "EMA_NO_LAG", "TSF","ALMA"])
resma_slow = input(title="Second time frame", type=input.resolution, defval="")
lenma_slow = input(title="Second MA length", type=input.integer, defval=14)

settings = input(true,     title='---------------- Other Settings ----------------', type=input.bool)
lineWidth = input(2,title="Line Width")
colorTransparency=input(50,title="Color Transparency",step=10,minval=0,maxval=100)
color_fast=input(color.blue,type=input.color)
color_slow=input(color.yellow,type=input.color)
fillColor = input(title="Fill Color", type=input.bool, defval=true)
IndicatorSettings = input(true,     title='---------------- Indicators Settings ----------------', type=input.bool)
offset=input(title="Alma Offset (only for ALMA)",defval=0.85, step=0.05)
volatility_lookback =input(title="Volatility lookback (only for VAMA)",defval=12)
i_fastAlpha = input(1.25,"KAMA's alpha (only for KAMA)", minval=1,step=0.25)
fastAlpha = 2.0 / (i_fastAlpha + 1)
slowAlpha = 2.0 / (31)
///////Moving Averages
MA_selector(src, length,ma_select) =>
    ma = 0.0
    if ma_select == "SMA"
        ma := sma(src, length)
        ma

    if ma_select == "EMA"
        ma := ema(src, length)
        ma

    if ma_select == "WMA"
        ma := wma(src, length)
        ma
    if ma_select == "HMA"
        ma := hma(src,length)
        ma
    if ma_select == "JMA"
        beta = 0.45*(length-1)/(0.45*(length-1)+2)
        alpha = beta
        tmp0 = 0.0, tmp1 = 0.0, tmp2 = 0.0, tmp3 = 0.0, tmp4 = 0.0
        tmp0 := (1-alpha)*src + alpha*nz(tmp0[1])
        tmp1 := (src - tmp0[0])*(1-beta) + beta*nz(tmp1[1])
        tmp2 := tmp0[0] + tmp1[0]
        tmp3 := (tmp2[0] - nz(tmp4[1]))*((1-alpha)*(1-alpha)) + (alpha*alpha)*nz(tmp3[1])
        tmp4 := nz(tmp4[1]) + tmp3[0]
        ma := tmp4
        ma
    if ma_select == "KAMA"
        momentum = abs(change(src, length))
        volatility = sum(abs(change(src)), length)
        efficiencyRatio = volatility != 0 ? momentum / volatility : 0
        smoothingConstant = pow((efficiencyRatio * (fastAlpha - slowAlpha)) + slowAlpha, 2)
        var kama = 0.0
        kama := nz(kama[1], src) + smoothingConstant * (src - nz(kama[1], src))
        ma:=kama
        ma
    if ma_select == "TMA"
        ma := sma(sma(src, ceil(length / 2)), floor(length / 2) + 1)
        ma

    if ma_select == "VMA"
        valpha=2/(length+1)
        vud1=src>src[1] ? src-src[1] : 0
        vdd1=src<src[1] ? src[1]-src : 0
        vUD=sum(vud1,9)
        vDD=sum(vdd1,9)
        vCMO=nz((vUD-vDD)/(vUD+vDD))
        VAR=0.0
        VAR:=nz(valpha*abs(vCMO)*src)+(1-valpha*abs(vCMO))*nz(VAR[1])
        ma := VAR
        ma

    if ma_select == "WWMA"
        wwalpha = 1/ length
        WWMA = 0.0
        WWMA := wwalpha*src + (1-wwalpha)*nz(WWMA[1])
        ma := WWMA
        ma

    if ma_select == "EMA_NO_LAG"
        EMA1= ema(src,length)
        EMA2= ema(EMA1,length)
        Difference= EMA1 - EMA2
        ma := EMA1 + Difference
        ma

    if ma_select == "TSF"
        lrc = linreg(src, length, 0)
        lrc1 = linreg(src,length,1)
        lrs = (lrc-lrc1)
        TSF = linreg(src, length, 0)+lrs
        ma := TSF
        ma

    if ma_select =="VAMA" // Volatility Adjusted from @fractured
        mid=ema(src,length)
        dev=src-mid
        vol_up=highest(dev,volatility_lookback)
        vol_down=lowest(dev,volatility_lookback)
        ma := mid+avg(vol_up,vol_down)
        ma
    if ma_select == "SMMA"
        smma = float (0.0)
        smaval=sma(src, length)
        smma := na(smma[1]) ? smaval : (smma[1] * (length - 1) + src) / length
        ma := smma

    if ma_select == "DEMA"
        e1 = ema(src, length)
        e2 = ema(e1, length)
        ma := 2 * e1 - e2
        ma
    if ma_select == "ALMA"
        ma := alma(src, length,offset, 6)
        ma
    ma

// Calculate EMA
ma_fast = MA_selector(close, lenma_fast,ma_select1)
ma_slow = MA_selector(close, lenma_slow,ma_select2)

maFastStep = security(syminfo.tickerid, resma_fast, ma_fast)
maSlowStep = security(syminfo.tickerid, resma_slow, ma_slow)

ma1_plot=plot(maFastStep, color=color_fast,linewidth=lineWidth,transp=colorTransparency)
ma2_plot=plot(maSlowStep, color=color_slow,linewidth=lineWidth,transp=colorTransparency)
colors=ma_fast>ma_slow ? color.green : color.red
fill(ma1_plot,ma2_plot, color=fillColor? colors: na,transp=colorTransparency+15)

closeStatus = strategy.openprofit > 0 ? "win" : "lose"
////////Long Rules
long = crossover(maFastStep,maSlowStep) and (tradeType == "LONG" or tradeType == "BOTH")
longClose =crossunder(maFastStep,maSlowStep)//and falling(maSlowStep,1)
///////Short Rules
short =crossunder(maFastStep,maSlowStep) and (tradeType == "SHORT" or tradeType == "BOTH")
shortClose =  crossover(maFastStep,maSlowStep)


longShape= crossover(maFastStep,maSlowStep) and tradeType == "NONE"
shortShape = crossunder(maFastStep,maSlowStep) and tradeType == "NONE"
plotshape(longShape, style=shape.triangleup,location=location.belowbar, color=color.lime,size=size.small)
plotshape(shortShape,style=shape.triangledown,location=location.abovebar, color=color.red,size=size.small)
// === Stop LOSS ===
useStopLoss = input(false, title='----- Add Stop Loss / Take profit -----', type=input.bool)

sl_inp = input(2.5, title='Stop Loss %', type=input.float, step=0.1)/100
tp_inp = input(5, title='Take Profit %', type=input.float, step=0.1)/100
stop_level = strategy.position_avg_price * (1 - sl_inp)
take_level = strategy.position_avg_price * (1 + tp_inp)
stop_level_short = strategy.position_avg_price * (1 + sl_inp)
take_level_short = strategy.position_avg_price * (1 - tp_inp)
if (long)
    strategy.entry("long", strategy.long)
if (short)
    strategy.entry("short", strategy.short)

strategy.close ("long", when = longClose, comment=closeStatus)
strategy.close ("short", when = shortClose, comment=closeStatus)

if (useStopLoss)
    strategy.exit("Stop Loss/Profit Long","long", stop=stop_level, limit=take_level,comment =closeStatus )
    strategy.exit("Stop Loss/Profit Short","short", stop=stop_level_short, limit=take_level_short, comment = closeStatus)