
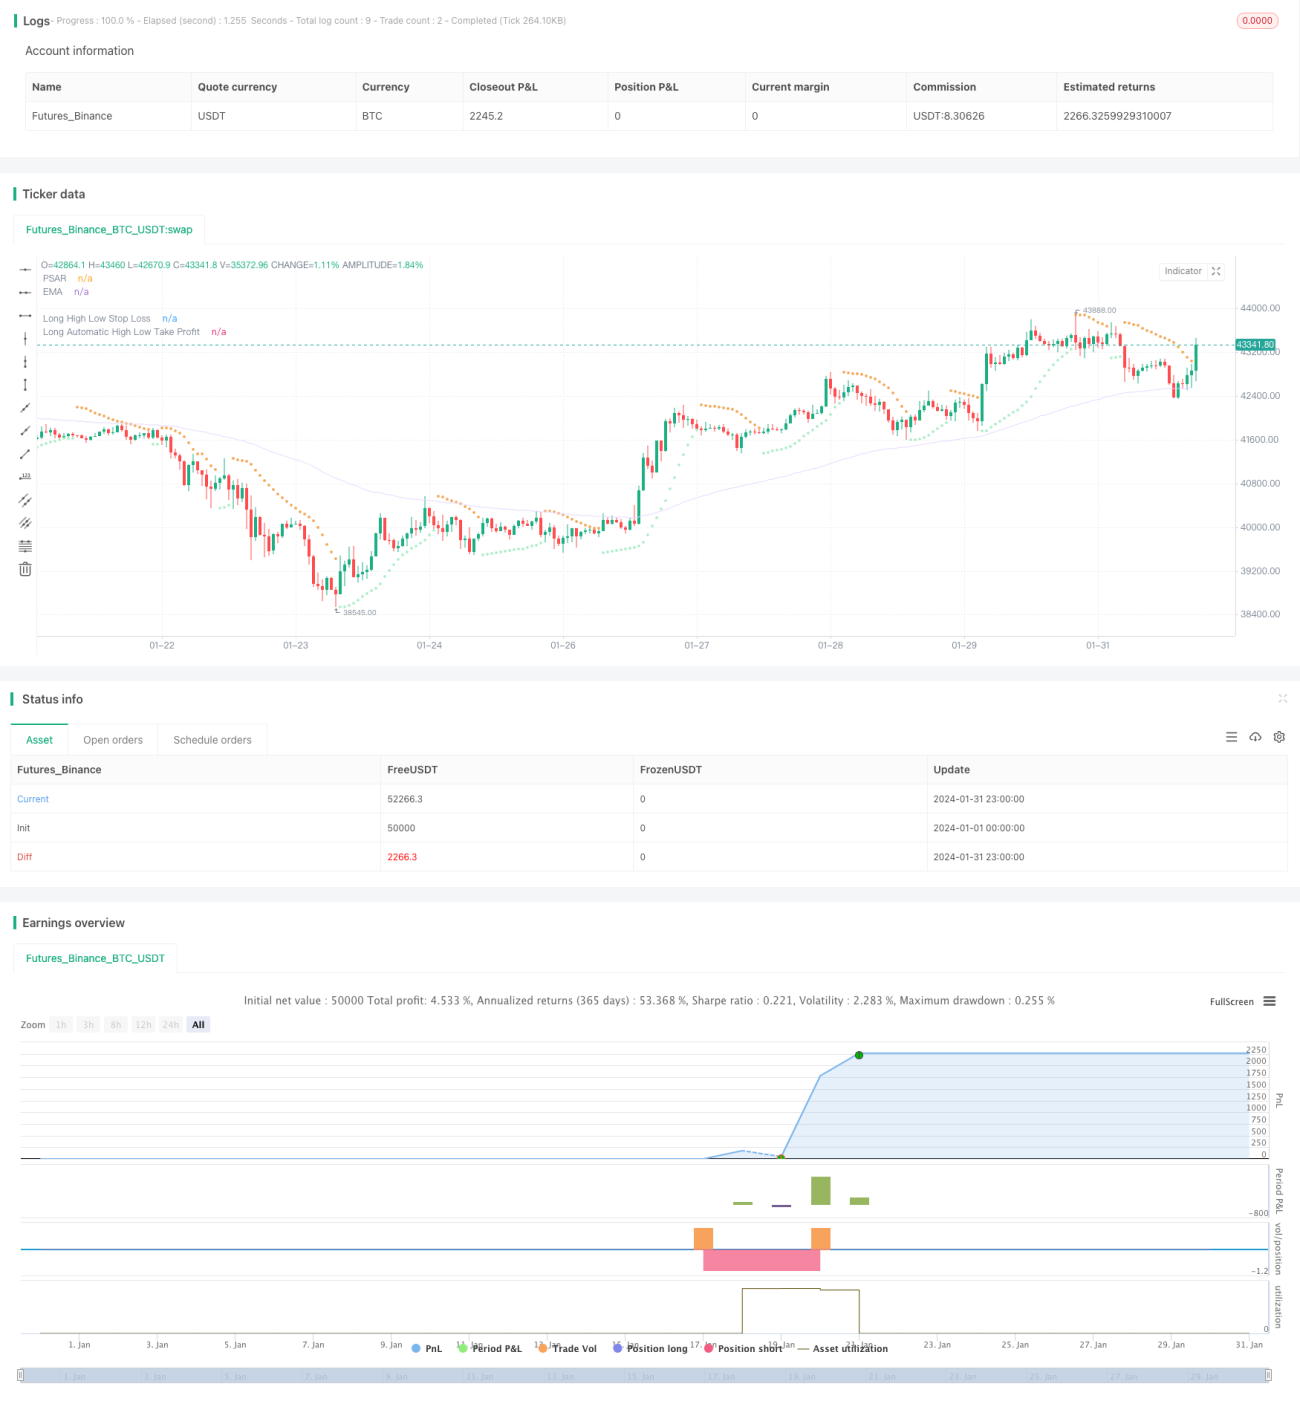
Mục đích của chiến lược này là cân bằng tâm lý và giao dịch của các nhà giao dịch để có được lợi nhuận ổn định hơn bằng cách thiết lập các tham số khác nhau. Nó sử dụng các chỉ số như đường trung bình, dải Brin, kênh Keltner để đánh giá xu hướng và biến động của thị trường, kết hợp với chỉ số PSAR để đánh giá tín hiệu đảo ngược, sử dụng chỉ số TTM để đánh giá động lực.
Lý luận chính của chiến lược này là:
Xác định xu hướng: sử dụng đường trung bình EMA để xác định xu hướng của giá, giá trên EMA là tăng, dưới là giảm
Phản hồi giá trị: Sử dụng PSAR để xác định điểm đảo ngược giá. Các điểm PSAR xuất hiện ở trên giá là tín hiệu lạc quan và xuất hiện ở dưới giá là tín hiệu giảm giá
Đánh giá động lượng: Sử dụng chỉ số TTM Squeeze để đánh giá tỷ lệ biến động và động lượng của thị trường. Chỉ số TTM Squeeze đo lường tỷ lệ biến động bằng cách so sánh chiều rộng của băng tần Brin và kênh Keltner.
Tạo tín hiệu giao dịch: Khi giá vượt qua đường trung bình EMA, điểm PSAR, và chỉ số TTM Squeeze thoát khỏi áp lực, tạo tín hiệu xem nhiều; Khi giá vượt qua đường trung bình EMA, điểm PSAR, và chỉ số TTM Squeeze vào áp lực, tạo tín hiệu xem trống
Phương pháp dừng lỗ: sử dụng điểm dừng cao thấp. Đặt số nhân là điểm dừng lỗ dựa trên giá cao nhất hoặc giá thấp nhất trong một chu kỳ nhất định gần đây
Phương pháp dừng: sử dụng rủi ro lợi nhuận so với dừng tự động. Đạt điểm dừng dựa trên tỷ lệ khoảng cách dừng từ giá hiện tại nhân với tham số rủi ro lợi nhuận so với tham số được thiết lập
Thông qua các thiết lập tham số, bạn có thể kiểm soát tần suất giao dịch, quản lý vị trí, điểm dừng lỗ và điểm dừng, cân bằng tâm lý giao dịch.
Chiến lược này có những ưu điểm sau:
Đánh giá đa chỉ số, tăng độ chính xác tín hiệu
Chuyển đổi chủ yếu, chuyển tiếp là phụ, nắm bắt điểm đảo ngược, giảm khả năng đâm lên, hạ xuống, hạ xuống.
Chỉ số TTMSqueeze có thể đánh giá hiệu quả sự điều chỉnh trong xu hướng, tránh giao dịch không có hiệu lực trong thời gian điều chỉnh
Phương pháp dừng cao và thấp rất đơn giản, có thể điều chỉnh khoảng cách dừng tùy theo thị trường
Phương pháp chiết khấu rủi ro so với lợi nhuận sẽ số hóa tỷ lệ lợi nhuận, giúp điều chỉnh
Cài đặt các tham số linh hoạt, có thể được điều chỉnh theo sở thích rủi ro cá nhân
Chiến lược này cũng có những rủi ro sau:
Kết hợp nhiều chỉ số, mặc dù tăng độ chính xác của tín hiệu, nhưng cũng làm tăng khả năng vượt qua điểm Entry
Chiến lược chủ yếu là đảo ngược, có thể không hoạt động tốt trong tình huống xu hướng
Giới hạn cao và thấp đôi khi bị phá vỡ, không thể tránh được rủi ro hoàn toàn
RSI có thể bị mất hiệu lực do giá tăng hoặc điều chỉnh
Thiết lập tham số không đúng có thể gây ra lỗ hoặc ngừng hoạt động thường xuyên
Chiến lược này có thể được tối ưu hóa bằng cách:
Thêm hoặc điều chỉnh trọng lượng chỉ số để tín hiệu chính xác hơn
Tối ưu hóa các tham số chỉ số để đánh giá xu hướng và xu hướng, tăng khả năng lợi nhuận
Tối ưu hóa các tham số dừng cao và thấp để làm cho dừng hợp lý hơn
Kiểm tra các tỷ lệ lợi nhuận rủi ro khác nhau để đạt được kết quả tối ưu
Điều chỉnh các tham số số vị trí để giảm tác động của tổn thất đơn lẻ
Nhìn chung, chiến lược này có thể cân bằng tâm lý giao dịch một cách hiệu quả và thu được lợi nhuận tích cực ổn định thông qua các phán đoán và điều chỉnh tham số của bộ chỉ số. Mặc dù vẫn còn một số không gian cải tiến, nhưng nó có giá trị ứng dụng thực tế. Thông qua phản hồi của thị trường và điều chỉnh tham số, chiến lược này có khả năng trở thành một công cụ hiệu quả để kiểm soát tâm lý giao dịch và thu được lợi nhuận ổn định lâu dài.
/*backtest
start: 2024-01-01 00:00:00
end: 2024-01-31 23:59:59
period: 1h
basePeriod: 15m
exchanges: [{"eid":"Futures_Binance","currency":"BTC_USDT"}]
*/
//@version=5
// This source code is subject to the terms of the Mozilla Public License 2.0 at https://mozilla.org/MPL/2.0/
// © simwai
strategy('Octopus Nest Strategy 🐙', shorttitle='🐙', overlay=true )
// -- Colors --
color maximumYellowRed = color.rgb(255, 203, 98) // yellow
color rajah = color.rgb(242, 166, 84) // orange
color magicMint = color.rgb(171, 237, 198)
color languidLavender = color.rgb(232, 215, 255)
color maximumBluePurple = color.rgb(181, 161, 226)
color skyBlue = color.rgb(144, 226, 244)
color lightGray = color.rgb(214, 214, 214)
color quickSilver = color.rgb(163, 163, 163)
color mediumAquamarine = color.rgb(104, 223, 153)
color carrotOrange = color.rgb(239, 146, 46)
// -- Inputs --
float src = input.source(close, 'Choose Source', group='General', inline='1')
bool isSignalLabelEnabled = input.bool(title='Show Signal Labels?', defval=true, group='General', inline='2')
bool isPsarAdaptive = input.bool(title='Is PSAR Adaptive?', defval=false, group='General', inline='2')
float highLowStopLossMultiplier = input.float(defval=0.98, step=0.01, minval=0, maxval=1, title='Multiplier', group='High Low Stop Loss', inline='1')
float highLowStopLossBackupMultiplier = input.float(defval=0.98, step=0.01, minval=0, maxval=1, title='Backup Multiplier', group='High Low Stop Loss', inline='1')
int highLowStopLossLookback = input.int(defval=20, step=5, minval=1, title='Lookback', group='High Low Stop Loss', inline='2')
float automaticHighLowTakeProfitRatio = input.float(defval=1.125, step=0.1, minval=0, title='Risk Reward Ratio', group='Automatic High Low Take Profit', inline='2')
int emaLength = input.int(100, minval=2, title='Length', group='EMA', inline='1')
int ttmLength = input.int(title='Length', defval=20, minval=0, group='TTM Squeeze', inline='1')
float psarStart = input.float(0.02, 'Start', step=0.01, minval=0.0, group='PSAR', inline='1')
float psarInc = input.float(0.02, 'Increment', step=0.01, minval=0.01, group='PSAR', inline='1')
float psarMax = input.float(0.2, 'Max', step=0.05, minval=0.0, group='PSAR', inline='2')
startAFactor = input.float(0.02, 'Starting Acceleration Factor', step = 0.001, group='Adaptive PSAR', inline='1')
minStep = input.float(0.0, 'Min Step', step = 0.001, group='Adaptive PSAR', inline='1')
maxStep = input.float(0.02, 'Max Step', step = 0.001, group='Adaptive PSAR', inline='2')
maxAFactor = input.float(0.2, 'Max Acceleration Factor', step = 0.001, group='Adaptive PSAR', inline='2')
hiloMode = input.string('On', 'HiLo Mode', options = ['Off', 'On'], group='Adaptive PSAR')
adaptMode = input.string('Kaufman', 'Adaptive Mode', options = ['Off', 'Kaufman', 'Ehlers'], group='Adaptive PSAR')
adaptSmth = input.int(5, 'Adaptive Smoothing Period', minval = 1, group='Adaptive PSAR')
filt = input.float(0.0, 'Filter in Pips', group='Adaptive PSAR', minval = 0)
minChng = input.float(0.0, 'Min Change in Pips', group='Adaptive PSAR', minval = 0)
SignalMode = input.string('Only Stops', 'Signal Mode', options = ['Only Stops', 'Signals & Stops'], group='Adaptive PSAR')
// -- Functions --
tr(_high, _low, _close) => math.max(_high - _low, math.abs(_high - _close[1]), math.abs(_low - _close[1]))
// -- Calculation --
var string lastTrade = 'initial'
float _low = low
float _high = high
float _close = close
// -- TTM Squeeze – Credits to @Greeny --
bband(ttmLength, mult) =>
ta.sma(src, ttmLength) + mult * ta.stdev(src, ttmLength)
keltner(ttmLength, mult) =>
ta.ema(src, ttmLength) + mult * ta.ema(tr(_high, _low, _close), ttmLength)
e1 = (ta.highest(_high, ttmLength) + ta.lowest(_low, ttmLength)) / 2 + ta.sma(src, ttmLength)
osc = ta.linreg(src - e1 / 2, ttmLength, 0)
diff = bband(ttmLength, 2) - keltner(ttmLength, 1)
osc_color = osc[1] < osc[0] ? osc[0] >= 0 ? #00ffff : #cc00cc : osc[0] >= 0 ? #009b9b : #ff9bff
mid_color = diff >= 0 ? color.green : color.red
// -- PSAR --
// Credits to @Bjorgum
calcBaseUnit() =>
bool isForexSymbol = syminfo.type == 'forex'
bool isYenPair = syminfo.currency == 'JPY'
float result = isForexSymbol ? isYenPair ? 0.01 : 0.0001 : syminfo.mintick
// Credits to @loxx
_afact(mode,input, per, smooth) =>
eff = 0., seff = 0.
len = 0, sum = 0., max = 0., min = 1000000000.
len := mode == 'Kaufman' ? math.ceil(per) : math.ceil(math.max(20, 5 * per))
for i = 0 to len
if (mode == 'Kaufman')
sum += math.abs(input[i] - input[i + 1])
else
max := input[i] > max ? input[i] : max
min := input[i] < min ? input[i] : min
if (mode == 'Kaufman' and sum != 0)
eff := math.abs(input - input[len]) / sum
else
if (mode == 'Ehlers' and (max - min) > 0)
eff := (input - min) / (max - min)
seff := ta.ema(eff, smooth)
seff
hVal2 = nz(high[2]), hVal1 = nz(high[1]), hVal0 = high
lowVal2 = nz(low[2]), lowVal1 = nz(low[1]), lowVal0 = low
hiprice2 = nz(high[2]), hiprice1 = nz(high[1]), hiprice0 = high
loprice2 = nz(low[2]), loprice1 = nz(low[1]), loprice0 = low
upSig = 0., dnSig = 0.
aFactor = 0., step = 0., trend = 0.
upTrndSAR = 0., dnTrndSAR = 0.
length = (2 / maxAFactor - 1)
if (hiloMode == 'On')
hiprice0 := high
loprice0 := low
else
hiprice0 := src
loprice0 := hiprice0
if bar_index == 1
trend := 1
hVal1 := hiprice1
hVal0 := math.max(hiprice0, hVal1)
lowVal1 := loprice1
lowVal0 := math.min(loprice0, lowVal1)
aFactor := startAFactor
upTrndSAR := lowVal0
dnTrndSAR := 0.
else
hVal0 := hVal1
lowVal0 := lowVal1
trend := nz(trend[1])
aFactor := nz(aFactor[1])
inputs = 0.
inprice = src
if (adaptMode != 'Off')
if (hiloMode == 'On')
inprice := src
else
inprice := hiprice0
if (adaptMode == 'Kaufman')
inputs := inprice
else
if (adaptMode == 'Ehlers')
if (nz(upTrndSAR[1]) != 0.)
inputs := math.abs(inprice - nz(upTrndSAR[1]))
else
if (nz(dnTrndSAR[1]) != 0.)
inputs := math.abs(inprice - nz(dnTrndSAR[1]))
step := minStep + _afact(adaptMode, inputs, length, adaptSmth) * (maxStep - minStep)
else
step := maxStep
upTrndSAR := 0., dnTrndSAR := 0., upSig := 0., dnSig := 0.
if (nz(trend[1]) > 0)
if (nz(trend[1]) == nz(trend[2]))
aFactor := hVal1 > hVal2 ? nz(aFactor[1]) + step : aFactor
aFactor := aFactor > maxAFactor ? maxAFactor : aFactor
aFactor := hVal1 < hVal2 ? startAFactor : aFactor
else
aFactor := nz(aFactor[1])
upTrndSAR := nz(upTrndSAR[1]) + aFactor * (hVal1 - nz(upTrndSAR[1]))
upTrndSAR := upTrndSAR > loprice1 ? loprice1 : upTrndSAR
upTrndSAR := upTrndSAR > loprice2 ? loprice2 : upTrndSAR
else
if (nz(trend[1]) == nz(trend[2]))
aFactor := lowVal1 < lowVal2 ? nz(aFactor[1]) + step : aFactor
aFactor := aFactor > maxAFactor ? maxAFactor : aFactor
aFactor := lowVal1 > lowVal2 ? startAFactor : aFactor
else
aFactor := nz(aFactor[1])
dnTrndSAR := nz(dnTrndSAR[1]) + aFactor * (lowVal1 - nz(dnTrndSAR[1]))
dnTrndSAR := dnTrndSAR < hiprice1 ? hiprice1 : dnTrndSAR
dnTrndSAR := dnTrndSAR < hiprice2 ? hiprice2 : dnTrndSAR
hVal0 := hiprice0 > hVal0 ? hiprice0 : hVal0
lowVal0 := loprice0 < lowVal0 ? loprice0 : lowVal0
if (minChng > 0)
if (upTrndSAR - nz(upTrndSAR[1]) < minChng * calcBaseUnit() and upTrndSAR != 0. and nz(upTrndSAR[1]) != 0.)
upTrndSAR := nz(upTrndSAR[1])
if (nz(dnTrndSAR[1]) - dnTrndSAR < minChng * calcBaseUnit() and dnTrndSAR != 0. and nz(dnTrndSAR[1]) != 0.)
dnTrndSAR := nz(dnTrndSAR[1])
dnTrndSAR := trend < 0 and dnTrndSAR > nz(dnTrndSAR[1]) ? nz(dnTrndSAR[1]) : dnTrndSAR
upTrndSAR := trend > 0 and upTrndSAR < nz(upTrndSAR[1]) ? nz(upTrndSAR[1]) : upTrndSAR
if (trend < 0 and hiprice0 >= dnTrndSAR + filt * calcBaseUnit())
trend := 1
upTrndSAR := lowVal0
upSig := SignalMode == 'Signals & Stops' ? lowVal0 : upSig
dnTrndSAR := 0.
aFactor := startAFactor
lowVal0 := loprice0
hVal0 := hiprice0
else if (trend > 0 and loprice0 <= upTrndSAR - filt * calcBaseUnit())
trend := -1
dnTrndSAR := hVal0
dnSig := SignalMode == 'Signals & Stops' ? hVal0 : dnSig
upTrndSAR := 0.
aFactor := startAFactor
lowVal0 := loprice0
hVal0 := hiprice0
psar = upTrndSAR > 0 ? upTrndSAR : dnTrndSAR
psar := isPsarAdaptive ? psar : ta.sar(psarStart, psarInc, psarMax)
plot(psar, title='PSAR', color=src < psar ? rajah : magicMint, style=plot.style_circles)
// -- EMA --
float ema = ta.ema(src, emaLength)
plot(ema, title='EMA', color=languidLavender)
// -- Signals --
var string isTradeOpen = ''
var string signalCache = ''
bool enterLong = src > ema and ta.crossover(src, psar) and ta.crossover(osc, 0)
bool enterShort = src < ema and ta.crossunder(src, psar) and ta.crossunder(osc, 0)
// bool exitLong = ta.crossunder(src, ema)
// bool exitShort = ta.crossover(src, ema)
if (signalCache == 'long entry')
signalCache := ''
enterLong := true
else if (signalCache == 'short entry')
signalCache := ''
enterShort := true
if (isTradeOpen == '')
if (enterLong)
isTradeOpen := 'long'
else if (enterShort)
isTradeOpen := 'short'
else if (isTradeOpen == 'long')
if (enterLong)
enterLong := false
else if (isTradeOpen == 'short')
if (enterShort)
enterShort := false
plotshape((isSignalLabelEnabled and enterLong and (isTradeOpen == 'long')) ? psar : na, title='LONG', text='L', style=shape.labelup, color=mediumAquamarine, textcolor=color.white, size=size.tiny, location=location.absolute)
plotshape((isSignalLabelEnabled and enterShort and (isTradeOpen == 'short')) ? psar : na, title='SHORT', text='S', style=shape.labeldown, color=carrotOrange, textcolor=color.white, size=size.tiny, location=location.absolute)
// -- High Low Stop Loss and Take Profit --
bool isHighLowStopLossEnabled = true
bool isAutomaticHighLowTakeProfitEnabled = true
bool recalculateStopLossTakeProfit = false
bool isStrategyEntryEnabled = false
bool isLongEnabled = true
bool isShortEnabled = true
bool isStopLossTakeProfitRecalculationEnabled = true
bool longStopLossTakeProfitRecalculation = isStopLossTakeProfitRecalculationEnabled ? true : (lastTrade == 'short' or lastTrade == 'initial')
bool shortStopLossTakeProfitRecalculation = isStopLossTakeProfitRecalculationEnabled ? true : (lastTrade == 'long' or lastTrade == 'initial')
var float longHighLowStopLoss = 0
var float shortHighLowStopLoss = 0
float highLowStopLossLowest = ta.lowest(_low, highLowStopLossLookback)
float highLowStopLossHighest = ta.highest(_high, highLowStopLossLookback)
if (isHighLowStopLossEnabled)
if (((enterLong and longStopLossTakeProfitRecalculation) or recalculateStopLossTakeProfit) and (isStrategyEntryEnabled ? not(strategy.position_size > 0) : true))
if (highLowStopLossLowest == _low)
longHighLowStopLoss := _high * highLowStopLossBackupMultiplier
else if (highLowStopLossLowest > 0)
longHighLowStopLoss := highLowStopLossLowest * highLowStopLossMultiplier
if (((enterShort and shortStopLossTakeProfitRecalculation) or recalculateStopLossTakeProfit) and (isStrategyEntryEnabled ? not(strategy.position_size < 0) : true))
if (highLowStopLossHighest == _high)
shortHighLowStopLoss := _high * (1 + (1 - highLowStopLossBackupMultiplier))
else if (highLowStopLossHighest > 0)
shortHighLowStopLoss := highLowStopLossHighest * (1 + (1 - highLowStopLossMultiplier))
plot((isLongEnabled and isHighLowStopLossEnabled and (isTradeOpen == 'long')) ? longHighLowStopLoss : na, 'Long High Low Stop Loss', color=magicMint, style=plot.style_circles, trackprice=false)
plot((isShortEnabled and isHighLowStopLossEnabled and (isTradeOpen == 'short')) ? shortHighLowStopLoss : na, 'Short High Low Stop Loss ', color=rajah, style=plot.style_circles, trackprice=false)
// -- Automatic High Low Take Profit --
var float longAutomaticHighLowTakeProfit = na
var float shortAutomaticHighLowTakeProfit = na
if (isAutomaticHighLowTakeProfitEnabled)
if (((enterLong and longStopLossTakeProfitRecalculation) or recalculateStopLossTakeProfit) and (isStrategyEntryEnabled ? not(strategy.position_size > 0) : true))
longHighLowStopLossPercentage = 1 - (longHighLowStopLoss / _close)
longAutomaticHighLowTakeProfit := _close * (1 + (longHighLowStopLossPercentage * automaticHighLowTakeProfitRatio))
if (((enterShort and shortStopLossTakeProfitRecalculation) or recalculateStopLossTakeProfit) and (isStrategyEntryEnabled ? not(strategy.position_size > 0) : true))
shortHighLowStopLossPercentage = 1 - (_close / shortHighLowStopLoss)
shortAutomaticHighLowTakeProfit := _close * (1 - (shortHighLowStopLossPercentage * automaticHighLowTakeProfitRatio))
plot((isAutomaticHighLowTakeProfitEnabled and isHighLowStopLossEnabled and (isTradeOpen == 'long')) ? longAutomaticHighLowTakeProfit : na, 'Long Automatic High Low Take Profit', color=magicMint, style=plot.style_circles, trackprice=false)
plot((isAutomaticHighLowTakeProfitEnabled and isHighLowStopLossEnabled and (isTradeOpen == 'short')) ? shortAutomaticHighLowTakeProfit : na, 'Short Automatic High Low Take Profit', color=rajah, style=plot.style_circles, trackprice=false)
// log.info('Automatic Long High Low Take Profit: ' + str.tostring(longAutomaticHighLowTakeProfit))
// log.info('Automatic Short High Low Take Profit: ' + str.tostring(shortAutomaticHighLowTakeProfit))
// log.info('Long High Low Stop Loss: ' + str.tostring(longHighLowStopLoss))
// log.info('Short High Low Stop Loss: ' + str.tostring(shortHighLowStopLoss))
bool longHighLowStopLossCondition = ta.crossunder(_close, longHighLowStopLoss)
bool shortHighLowStopLossCondition = ta.crossover(_close, shortHighLowStopLoss)
bool longAutomaticHighLowTakeProfitCondition = ta.crossover(_close, longAutomaticHighLowTakeProfit)
bool shortAutomaticHighLowTakeProfitCondition = ta.crossunder(_close, shortAutomaticHighLowTakeProfit)
bool exitLong = (longHighLowStopLossCondition or longAutomaticHighLowTakeProfitCondition) and strategy.position_size > 0
bool exitShort = (shortHighLowStopLossCondition or shortAutomaticHighLowTakeProfitCondition) and strategy.position_size < 0
plotshape((isSignalLabelEnabled and exitLong and (isTradeOpen == 'long')) ? psar : na, title='LONG EXIT', style=shape.circle, color=magicMint, size=size.tiny, location=location.absolute)
plotshape((isSignalLabelEnabled and exitShort and (isTradeOpen == 'short')) ? psar : na, title='SHORT EXIT', style=shape.circle, color=rajah, size=size.tiny, location=location.absolute)
// Long Exits
if (exitLong)
strategy.close('long', comment=longAutomaticHighLowTakeProfitCondition ? 'EXIT_LONG_TP' : 'EXIT_LONG_SL')
isTradeOpen := ''
// Short Exits
if (exitShort)
strategy.close('short', comment=shortAutomaticHighLowTakeProfitCondition ? 'EXIT_SHORT_TP' : 'EXIT_SHORT_SL')
isTradeOpen := ''
// Long Entries
if (enterLong and (strategy.position_size == 0))
strategy.entry('long', strategy.long, comment='ENTER_LONG')
// Short Entries
if (enterShort and (strategy.position_size == 0))
strategy.entry('short', strategy.short, comment='ENTER_SHORT')
// Save last trade state
if (enterLong or exitLong)
lastTrade := 'long'
if (enterShort or exitShort)
lastTrade := 'short'
barcolor(color=isTradeOpen == 'long' ? mediumAquamarine : isTradeOpen == 'short' ? carrotOrange : na)