Chiến lược theo xu hướng Ichimoku Kinko Hyo

Tổng quan
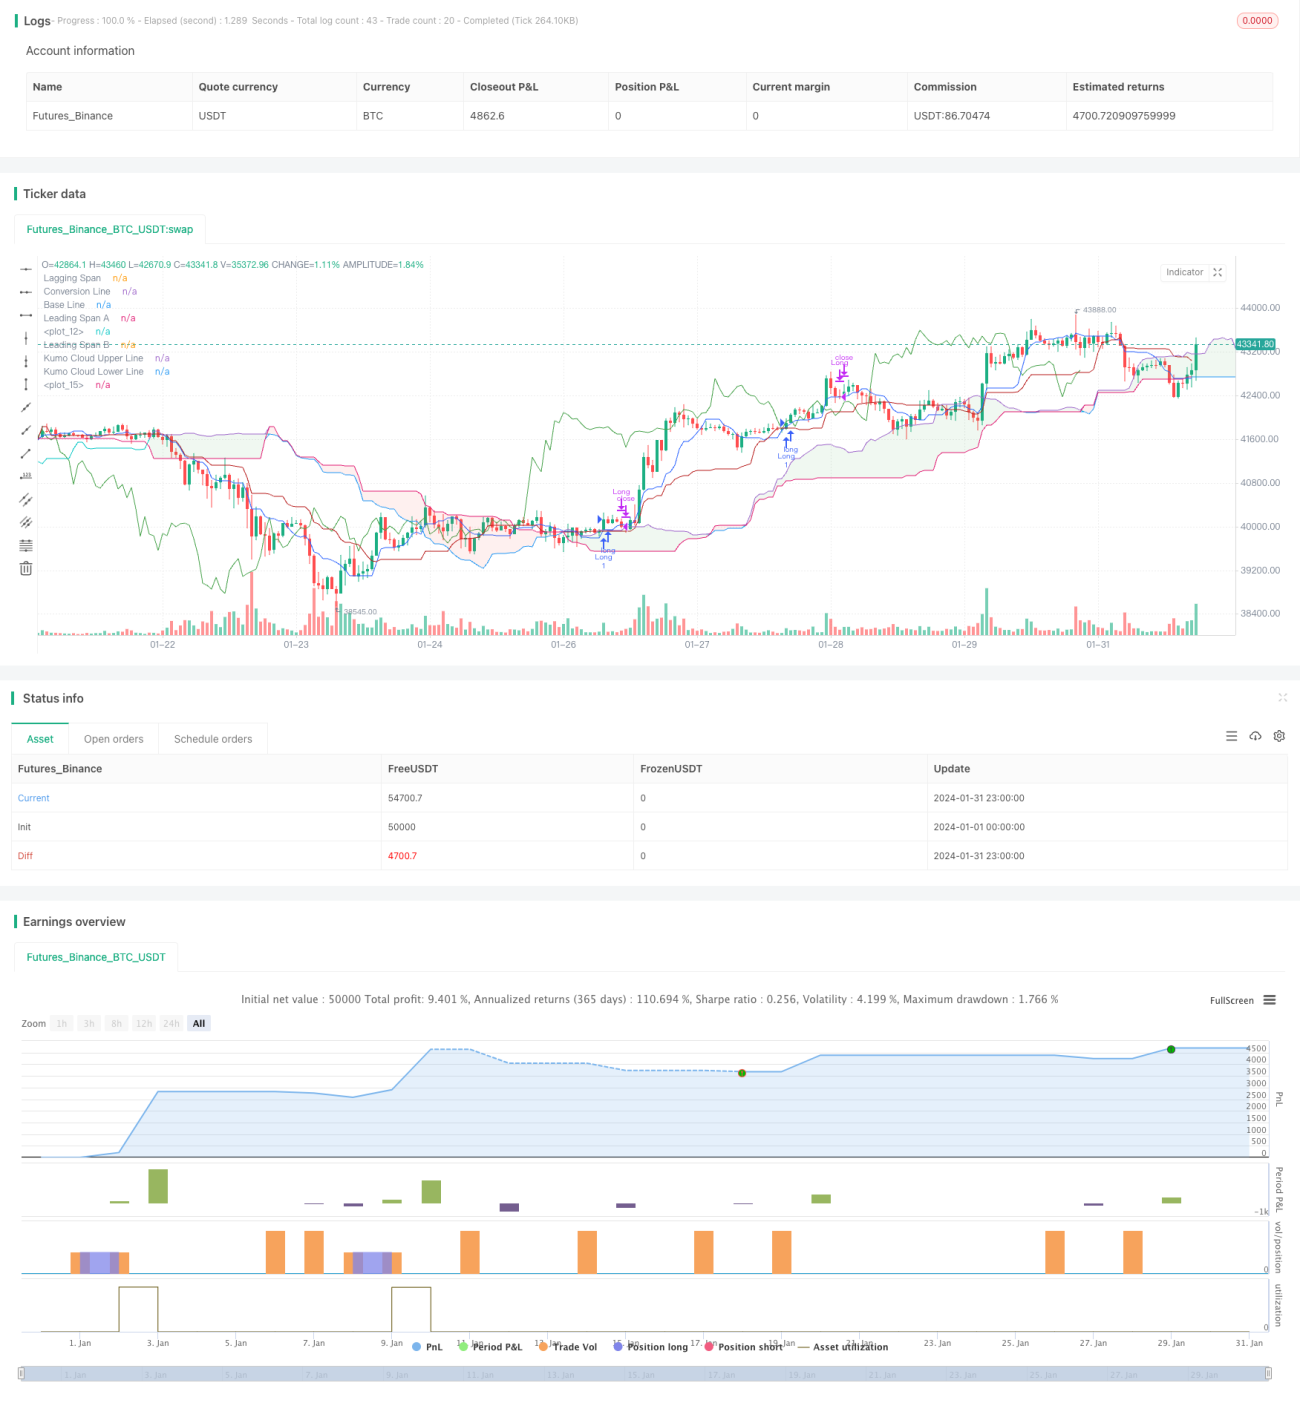
Chiến lược theo dõi xu hướng trên biểu đồ cân bằng bằng mắt (Ichimoku Cloud Trend Following Strategy) là một chiến lược phân tích kỹ thuật. Nó sử dụng năm đường chỉ số trên biểu đồ cân bằng bằng mắt để đánh giá xu hướng thị trường, hỗ trợ mức kháng cự và thời gian vào sân.
Nguyên tắc
Các chỉ số cốt lõi của chiến lược bao gồm:
- Đường chuyển đổi: trung bình của mức cao và thấp trong 9 ngày gần đây, phản ánh xu hướng ngắn hạn.
- Đường chuẩn: Đường trung bình của các điểm cao và thấp trong 26 ngày gần đây, phản ánh xu hướng trung và dài hạn.
- Đường dẫn A: giá trị trung bình của đường chuyển đổi so với đường chuẩn, di chuyển 26 ngày, đánh giá giá trị hỗ trợ và kháng cự trung hạn.
- Dòng B: Đường trung bình của 52 ngày cao và thấp gần đây, di chuyển 26 ngày, đánh giá hỗ trợ và kháng cự dài hạn.
- Đường ngẫu nhiên: Giá chuyển vị trí vào ngày 26, phản ánh xu hướng.
Đường chuyển đổi trên đường đi qua đường chuẩn là tín hiệu mua; đường đi xuống là tín hiệu bán. Đường đi theo nằm trên giá và màu sắc của đám mây là màu xanh lá cây cho xu hướng đa đầu, nếu không thì là đầu không.
Chiến lược đánh giá xu hướng dựa trên mối quan hệ giữa đường chuyển đổi và đường chuẩn. Ví dụ: đường chuyển đổi vượt qua đường chuẩn sẽ được đánh giá là nhập vào nhiều đầu, và nếu đáp ứng điều kiện đường tự động cao hơn giá, nó sẽ tạo ra tín hiệu mua.
Hạn chế hoặc dừng dựa trên đường dẫn trước A hoặc đường chuẩn. Nếu chọn đường dẫn dừng, khi giá giảm xuống đường chuẩn.
Phân tích lợi thế
Chiến lược này có những ưu điểm sau:
- Sử dụng kết hợp nhiều chỉ số để tăng độ chính xác.
- Dòng đi trước có thể đoán trước được hỗ trợ và kháng cự.
- Đường chuyển động ngẫu nhiên xác minh động lực xu hướng, ngăn chặn phá vỡ giả.
- Dòng chuẩn được sử dụng như một chỉ số xu hướng trung và dài hạn, có thể làm giảm tiếng ồn giao dịch.
Rủi ro và tối ưu hóa
Tuy nhiên, một trong những rủi ro chính của chiến lược này là nó dễ tạo ra các tín hiệu giả.
- Điều chỉnh tham số chu kỳ trung bình, tối ưu hóa độ nhạy của chỉ số.
- Thêm các chỉ số hoặc bộ lọc đồ họa khác, chẳng hạn như MACD, Brinband.
- Giảm tần suất giao dịch, theo dõi xu hướng đường dài.
Tóm tắt
Chiến lược cân bằng một mắt tổng hợp nhiều chỉ số để đánh giá xu hướng thị trường, xem xét cả động lực ngắn hạn và tập trung vào xu hướng trung và dài hạn. Mối quan hệ giữa đường chuyển đổi và đường chuẩn để đánh giá thời gian mua và bán thị trường, đường chuẩn làm đường dừng lỗ để khóa lợi nhuận, có thể kiểm soát rủi ro hiệu quả. Chiến lược này phù hợp với giao dịch theo dõi xu hướng trung và dài hạn.
/*backtest
start: 2024-01-01 00:00:00
end: 2024-01-31 23:59:59
period: 1h
basePeriod: 15m
exchanges: [{"eid":"Futures_Binance","currency":"BTC_USDT"}]
*/

//@version=5
strategy(title="Ichimoku Cloud - BitBell", shorttitle="Ichimoku Cloud - BitBell", overlay=true)
conversionPeriods = input.int(9, minval=1, title="Conversion Line Length")
basePeriods = input.int(26, minval=1, title="Base Line Length")- 1