Dựa trên chiến lược xu hướng nhấn chìm động
Tổng quan
Chiến lược xu hướng ăn động là một chiến lược giao dịch theo hướng xu hướng dựa trên hình dạng ăn. Chiến lược này sử dụng phạm vi biến động thực tế trung bình ((ATR) để xác định sự biến động của thị trường, chỉ số xu hướng siêu để xác định hướng xu hướng thị trường, thực hiện nhiều hoạt động rút ngắn khi phù hợp với hình dạng ăn và phù hợp với hướng xu hướng.
Nguyên tắc chiến lược
- Tính toán ATR để đo lường sự biến động của thị trường.
- Tính toán các chỉ số siêu xu hướng để đánh giá xu hướng chính của thị trường.
- Xác định các điều kiện thị trường đa đầu và thị trường trống.
- Xác định hình thức ăn nhiều đầu ((trong xu hướng tăng) và ăn trần ((trong xu hướng giảm) phù hợp với hướng xu hướng.
- Stop Loss và Stop Out được tính theo hình thức ăn.
- Khi nhận ra hình thức ăn và phù hợp với xu hướng, thực hiện hành động thêm hoặc làm trống.
- Khi giá chạm mức dừng lỗ hoặc dừng, hãy đặt lệnh thanh toán.
- Đánh dấu hình dạng nuốt trên biểu đồ.
Phân tích lợi thế chiến lược
Chiến lược này có những ưu điểm sau:
- Kết hợp hình thức ăn và nhận dạng xu hướng với tín hiệu giao dịch, cải thiện chất lượng tín hiệu.
- Có thể nhận ra các điểm thay đổi trong xu hướng, hành động theo mục tiêu.
- Tạo nhiều tín hiệu trống rõ ràng hơn, dễ dàng nắm bắt thời gian hoạt động.
- Phương pháp dừng lỗ tiêu thụ theo xu hướng và kiểm soát rủi ro.
- Khung mã rõ ràng, dễ dàng tối ưu hóa và cải tiến.
Phân tích rủi ro chiến lược
Chiến lược này cũng có một số rủi ro:
- Hình thức ăn vào có thể là một đột phá giả, và nhận ra sai lầm có thể dẫn đến thiệt hại.
- Khó hiểu được các tham số hình dạng như kích thước khối lượng, thời gian, v.v.
- Cơ chế đánh giá xu hướng không hoàn hảo, có thể dẫn đến hoạt động không phù hợp với xu hướng.
- Cài đặt điểm dừng và điểm dừng phụ thuộc vào kinh nghiệm và có thể quá chủ quan.
- Hiệu quả phụ thuộc vào tối ưu hóa tham số, cần nhiều dữ liệu lịch sử để xác minh.
Những rủi ro trên có thể được kiểm soát và cải thiện bằng cách:
- Kết hợp với các chỉ số kỹ thuật khác để lọc tín hiệu đột phá giả.
- Sử dụng các phương pháp tính toán tham số vững chắc hơn, chẳng hạn như ATR tự điều chỉnh.
- Tăng độ tin cậy của cơ chế đánh giá xu hướng, chẳng hạn như giới thiệu mô hình học máy.
- Sử dụng các thuật toán di truyền và các phương tiện khác để tìm kiếm sự kết hợp tham số tối ưu.
- Đánh giá lại trong một cửa sổ thời gian dài hơn để đảm bảo tính ổn định của tham số.
Hướng tối ưu hóa chiến lược
Chiến lược này có rất nhiều khả năng tối ưu hóa:
- Có thể giới thiệu mô hình học máy để cải thiện độ chính xác của phán đoán xu hướng.
- Kết hợp với phương pháp nhận dạng hình dạng mới cải thiện hiệu quả nhận dạng hình dạng ăn.
- Tối ưu hóa điểm dừng lỗ bằng cách sử dụng các chiến lược dừng lỗ mới nhất.
- Có thể phát triển chiến lược đột phá ăn sâu dựa trên dữ liệu tần số cao phù hợp hơn với hoạt động đường ngắn.
- Có thể áp dụng cho các giống khác nhau để điều chỉnh và tối ưu hóa tham số.
Tóm tắt
Nhìn chung, chiến lược tiêu thụ xu hướng động kết hợp với định hình tiêu thụ rõ rệt và phán đoán xu hướng chính xác, tạo thành chiến lược giao dịch hợp lý. Trong quá trình ứng dụng, có thể tăng cường thêm sự ổn định và khả năng lợi nhuận của chiến lược thông qua tối ưu hóa tham số, kiểm soát rủi ro và giới thiệu công nghệ mới. Khung chiến lược rõ ràng, có tính phổ biến mạnh mẽ, đáng để nghiên cứu và ứng dụng sâu hơn.
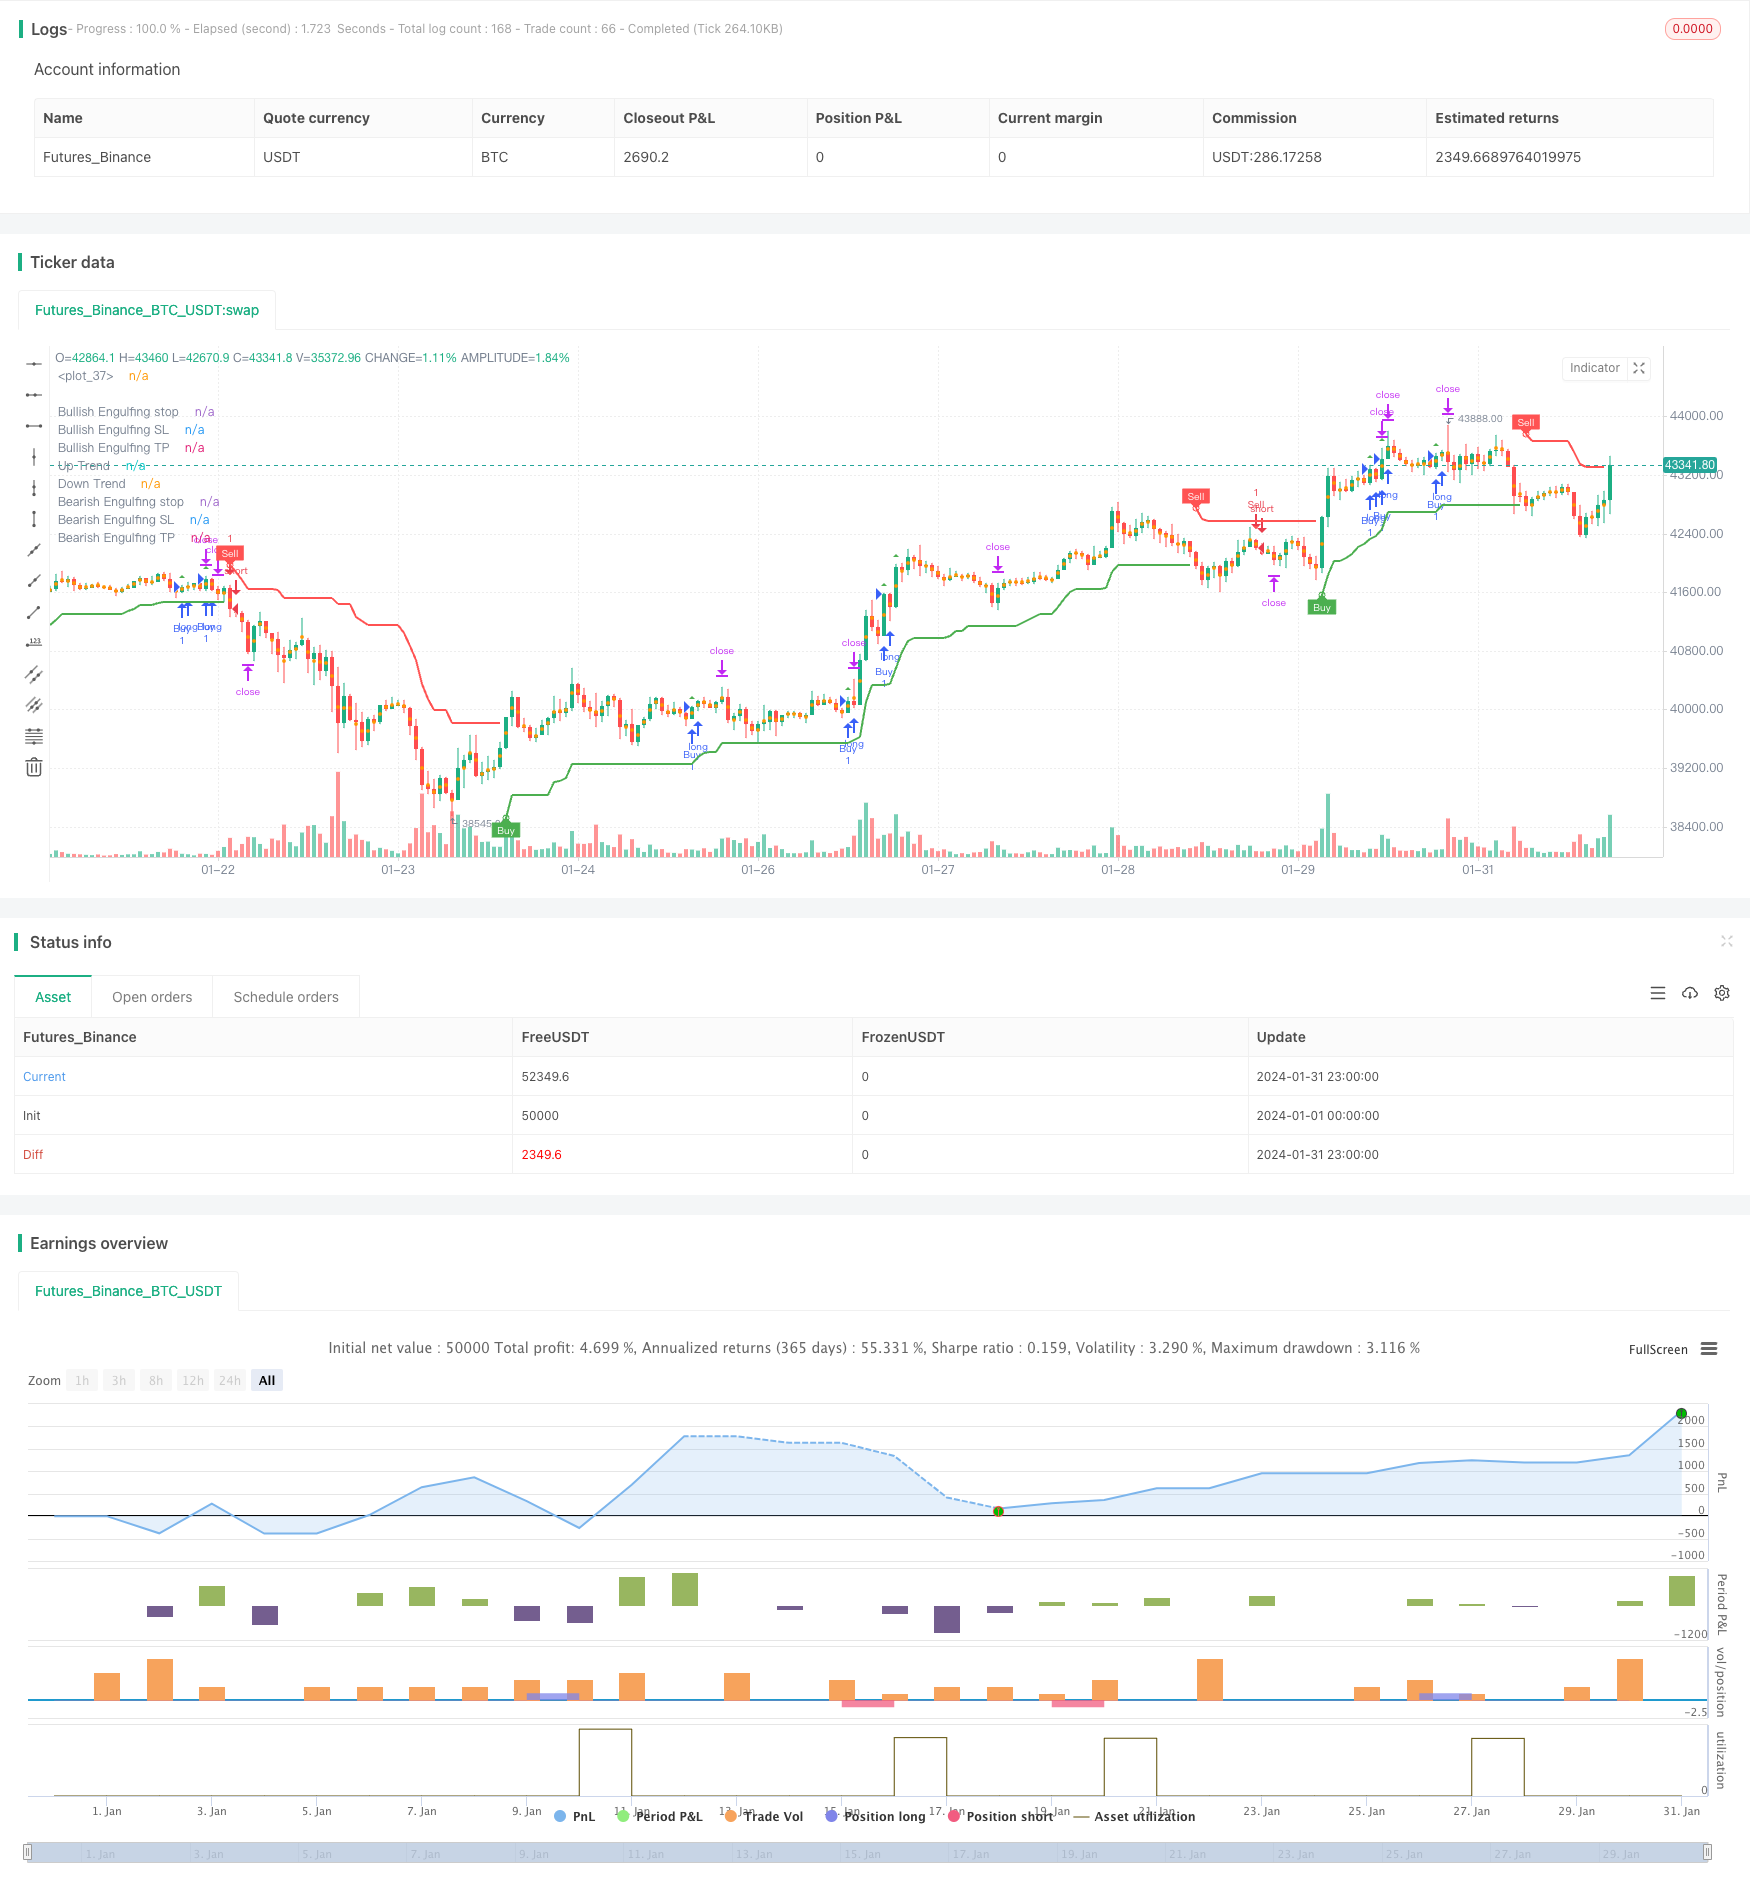
/*backtest
start: 2024-01-01 00:00:00
end: 2024-01-31 23:59:59
period: 1h
basePeriod: 15m
exchanges: [{"eid":"Futures_Binance","currency":"BTC_USDT"}]
*/

// This source code is subject to the terms of the Mozilla Public License 2.0 at https://mozilla.org/MPL/2.0/
// © Malikdrajat


//@version=4
strategy("Engulfing with Trend", overlay=true)

Periods = input(title="ATR Period", type=input.integer, defval=10)
src = input(hl2, title="Source")
Multiplier = input(title="ATR Multiplier", type=input.float, step=0.1, defval=3.0)
changeATR= input(title="Change ATR Calculation Method ?", type=input.bool, defval=true)
showsignals = input(title="Show Buy/Sell Signals ?", type=input.bool, defval=true)
highlighting = input(title="Highlighter On/Off ?", type=input.bool, defval=true)

atr2 = sma(tr, Periods)
atr= changeATR ? atr(Periods) : atr2

up=src-(Multiplier*atr)
up1 = nz(up[1],up)
up := close[1] > up1 ? max(up,up1) : up
dn=src+(Multiplier*atr)
dn1 = nz(dn[1], dn)
dn := close[1] < dn1 ? min(dn, dn1) : dn

trend = 1
trend := nz(trend[1], trend)
trend := trend == -1 and close > dn1 ? 1 : trend == 1 and close < up1 ? -1 : trend

upPlot = plot(trend == 1 ? up : na, title="Up Trend", style=plot.style_linebr, linewidth=2, color=color.green)
buySignal = trend == 1 and trend[1] == -1
plotshape(buySignal ? up : na, title="UpTrend Begins", location=location.absolute, style=shape.circle, size=size.tiny, color=color.green, transp=0)
plotshape(buySignal and showsignals ? up : na, title="Buy", text="Buy", location=location.absolute, style=shape.labelup, size=size.tiny, color=color.green, textcolor=color.white, transp=0)
dnPlot = plot(trend == 1 ? na : dn, title="Down Trend", style=plot.style_linebr, linewidth=2, color=color.red)
sellSignal = trend == -1 and trend[1] == 1
plotshape(sellSignal ? dn : na, title="DownTrend Begins", location=location.absolute, style=shape.circle, size=size.tiny, color=color.red, transp=0)
plotshape(sellSignal and showsignals ? dn : na, title="Sell", text="Sell", location=location.absolute, style=shape.labeldown, size=size.tiny, color=color.red, textcolor=color.white, transp=0)
mPlot = plot(ohlc4, title="", style=plot.style_circles, linewidth=0)
longFillColor = highlighting ? (trend == 1 ? color.green : color.white) : color.white
shortFillColor = highlighting ? (trend == -1 ? color.red : color.white) : color.white
fill(mPlot, upPlot, title="UpTrend Highligter", color=longFillColor)
fill(mPlot, dnPlot, title="DownTrend Highligter", color=shortFillColor)
alertcondition(buySignal, title="SuperTrend Buy", message="SuperTrend Buy!")
alertcondition(sellSignal, title="SuperTrend Sell", message="SuperTrend Sell!")
changeCond = trend != trend[1]
alertcondition(changeCond, title="SuperTrend Direction Change", message="SuperTrend has changed direction!")

// Define Downtrend and Uptrend conditions
downtrend = trend == -1
uptrend = trend == 1


// Engulfing
boringThreshold = input(25, title="Boring Candle Threshold (%)", minval=1, maxval=100, step=1)
engulfingThreshold = input(50, title="Engulfing Candle Threshold (%)", minval=1, maxval=100, step=1)
stopLevel = input(200, title="Stop Level (Pips)", minval=1)


// Boring Candle (Inside Bar) and Engulfing Candlestick Conditions
isBoringCandle = abs(open[1] - close[1]) * 100 / abs(high[1] - low[1]) <= boringThreshold
isEngulfingCandle = abs(open - close) * 100 / abs(high - low) <= engulfingThreshold

// Bullish and Bearish Engulfing Conditions
bullEngulfing = uptrend and close[1] < open[1] and close > open[1] and not isBoringCandle and not isEngulfingCandle
bearEngulfing = downtrend and close[1] > open[1] and close < open[1] and not isBoringCandle and not isEngulfingCandle

// Stop Loss, Take Profit, and Entry Price Calculation
bullStop = close + (stopLevel * syminfo.mintick)
bearStop = close - (stopLevel * syminfo.mintick)
bullSL = low
bearSL = high
bullTP = bullStop + (bullStop - low)
bearTP = bearStop - (high - bearStop)

// Entry Conditions
enterLong = bullEngulfing and uptrend
enterShort = bearEngulfing and downtrend

// Exit Conditions
exitLong = crossover(close, bullTP) or crossover(close, bullSL)
exitShort = crossover(close, bearTP) or crossover(close, bearSL)

// Check if exit conditions are met by the next candle
exitLongNextCandle = exitLong and (crossover(close[1], bullTP[1]) or crossover(close[1], bullSL[1]))
exitShortNextCandle = exitShort and (crossover(close[1], bearTP[1]) or crossover(close[1], bearSL[1]))

// Strategy Execution
strategy.entry("Buy", strategy.long, when=enterLong )
strategy.entry("Sell", strategy.short, when=enterShort )

// Exit Conditions for Long (Buy) Positions
if (bullEngulfing and not na(bullTP) and not na(bullSL))
    strategy.exit("Exit Long", from_entry="Buy", stop=bullSL, limit=bullTP)

// Exit Conditions for Short (Sell) Positions
if (bearEngulfing and not na(bearTP) and not na(bearSL))
    strategy.exit("Exit Short", from_entry="Sell", stop=bearSL, limit=bearTP)

// Plot Shapes and Labels
plotshape(bullEngulfing, style=shape.triangleup, location=location.abovebar, color=color.green)
plotshape(bearEngulfing, style=shape.triangledown, location=location.abovebar, color=color.red)

// Determine OP, SL, and TP
plot(bullEngulfing ? bullStop : na, title="Bullish Engulfing stop", color=color.red, linewidth=3, style=plot.style_linebr)
plot(bearEngulfing ? bearStop : na, title="Bearish Engulfing stop", color=color.red, linewidth=3, style=plot.style_linebr)
plot(bullEngulfing ? bullSL : na, title="Bullish Engulfing SL", color=color.red, linewidth=3, style=plot.style_linebr)
plot(bearEngulfing ? bearSL : na, title="Bearish Engulfing SL", color=color.red, linewidth=3, style=plot.style_linebr)
plot(bullEngulfing ? bullTP : na, title="Bullish Engulfing TP", color=color.green, linewidth=3, style=plot.style_linebr)
plot(bearEngulfing ? bearTP : na, title="Bearish Engulfing TP", color=color.green, linewidth=3, style=plot.style_linebr)