Chiến lược giao dịch BabyShark dựa trên các chỉ báo VWAP và OBV RSI
Tổng quan về chiến lược
Chiến lược giao dịch VWAP BabyShark là một chiến lược giao dịch định lượng dựa trên giá trung bình cân bằng khối lượng giao dịch ((VWAP) và chỉ số năng lượng tương đối yếu ((OBV RSI)). Chiến lược này được thiết kế để xác định tín hiệu mua và bán tiềm năng dựa trên mức độ giá lệch khỏi VWAP và OBV RSI phá vỡ ngưỡng cụ thể.
Nguyên tắc chiến lược
Nguyên tắc cốt lõi của chiến lược này là sử dụng hai chỉ số VWAP và OBV RSI để nắm bắt xu hướng và động lực thay đổi của thị trường. VWAP là một đường trung bình động dựa trên giá và khối lượng giao dịch, có thể phản ánh khu vực giao dịch chính của thị trường. Khi giá lệch đáng kể khỏi VWAP, thường có nghĩa là thị trường đã quá mua hoặc quá bán.
Cụ thể, chiến lược này sử dụng 60 đường K làm chu kỳ tính toán của VWAP và lấy giá đóng cửa làm dữ liệu đầu vào. Sau đó, xây dựng vùng mua và bán quá mức dựa trên khoảng cách từ giá đến VWAP bằng 3 điểm tiêu chuẩn. Đối với OBV RSI, sử dụng 5 đường K làm chu kỳ tính toán và đặt hai ngưỡng 70 và 30 làm tiêu chuẩn đánh giá mua và bán quá mức.
Về logic giao dịch, chiến lược sẽ phát tín hiệu nhiều khi giá nằm ở vùng bán tháo của đường mòn VWAP và OBV RSI nhỏ hơn 30; và khi giá nằm ở vùng mua quá mức của đường mòn VWAP và OBV RSI lớn hơn 70, thì sẽ phát tín hiệu hỏng. Ngoài ra, chiến lược cũng đặt tỷ lệ dừng lỗ 0,6% và giới thiệu thời gian tĩnh của đường 10K sau khi thua lỗ liên tục để kiểm soát rủi ro.
Lợi thế chiến lược
- Kết hợp nhiều yếu tố thị trường như giá cả và khối lượng giao dịch để nắm bắt toàn diện xu hướng và động lực của thị trường.
- Sử dụng chỉ số VWAP và OBV RSI động, có thể thích ứng với sự thay đổi của các chu kỳ thị trường khác nhau.
- Thiết lập tỷ lệ dừng lỗ và thời gian yên tĩnh hợp lý để kiểm soát rủi ro hiệu quả trong khi nắm bắt cơ hội.
- Logic là rõ ràng, dễ hiểu và thực hiện, và có thể giải thích được.
- Các tham số có thể được điều chỉnh, tối ưu hóa và cải tiến cho các nhà giao dịch khác nhau.
Rủi ro chiến lược
- Đối với thị trường chấn động hoặc thị trường lặp lại, tín hiệu giao dịch thường xuyên có thể dẫn đến giao dịch quá mức và chi phí trượt tăng lên.
- Trong một tình huống xu hướng, chỉ dựa vào VWAP để dừng có thể dẫn đến chiến lược thoát ra sớm và mất lợi nhuận theo xu hướng.
- Cài đặt tham số cố định có thể không thích nghi với các thay đổi trong môi trường thị trường, cần phải được tối ưu hóa cho các giống và chu kỳ khác nhau.
- Chỉ số OBV phụ thuộc mạnh vào khối lượng giao dịch, và nếu dữ liệu về khối lượng giao dịch không thực tế hoặc bị thao túng, chỉ số có thể bị sai lệch.
- Chiến lược này thiếu tính đến các yếu tố bên ngoài như kinh tế vĩ mô, tin tức, và có thể không hiệu quả khi đối mặt với các tình huống cực đoan.
Hướng tối ưu hóa
- Thêm nhiều điều kiện lọc đối với thị trường chấn động, chẳng hạn như chỉ số xác nhận xu hướng, chỉ số biến động, và giảm giao dịch thường xuyên.
- Tối ưu hóa các điều kiện ngoài sân, chẳng hạn như sử dụng dừng di động hoặc kết hợp với các chỉ số theo dõi xu hướng khác để nắm bắt tốt hơn xu hướng.
- Các tham số của VWAP và OBV RSI được tối ưu hóa thích ứng, động điều chỉnh chu kỳ tính toán và thiết lập ngưỡng.
- Giới thiệu cơ chế kiểm tra tính xác thực của giao dịch, nâng cao độ tin cậy của chỉ số OBV RSI.
- Cân nhắc thêm vào các phân tích dữ liệu kinh tế vĩ mô, các chỉ số cảm xúc và nhiều thứ khác để tăng cường khả năng thích ứng và sức mạnh của chiến lược.
Tóm tắt
Chiến lược giao dịch BabyShark VWAP là một chiến lược giao dịch định lượng kết hợp với chỉ số giá trị trung bình cân bằng khối lượng giao dịch và chỉ số xu hướng năng lượng tương đối mạnh để tạo ra tín hiệu giao dịch bằng cách nắm bắt tình trạng quá mua quá bán và sự thay đổi động lực của xu hướng trên thị trường. Chiến lược có logic rõ ràng, kết hợp nhiều yếu tố thị trường như giá cả và khối lượng giao dịch, có thể nắm bắt được xung động thị trường. Đồng thời, thiết lập dừng lỗ và cơ chế kiểm soát rủi ro hợp lý cho phép chiến lược quản lý rủi ro trong khi theo đuổi lợi nhuận.
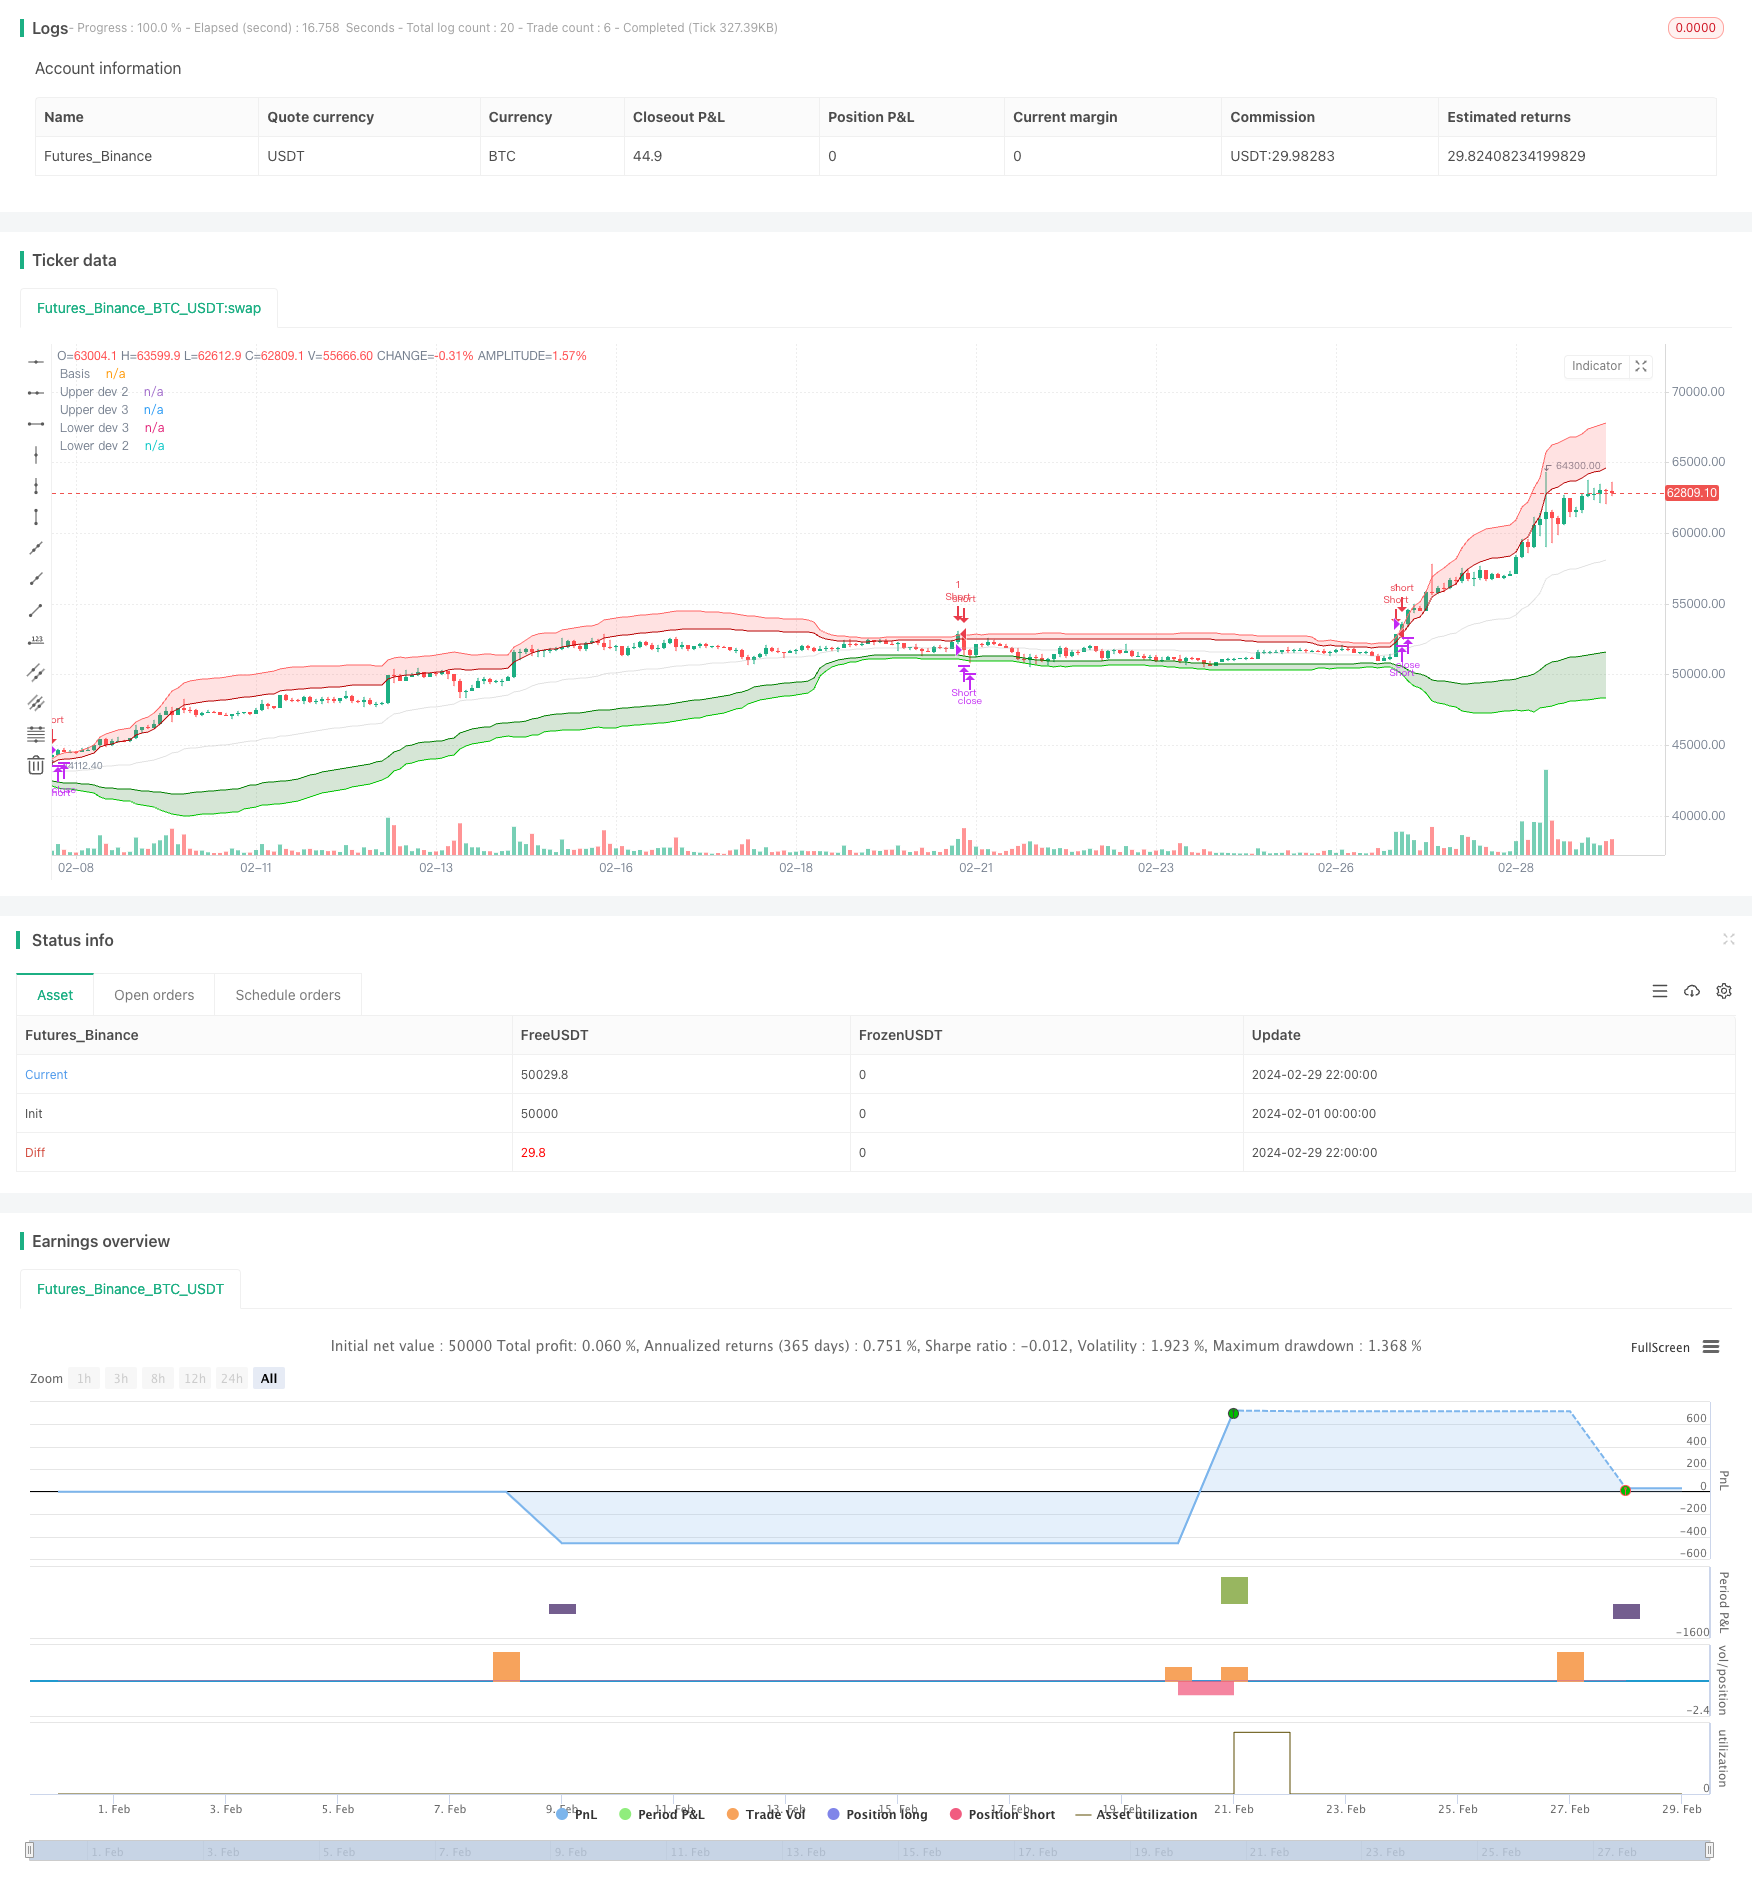
/*backtest
start: 2024-02-01 00:00:00
end: 2024-02-29 23:59:59
period: 2h
basePeriod: 15m
exchanges: [{"eid":"Futures_Binance","currency":"BTC_USDT"}]
*/

// This Pine Script™ code is subject to the terms of the Mozilla Public License 2.0 at https://mozilla.org/MPL/2.0/
// © GreatestUsername

//@version=5
strategy("BabyShark VWAP Strategy", overlay=true, margin_long=100, margin_short=100, calc_on_every_tick = true)


// VWAP
ls = input(false, title='Log-space', group = "Optional")
type = 'Average Deviation'
length = input(60, group="Strategy Modification")
source = input(close, group="Strategy Modification")
_low = ls == true ? math.log(low) : low
_high = ls == true ? math.log(high) : high
src = ls == true ? math.log(source) : source

//weighted mean
pine_vwmean(x, y) =>
    cw = 0.0
    cd = 0.0
    w_sum = 0.0
    d_sum = 0.0
    for i = 0 to y - 1 by 1
        cd := x[i]
        cw := volume[i]
        d_sum += cw * cd
        w_sum += cw
        w_sum
    d_sum / w_sum

//weighted standard deviation
pine_vwstdev(x, y, b) =>
    d_sum = 0.0
    w_sum = 0.0
    cd = 0.0
    for i = 0 to y - 1 by 1
        cd := x[i]
        cw = volume[i]
        d_sum += cw * math.pow(cd - b, 2)
        w_sum += cw
        w_sum
    math.sqrt(d_sum / w_sum)

//weighted average deviation
pine_vwavdev(x, y, b) =>
    d_sum = 0.0
    w_sum = 0.0
    cd = 0.0
    for i = 0 to y - 1 by 1
        cd := x[i]
        cw = volume[i]
        d_sum += cw * math.abs(cd - b)
        w_sum += cw
        w_sum
    d_sum / w_sum

vwmean = pine_vwmean(src, length)

//consider using Average Deviation instead of Standard Deviatio if there are values outside of 3rd upper & lower bands within a rolling window
dev = if type == 'Standard Deviation'
    dev = pine_vwstdev(src, length, vwmean)
    dev
else if type == 'Average Deviation'
    dev = pine_vwavdev(src, length, vwmean)
    dev

basis = ls == true ? math.exp(vwmean) : vwmean
plot(basis, color=color.new(#b7b7b7, 60), title='Basis')

upper_dev_2 = vwmean + dev * 2
upper_dev_3 = vwmean + dev * 3

lower_dev_2 = vwmean - dev * 2
lower_dev_3 = vwmean - dev * 3

fill(
     plot1=plot(ls == true ? math.exp(upper_dev_2) : upper_dev_2, color=color.new(#B20000, 0), title='Upper dev 2'),
     plot2=plot(ls == true ? math.exp(upper_dev_3) : upper_dev_3, color=color.new(#FF6666, 0), title='Upper dev 3', display=display.none),
     color=color.new(#FF4D4D, 80), title='Upper band'
     )
fill(
     plot1=plot(ls == true ? math.exp(lower_dev_3) : lower_dev_3, color=color.new(#00CC00, 0), title='Lower dev 3', display=display.none),
     plot2=plot(ls == true ? math.exp(lower_dev_2) : lower_dev_2, color=color.new(#008000, 0), title='Lower dev 2'),
     color=color.new(#006600, 80), title='Lower band'
     )


// Input to enable or disable the table visibility
table_visible = input(false, title="Show Table", group="Deviation Cross Monitor")
// Input for the number of candles to look back
table_length = input(300, title="Table Lookback Length", group="Deviation Cross Monitor")

// Custom count function
count_occurrences(cond, length) =>
    count = 0
    for i = 0 to length - 1
        if cond[i]
            count := count + 1
    count

// Count occurrences of prices above Upper dev 2 and below Lower dev 2

above_upper_dev_2 = count_occurrences(close > upper_dev_2, table_length)
below_lower_dev_2 = count_occurrences(close < lower_dev_2, table_length)

// Create table in the bottom right corner
var table tbl = table.new(position=position.bottom_right, rows=2, columns=2)

if table_visible
    if barstate.islast
        // Update the table headers
        table.cell(tbl, 0, 0, "Above Upper Dev 2", bgcolor=color.gray, text_color=color.white)
        table.cell(tbl, 0, 1, "Below Lower Dev 2", bgcolor=color.gray, text_color=color.white)

        // Update the table values
        table.cell(tbl, 1, 0, str.tostring(above_upper_dev_2), bgcolor=color.new(color.green, 90), text_color=color.green)
        table.cell(tbl, 1, 1, str.tostring(below_lower_dev_2), bgcolor=color.new(color.red, 90), text_color=color.red)
else
    table.delete(tbl)

// RSI
obvsrc = close
change_1 = ta.change(obvsrc)
obv = ta.cum(ta.change(obvsrc) > 0 ? volume : change_1 < 0 ? -volume : 0 * volume)

src2 = obv
len = input.int(5, minval=1, title="RSI Length", group="Strategy Modification")
up = ta.rma(math.max(ta.change(src2), 0), len)
down = ta.rma(-math.min(ta.change(src2), 0), len)
rsi = down == 0 ? 100 : up == 0 ? 0 : 100 - 100 / (1 + up / down)
higherlvl = input(70, title="Higher Level", group="Strategy Modification")
lowerlvl = input(30, title="Lower Level", group="Strategy Modification")


plot_color = rsi >= higherlvl ? color.red : rsi <= lowerlvl ? color.green : color.new(#b7b7b7, 60)
// plot(rsi, color=plot_color)

//plot(rsi, color=color.white)


// Count occurrences of RSI crossing higher level and lower level
cross_above_higher = ta.crossover(rsi, higherlvl)
cross_below_lower = ta.crossunder(rsi, lowerlvl)
above_higher_count = count_occurrences(cross_above_higher, table_length)
below_lower_count = count_occurrences(cross_below_lower, table_length)

// Create table in the bottom right corner
if (table_visible)
    var table tbl2 = table.new(position=position.bottom_right, rows=2, columns=2)
    if (barstate.islast)
        // Update the table headers
        table.cell(tbl2, 0, 0, "Higher Level Cross", bgcolor=color.gray, text_color=color.white)
        table.cell(tbl2, 0, 1, "Lower Level Cross", bgcolor=color.gray, text_color=color.white)

        // Update the table values
        table.cell(tbl2, 1, 0, str.tostring(above_higher_count), bgcolor=color.new(color.red, 90), text_color=color.red)
        table.cell(tbl2, 1, 1, str.tostring(below_lower_count), bgcolor=color.new(color.green, 90), text_color=color.green)


// Entries

// Long Entry:
// Price is in the shaded GREEN area of [Hoss] VWAP Deviation
// and the [Hoss] OBV RSI is GREEN.
longCondition1 = close <= lower_dev_3
longConditions = plot_color == color.green and longCondition1 and strategy.position_size == 0

// Short Entry:
// Price is in the shaded RED area of [Hoss] VWAP Deviation
// and the [Hoss] OBV RSI is RED.
shortCondition1 = close >= upper_dev_3
shortConditions = plot_color == color.red and shortCondition1 and strategy.position_size == 0

var int lastEntryBar = 0


shortEMA = ta.ema(close, 12)
longEMA = ta.ema(close, 21)
uptrend = shortEMA > longEMA

if longConditions and lastEntryBar < bar_index - 10 //and uptrend
    strategy.entry("Long", strategy.long, stop=close * 0.994)
    lastEntryBar := bar_index

if shortConditions and lastEntryBar < bar_index - 10 //and not uptrend
    strategy.entry("Short", strategy.short, stop=close * 1.006)
    lastEntryBar := bar_index


if strategy.position_size > 0 and (ta.crossover(close, basis) or strategy.opentrades.entry_price(strategy.opentrades - 1) * 0.994 > close)
    strategy.close("Long", immediately = true)
if strategy.position_size < 0 and (ta.crossunder(close, basis) or strategy.opentrades.entry_price(strategy.opentrades - 1) * 1.006 < close)
    strategy.close("Short", immediately = true)

// Stop Loss:
// 0.6%
// After 1 Loss => NO more Trades for 10 Candles (10 minutes) (usually a breakout will happen, and it takes average 10min till it ranges again. So basically wait for range to form again)

// Take Profit:
// Grey line on [Hoss] VWAP Deviation or 0.6%