Chiến lược giao dịch theo xu hướng khung thời gian đa dạng dựa trên MACD, ADX và EMA200

Tổng quan
Chiến lược này dựa trên các chỉ số MACD, ADX và EMA200, giao dịch theo xu hướng trong nhiều khung thời gian bằng cách đánh giá xu hướng và động lực thị trường hiện tại. Ý tưởng chính của chiến lược là sử dụng chỉ số MACD để đánh giá xu hướng thị trường, chỉ số ADX xác nhận cường độ xu hướng, EMA200 làm điều kiện lọc xu hướng, đồng thời giao dịch với nhiều khung thời gian để có được nhiều cơ hội giao dịch và tỷ lệ lợi nhuận tốt hơn.
Nguyên tắc chiến lược
- Tính trung bình di chuyển chỉ số 200 ngày ((EMA200), làm điều kiện lọc xu hướng.
- Tính toán MACD, bao gồm đường MACD, đường tín hiệu và biểu đồ cột, để đánh giá xu hướng thị trường.
- Tính toán tỷ lệ biến động thực tế (ATR) và chỉ số chuyển động theo hướng (ADX) để xác nhận cường độ của xu hướng.
- Điều kiện nhập cảnh đa đầu: Giá đóng cửa trên EMA200, đường MACD trên đường tín hiệu và dưới 0, ADX lớn hơn bằng 25 <unk>
- Điều kiện đầu vào trống: Giá đóng cửa dưới EMA 200, đường MACD dưới đường tín hiệu và trên 0, ADX lớn hơn bằng 25.
- Sử dụng ATR để tính toán dừng lỗ và khoảng cách dừng, thiết lập dừng lỗ là 1% và thiết lập dừng là 1,5% <unk>
- Khi điều kiện đa đầu được đáp ứng, hãy làm nhiều bằng cách dừng đơn và giá giới hạn đơn; Khi điều kiện đầu trống được đáp ứng, hãy làm trống bằng cách dừng đơn và giá giới hạn đơn.
- Kiểm tra chiến lược trong các khung thời gian khác nhau, chẳng hạn như 15 phút, 30 phút, 1 giờ, để tìm ra khung thời gian giao dịch tối ưu.
Phân tích lợi thế
- Kết hợp nhiều chỉ số để đưa ra quyết định giao dịch, giúp tăng độ tin cậy và ổn định của chiến lược.
- Sử dụng nhiều khung thời gian giao dịch, bạn có thể nắm bắt các xu hướng ở nhiều cấp độ và có được nhiều cơ hội giao dịch hơn.
- Sử dụng ATR để tính toán dừng lỗ và khoảng cách dừng, bạn có thể điều chỉnh vị trí theo động thái, kiểm soát rủi ro.
- Các thiết lập dừng lỗ và dừng lại hợp lý, giúp tăng tỷ lệ rủi ro lợi nhuận của chiến lược.
- Cấu trúc mã rõ ràng, dễ hiểu và tối ưu hóa.
Phân tích rủi ro
- Chiến lược này phụ thuộc vào thị trường đang có xu hướng và có thể không hoạt động tốt trong thị trường bất ổn.
- Các thiết lập tham số cho nhiều chỉ số có thể cần được tối ưu hóa cho các thị trường và tài sản khác nhau, nếu không có thể dẫn đến hiệu suất chiến lược kém.
- Các thiết lập dừng lỗ và dừng lại là cố định, có thể không thích ứng với sự thay đổi của thị trường, dẫn đến tăng lỗ hoặc giảm lợi nhuận.
- Các giao dịch theo nhiều khung thời gian có thể làm tăng tần suất giao dịch, dẫn đến tăng chi phí giao dịch.
Giải pháp:
- Tiếp theo, chúng tôi sẽ giới thiệu các thông số thích ứng để tự động điều chỉnh các thông số chỉ số theo sự thay đổi của thị trường.
- Điều chỉnh động đối với dừng và dừng, chẳng hạn như sử dụng theo dõi dừng hoặc dừng chuyển động.
- Cân nhắc chi phí giao dịch, chọn khung thời gian và tần suất giao dịch tối ưu.
Hướng tối ưu hóa
- Việc đưa ra các chỉ số xác nhận xu hướng khác, chẳng hạn như Brin Belt, hệ thống đường thẳng, v.v., giúp tăng độ chính xác trong việc đánh giá xu hướng.
- Tối ưu hóa các thiết lập dừng lỗ và dừng lỗ, chẳng hạn như sử dụng dừng lỗ động hoặc dừng lỗ dựa trên tỷ lệ dao động.
- Thêm nhiều điều kiện lọc vào tín hiệu giao dịch, chẳng hạn như khối lượng giao dịch, tâm trạng thị trường, để cải thiện chất lượng tín hiệu.
- Tối ưu hóa các tham số cho các thị trường và tài sản khác nhau để tìm ra sự kết hợp tốt nhất.
- Xem xét việc đưa ra các thuật toán học máy, thích ứng với sự thay đổi của thị trường, cải thiện khả năng thích ứng và ổn định của chiến lược.
Bằng cách tối ưu hóa, bạn có thể cải thiện tính mạnh mẽ và lợi nhuận của chiến lược để thích ứng tốt hơn với các môi trường thị trường khác nhau.
Tóm tắt
Chiến lược này có một số ưu điểm và khả năng hoạt động bằng cách kết hợp các chỉ số như MACD, ADX và EMA200 để giao dịch theo xu hướng trong nhiều khung thời gian. Điều quan trọng của chiến lược là đánh giá xu hướng và xác nhận cường độ xu hướng, thông qua sự hoạt động chung của nhiều chỉ số, có thể nắm bắt cơ hội xu hướng tốt hơn. Đồng thời, chiến lược sử dụng các điểm dừng cố định giúp kiểm soát rủi ro.
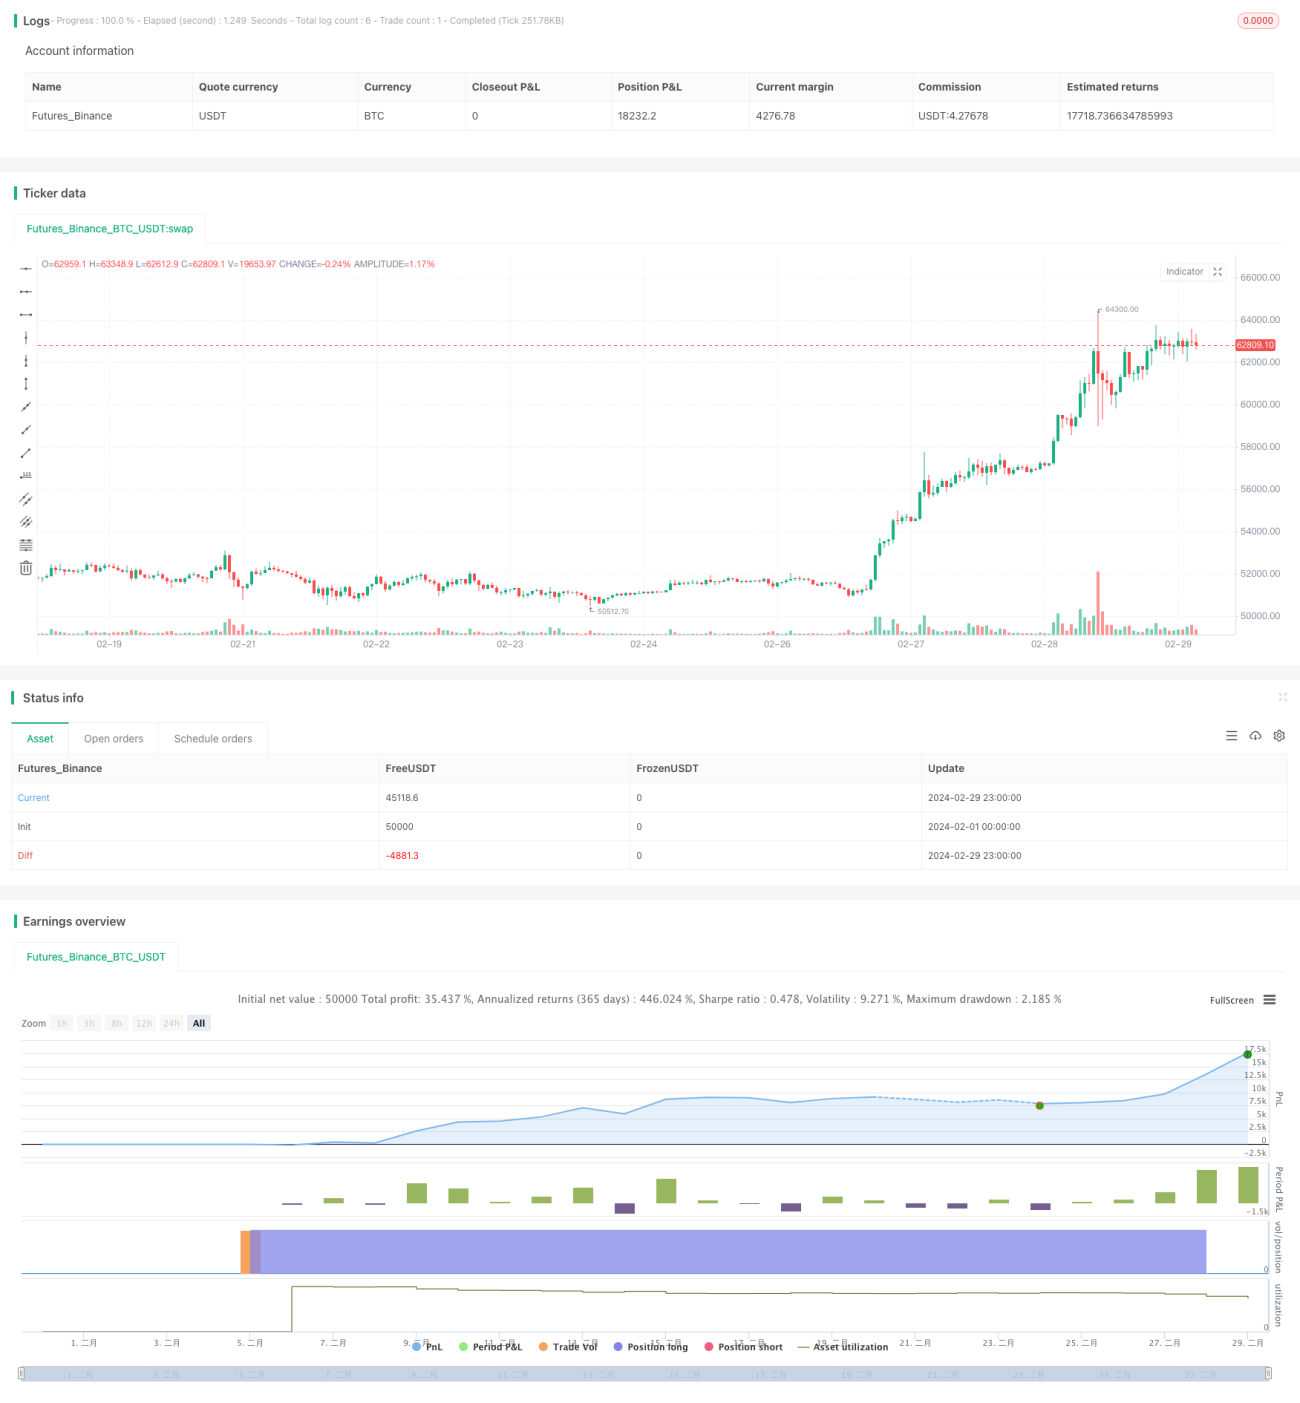
/*backtest
start: 2024-02-01 00:00:00
end: 2024-02-29 23:59:59
period: 1h
basePeriod: 15m
exchanges: [{"eid":"Futures_Binance","currency":"BTC_USDT"}]
*/

// This Pine Script™ code is subject to the terms of the Mozilla Public License 2.0 at https://mozilla.org/MPL/2.0/
// © colemanrumsey

//@version=5- 1