RSI MACD ক্রসওভার ডাবল মুভিং এভারেজ ট্র্যাকিং কৌশল

ওভারভিউ
এই কৌশলটি আরএসআই সূচক, এমএসিডি সূচক এবং দ্বৈত সমান্তরাল লাইন ব্যবহার করে ট্রেন্ড ট্র্যাকিং এবং স্ট্যান্ডার্ড ডিফারেনশিয়ালের প্রভাব অর্জন করে। কৌশলটি আরএসআই সূচকের মাধ্যমে ওভারসোলের ঘটনাটি বিচার করে, এমএসিডি দ্রুত এবং ধীর সমান্তরাল ক্রস ক্রস ক্রয়ের সময় নির্ধারণ করে, দ্বৈত সমান্তরাল লাইনটি কিছু গোলমাল ট্রেডিংয়ের সুযোগগুলি ফিল্টার করে এবং প্রবণতা থেকে লাভ করে।
কৌশল নীতি
- আরএসআই সূচকটি ওভারবয় ওভারসোল্ডের জন্য ব্যবহৃত হয়
-
একটি নির্দিষ্ট সময়ের মধ্যে পতনশীল পরিবর্তন গণনা করুন
-
আরএসআই এর উপর ভিত্তি করে
-
ওভারবয় ওভারসেলিং
- MACD ক্রস-বিচার গণনা
-
দ্রুত, ধীর এবং সংকেত লাইন গণনা করুন
-
ক্রস-লাইন ক্রয়-বিক্রয়
-
ক্রস প্রদর্শন করুন
- দ্বৈত সমান্তরাল ফিল্টারিং
-
দ্রুত এবং ধীর লাইন গণনা করুন
-
শুধুমাত্র ফাস্টলাইন ব্যবহার করে ট্রেড করার কথা ভাবুন।
-
প্রবণতা ট্র্যাকিং শব্দ ফিল্টারিং বাস্তবায়ন
- একাধিক সূচকের সমন্বয়
-
সমন্বিত আরএসআই, এমএসিডি, ডাবল সমান্তরাল একাধিক শর্ত ফিল্টার
-
কৌশলগত স্থিতিশীলতা বৃদ্ধি
সামর্থ্য বিশ্লেষণ
-
মাল্টিমিটার প্যাকেজ, কৌশলগত নির্ভুলতা বৃদ্ধি
-
ট্রেন্ড ট্র্যাকিং, গোলমাল ফিল্টারিং, স্থিতিশীলতা বৃদ্ধি
-
আরএসআই সূচকগুলি ওভারবয় ওভারসোল্ডের দিকে নির্দেশ করে
-
MACD ক্রস বিচার, সহজ এবং কার্যকরভাবে ক্রয় এবং বিক্রয় বিচার
-
ডাবল-ইউনিভার্সাল ফিল্টারিং, বেশিরভাগ অ-প্রধানধারার লেনদেনের সুযোগ সরিয়ে দেয়
-
সহজেই বোঝা যায়, প্যারামিটার কম, শিক্ষার উন্নতির জন্য উপযুক্ত
ঝুঁকি বিশ্লেষণ
-
একাধিক সূচক সমন্বয়, কৌশলগত ওভার অপ্টিমাইজেশনের জন্য সহজ
-
ডাবল-ইউনিভার্সাল, কিছু সুযোগ হাতছাড়া করে, নমনীয়তা হারাচ্ছে
-
RSI এবং MACD এর প্যারামিটারগুলি সাবধানতার সাথে বেছে নিন
-
ট্রেডিং প্রজাতির স্টপ লস এবং ঝুঁকি নিয়ন্ত্রণে মনোযোগ দিন
-
দীর্ঘমেয়াদী ব্যবহারের জন্য বারবার বাজারে প্যারামিটারগুলি সামঞ্জস্য করতে হবে
অপ্টিমাইজেশান দিক
-
বিভিন্ন জাতের বৈশিষ্ট্য অনুসারে আরএসআই প্যারামিটারগুলি সামঞ্জস্য করুন
-
ট্রেন্ড ট্র্যাকিং এফেক্ট অপ্টিমাইজ করার জন্য ডাবল-ইভেন চক্রের সমন্বয়
-
একক ক্ষতি নিয়ন্ত্রণে স্টপ লস কৌশল যোগ করুন
-
আরও সূচক, সমৃদ্ধ প্যাকেজ
-
বিকাশের প্যারামিটারগুলি স্বনির্ধারিত মোডে, স্বয়ংক্রিয়ভাবে প্যারামিটারগুলি সামঞ্জস্য করে
সারসংক্ষেপ
এই কৌশলটি আরএসআই, এমএসিডি এবং ডাবল সমান্তরাল লাইনের মতো একাধিক সূচক ব্যবহার করে, প্রবণতার বিচার এবং ট্র্যাকিং সক্ষম করে, সুযোগের জন্য একাধিক স্তর ফিল্টার করে, এটি একটি নতুনদের শেখার এবং উন্নতির জন্য উপযুক্ত একটি মাল্টি-ইনডিকেটর কৌশল। এই কৌশলটির সুবিধাটি হ'ল এটি সহজ, কার্যকর, সহজেই বোঝা যায়, প্যারামিটারগুলি সামঞ্জস্য করে ভাল স্থিতিশীল আয় অর্জন করা যায়। পরবর্তী পদক্ষেপটি আরও সূচক যুক্ত করে এবং প্যারামিটার মডেলগুলিকে সামঞ্জস্য করে এমন আরও অপ্টিমাইজেশন কৌশল বিকাশ করে যাতে এটি স্বয়ংক্রিয়ভাবে আরও বিভিন্ন বাজারের পরিবেশের সাথে সামঞ্জস্য করতে পারে।
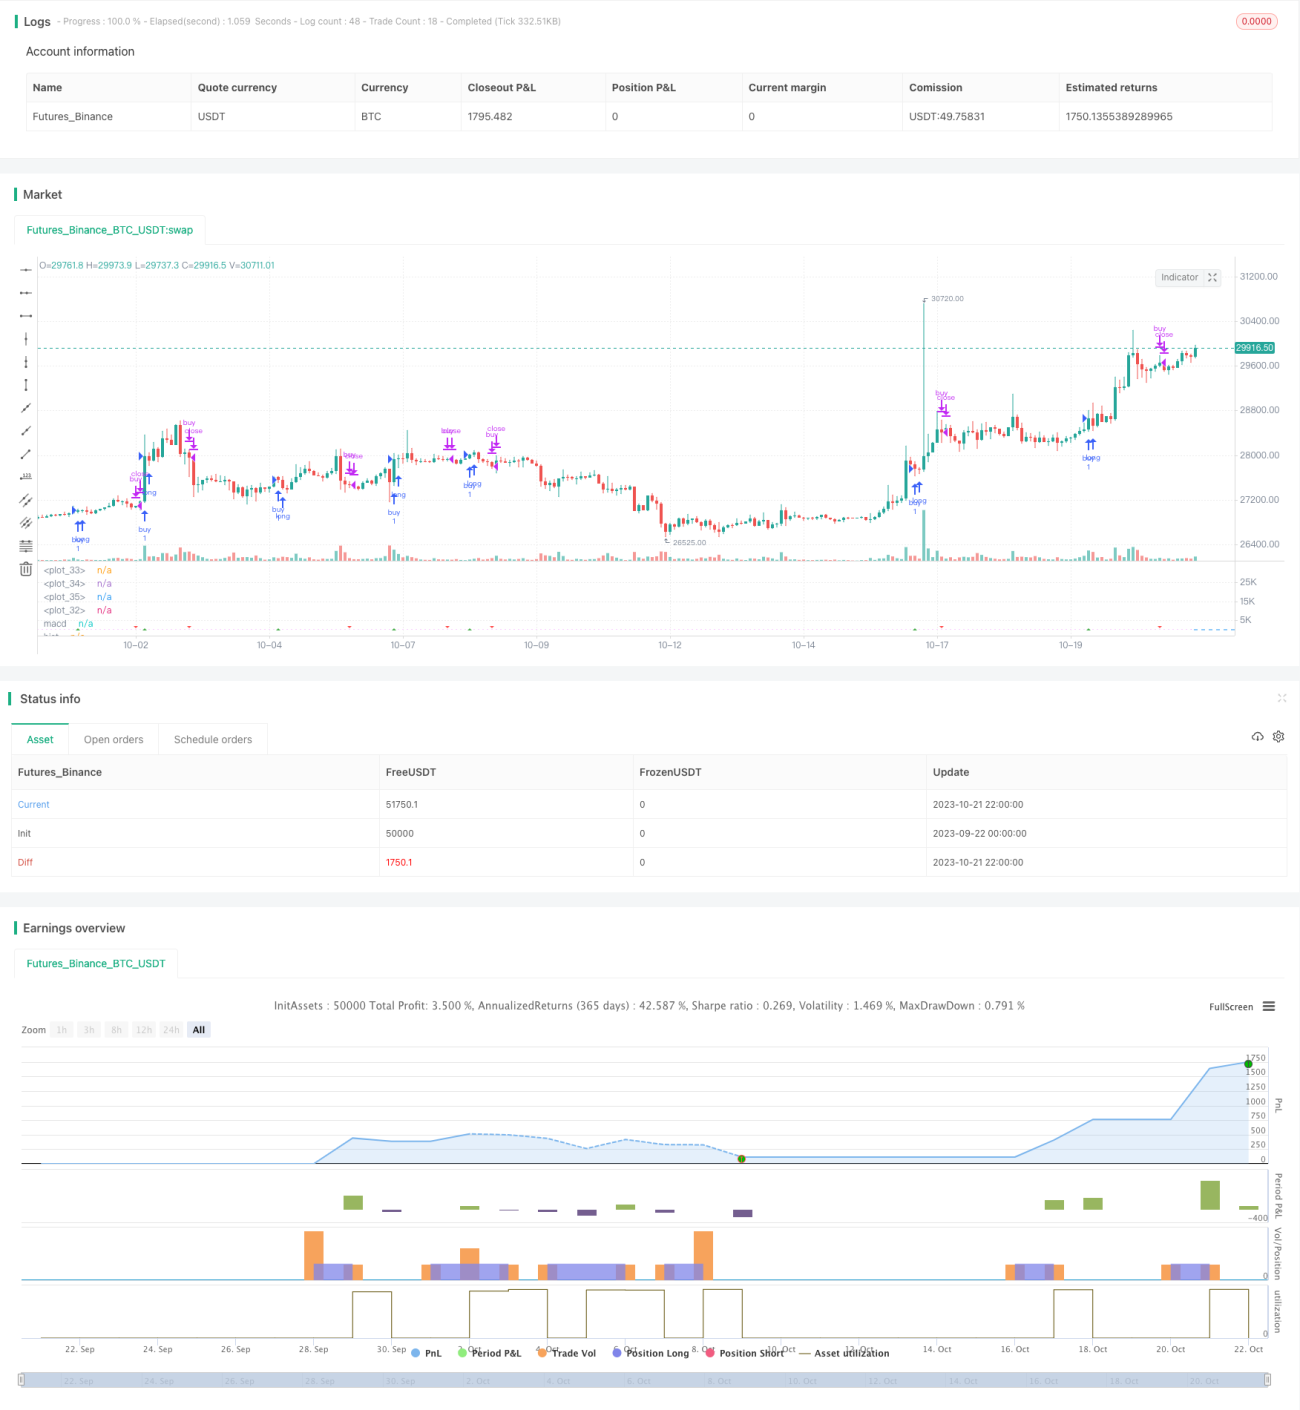
/*backtest
start: 2023-09-22 00:00:00
end: 2023-10-22 00:00:00
period: 2h
basePeriod: 15m
exchanges: [{"eid":"Futures_Binance","currency":"BTC_USDT"}]
*/

//@version=3

// strategy(title="RSI MACD", precision = 6, pyramiding = 1, default_qty_type = strategy.percent_of_equity, default_qty_value = 99, commission_type = strategy.commission.percent, commission_value = 0.25, initial_capital = 1000)
- 1