দ্বিমুখী চাপ পরিমাণগত ট্রেডিং কৌশল

ওভারভিউ
দ্বি-মুখী চাপ-শক্তিযুক্ত ট্রেডিং কৌশলটি একটি প্রবণতা-অনুসরণ কৌশল যা র্যান্ডম সূচক এবং ক্রয়-বিক্রয় সূচকগুলির সমন্বয় করে। এই কৌশলটি মূলত কে এবং ডি লাইন এবং ক্রয়-বিক্রয় সূচকগুলি ব্যবহার করে ক্রয় এবং বিক্রয় সংকেত উত্পন্ন করে, সমান্তরাল গোল্ডফোর্স এবং ডেডফোর্সের সাহায্যে অতিরিক্ত সংকেত উত্পন্ন করে।
কৌশল নীতি
ক্রয় সংকেত
ক্রয় সংকেতের প্রধান ট্রিগার লজিক হল:
-
K লাইন এবং D লাইন একই সময়ে oversold অঞ্চল (যেমন 20) ভাঙার এবং একটি ঊর্ধ্বমুখী ক্রস উত্পন্ন, এবং K লাইন এবং D লাইন একই সময়ে একটি উত্থান প্রবণতা হয়
-
লেনদেনের পরিমাণ নির্দিষ্ট থ্রেশহোল্ডের চেয়ে বেশি (যেমন লেনদেনের গড় পরিমাণের 1.4 গুণ)
-
বন্ধের মূল্য খোলার মূল্যের চেয়ে বেশি (সাদা K লাইন)
এছাড়াও, নিম্নলিখিত সূত্রগুলি থেকে অতিরিক্ত ক্রয় সংকেত আসতে পারেঃ
-
সমান্তরাল জালঃ দ্রুত EMA লাইনের উপর ধীর EMA লাইন অতিক্রম করে এবং দুটি সমান্তরাল লাইন একই সাথে উত্থিত হয়
-
K লাইন এবং D লাইন একই সময়ে নিম্ন থেকে oversold অঞ্চলে প্রবেশ করে (যেমন 20 এর নীচে থেকে 20 থেকে 80 এর মধ্যে উঠা)
বিক্রয় সংকেত
বিক্রয় সংকেতের মূল ট্রিগার হলোঃ
-
K লাইন এবং D লাইন একই সাথে ওভারসোল্ড অঞ্চলে প্রবেশ করে (যেমন ৮০)
-
সমান্তরাল ডাইফোর্কঃ দ্রুত ইএমএ লাইনের নীচে ধীর ইএমএ লাইন অতিক্রম করে
-
K লাইন D লাইন অতিক্রম করে এবং K লাইন এবং D লাইন উভয়ই নিম্নমুখী প্রবণতা রয়েছে
স্টপ সিগন্যাল
ক্রয় মূল্যের একটি নির্দিষ্ট শতাংশ (যেমন 6%) স্টপ লস লাইন হিসাবে সেট করুন, যদি দামটি এই লাইনটি অতিক্রম করে তবে স্টপ লস বিক্রয় ট্রিগার করে।
কৌশলগত শক্তি বিশ্লেষণ
- ডাবল র্যান্ডম সূচক ব্যবহার করে ভুল সংকেত এড়ানো
- সংমিশ্রণ ট্র্যাফিক ফিল্টারিং শব্দ, প্রবণতা নিশ্চিত
- একাধিক সংকেতকে একত্রিত করে সঠিকতা বাড়ানো
- গড় রেখা বড় ট্রেন্ডের দিক নির্ণয় করতে সাহায্য করে
- স্টপ লস স্ট্র্যাটেজি সেট করুন এবং ঝুঁকি নিয়ন্ত্রণ করুন
সুবিধা ১ঃ ডাবল র্যান্ডম সূচকগুলি মিথ্যা সংকেত এড়ায়
একটি একক র্যান্ডম সূচক প্রচুর পরিমাণে মিথ্যা সংকেত তৈরি করতে পারে। এই কৌশলটি কে লাইন এবং ডি লাইন (কে লাইনের চলমান গড়) দ্বৈত র্যান্ডম সূচক সমন্বয় ব্যবহার করে, যা কার্যকরভাবে মিথ্যা সংকেতগুলি ফিল্টার করতে পারে এবং সংকেতের নির্ভরযোগ্যতা নিশ্চিত করতে পারে।
সুবিধা ২ঃ ট্র্যাফিকের শব্দ ফিল্টার করুন, ট্রেন্ডিং নিশ্চিত করুন
লেনদেনের পরিমাণের শর্তগুলি সহযোগী বিচারক মানদণ্ড হিসাবে যুক্ত করা হয়েছে, যার জন্য লেনদেনের পরিমাণের একটি নির্দিষ্ট স্তরের চেয়ে বেশি প্রয়োজন, যার ফলে কম পরিমাণে অ-প্রবণতাযুক্ত ক্রয়-বিক্রয় পয়েন্টগুলি ফিল্টার করা যায় এবং পজিশনের ঝুঁকি হ্রাস করা যায়।
সুবিধা 3: একাধিক সংকেত ওভারল্যাপ, উন্নত নির্ভুলতা
কৌশলটি একাধিক ক্রয়-বিক্রয় সংকেতকে একত্রিত করে, যা একটি সত্যিকারের ট্রেডিং সংকেত তৈরি করতে একই সময়ে ট্রিগার করা দরকার। একাধিক সূচককে একত্রিত করা সংকেতের নির্ভরযোগ্যতা বাড়িয়ে তুলতে পারে।
সুবিধা ৪: গড়রেখা বড় ট্রেন্ডের দিক নির্ণয় করতে সাহায্য করে
গড়রেখার বিচার করার নিয়ম যোগ করুন, যেমন শুধুমাত্র যখন গড়রেখার ধীরে ধীরে বৃদ্ধি হয় তখনই ক্রয় সংকেত বিবেচনা করুন। এটি বিপরীতমুখী ক্রয় বা টপিং এড়াতে পারে এবং বড় সময়কালের সময় থেকে প্রবণতা বিচার করতে পারে।
সুবিধা ৫ঃ স্টপ লস কৌশল নির্ধারণ করুন এবং ঝুঁকি নিয়ন্ত্রণ করুন
কৌশলটিতে স্টপ লস সিগন্যালের নকশা রয়েছে, যদি দাম ক্রয়-বিক্রয়ের সময় একটি নির্দিষ্ট শতাংশের নীচে চলে যায় তবে স্বয়ংক্রিয়ভাবে বন্ধ হয়ে যায়। এটি কার্যকরভাবে একক ব্যবসায়ের সর্বাধিক ক্ষতি নিয়ন্ত্রণ করতে পারে।
ঝুঁকি বিশ্লেষণ
- নীতির প্যারামিটারগুলি সাবধানে ডিবাগ করা প্রয়োজন, এবং ভুল সেটিংগুলি দুর্বল পারফরম্যান্সের কারণ হতে পারে
- স্টপ লস সেটআপের জন্য উড়ন্ত ঝুঁকি বিবেচনা করা প্রয়োজন
- ট্রেডিং প্রজাতির তরলতা ঝুঁকিতে মনোযোগ দিন
- একাধিক সময়কালের সূচকগুলির বিট-সিরিজ ঝুঁকি সম্পর্কে সচেতন থাকুন
ঝুঁকি ১ঃ কৌশলগত প্যারামিটারগুলিকে ভালোভাবে ডিবাগ করতে হবে
এই কৌশলটিতে বেশ কয়েকটি প্যারামিটার রয়েছে, যেমন র্যান্ডম ইনডিকেটর প্যারামিটার, গড় প্যারামিটার, ক্রয় পরিমাণের প্যারামিটার ইত্যাদি। এই প্যারামিটারগুলি বিভিন্ন জাতের জন্য অনুকূলিতকরণের প্রয়োজন, এবং ভুল সেট করা ফলাফলকে দুর্বল করতে পারে।
ঝুঁকি ২ঃ স্টপ পয়েন্ট সেটিং এ উড়ন্ত ঝুঁকি বিবেচনা করা প্রয়োজন
স্টপ লস পয়েন্ট সেট করার সময়, দামের উঁচুতে যাওয়ার সম্ভাবনা বিবেচনা করা দরকার। যদি স্টপ লস পয়েন্টটি ক্রয় মূল্যের খুব কাছাকাছি থাকে তবে উঁচুতে যাওয়ার ফলে অপ্রয়োজনীয় স্টপ লস হতে পারে।
ঝুঁকি 3: ট্রেডিং প্রকারের তরলতা ঝুঁকি
কম সচল জাতের জন্য, প্রজনন পরিমাণের নিয়মগুলি অতিরিক্ত সংকেতগুলি ফিল্টার করতে পারে। এই সময়ে প্রজনন পরিমাণের শর্তগুলি হ্রাস করা দরকার।
ঝুঁকি ৪ঃ বহু-সময়কালীন সূচকগুলির বিট-সিরিজ ঝুঁকি
বিভিন্ন পর্যায়ের সূচকগুলির মধ্যে বিট ক্রমের অসঙ্গতি হতে পারে, যা সংকেতের নির্ভুলতার উপর প্রভাব ফেলতে পারে। সংকেতের পয়েন্ট ক্রমের সামঞ্জস্যতা যাচাই করতে হবে।
অপ্টিমাইজেশান দিক
এই কৌশলটি নিম্নলিখিত দিকগুলি থেকে উন্নত করা যেতে পারেঃ
-
স্থিতিশীলতা বাড়ানোর জন্য প্যারামিটার অপ্টিমাইজ করুন
-
মেশিন লার্নিং পদ্ধতিতে গতিশীল সমন্বয় প্যারামিটার যোগ করুন
-
অপ্টিমাইজ করা স্টপ লস কৌশল
-
আরও ফিল্টারিং যুক্ত করুন, কম লেনদেন করুন
-
শর্তসাপেক্ষ একক বা স্টপ-অফ কৌশলগুলি ব্যবহার করে আয় বাড়ান
দিকনির্দেশ 1: স্থিতিশীলতা বাড়ানোর জন্য প্যারামিটারগুলি অপ্টিমাইজ করুন
জিনগত অ্যালগরিদমের মতো আরও পদ্ধতিগত পদ্ধতির মাধ্যমে প্রধান প্যারামিটারগুলিকে অপ্টিমাইজ করা যেতে পারে, যাতে বিভিন্ন বাজার চক্রের মধ্যে প্যারামিটারগুলি স্থিতিশীল পারফরম্যান্স অর্জন করতে পারে।
দিকনির্দেশনা ২ঃ মেশিন লার্নিং পদ্ধতিতে গতিশীল সমন্বয় প্যারামিটার যোগ করা
মডেলগুলিকে রিয়েল-টাইমে বাজার পরিস্থিতি মূল্যায়ন করতে প্রশিক্ষণ দেওয়া যেতে পারে এবং সেই অনুযায়ী কৌশলগত প্যারামিটারগুলি সামঞ্জস্য করা যায়, প্যারামিটারগুলির গতিশীল অপ্টিমাইজেশনের জন্য।
ধাপ ৩ঃ স্টপ লস কৌশল অপ্টিমাইজ করুন
ভাল স্টপ লস কৌশলগুলি গবেষণা করা যেতে পারে, ঝুঁকি নিয়ন্ত্রণে রেখে, যতটা সম্ভব অপ্রয়োজনীয় স্টপ লস হ্রাস করা যায় এবং মুনাফার সুযোগ বাড়ানো যায়।
দিকনির্দেশনা ৪ঃ আরও ফিল্টারিং যুক্ত করুন, কম লেনদেন করুন
ট্রেডের সংখ্যা কমানোর জন্য এবং ট্রেডের খরচ কমানোর জন্য ফিল্টারিংয়ের শর্ত যথাযথভাবে জোরদার করা হয়েছে, যার ফলে প্রতিটি ট্রেডের রিটার্ন বেশি হবে।
দিকনির্দেশনা ৫ঃ শর্তসাপেক্ষ একক বা স্টপ-অফ কৌশলগুলি ব্যবহার করে আয় বাড়ান
বাজারের বৈশিষ্ট্য অনুসারে, একক কৌশল বা চলমান স্টপ স্টপ কৌশল ডিজাইন করা যেতে পারে, ক্ষতি থামানোর গ্যারান্টি দেওয়ার সময়, যতটা সম্ভব লাভের সর্বাধিকীকরণে প্লেইন করা যায়।
সারসংক্ষেপ
এই কৌশলটি প্রবণতা বিচার, ঝুঁকি নিয়ন্ত্রণ, ট্রেডিং ফ্রিকোয়েন্সি ইত্যাদির মতো একাধিক দিক বিবেচনা করে। মূল সুবিধা হ'ল দ্বৈত র্যান্ডম সূচকগুলি ট্র্যাভেলমিটার সূচক বিচার প্রবণতা এবং ঝুঁকি নিয়ন্ত্রণের সমন্বয়ে। পরবর্তী পদক্ষেপে, প্যারামিটার স্থিতিশীলতা, গতিশীল সমন্বয় প্যারামিটার, স্টপ লস হ্রাস ইত্যাদির দিক থেকে অপ্টিমাইজ করা যেতে পারে, যাতে কৌশলটি আরও বাজারের পরিবেশে স্থিতিশীল আয় অর্জন করতে পারে।
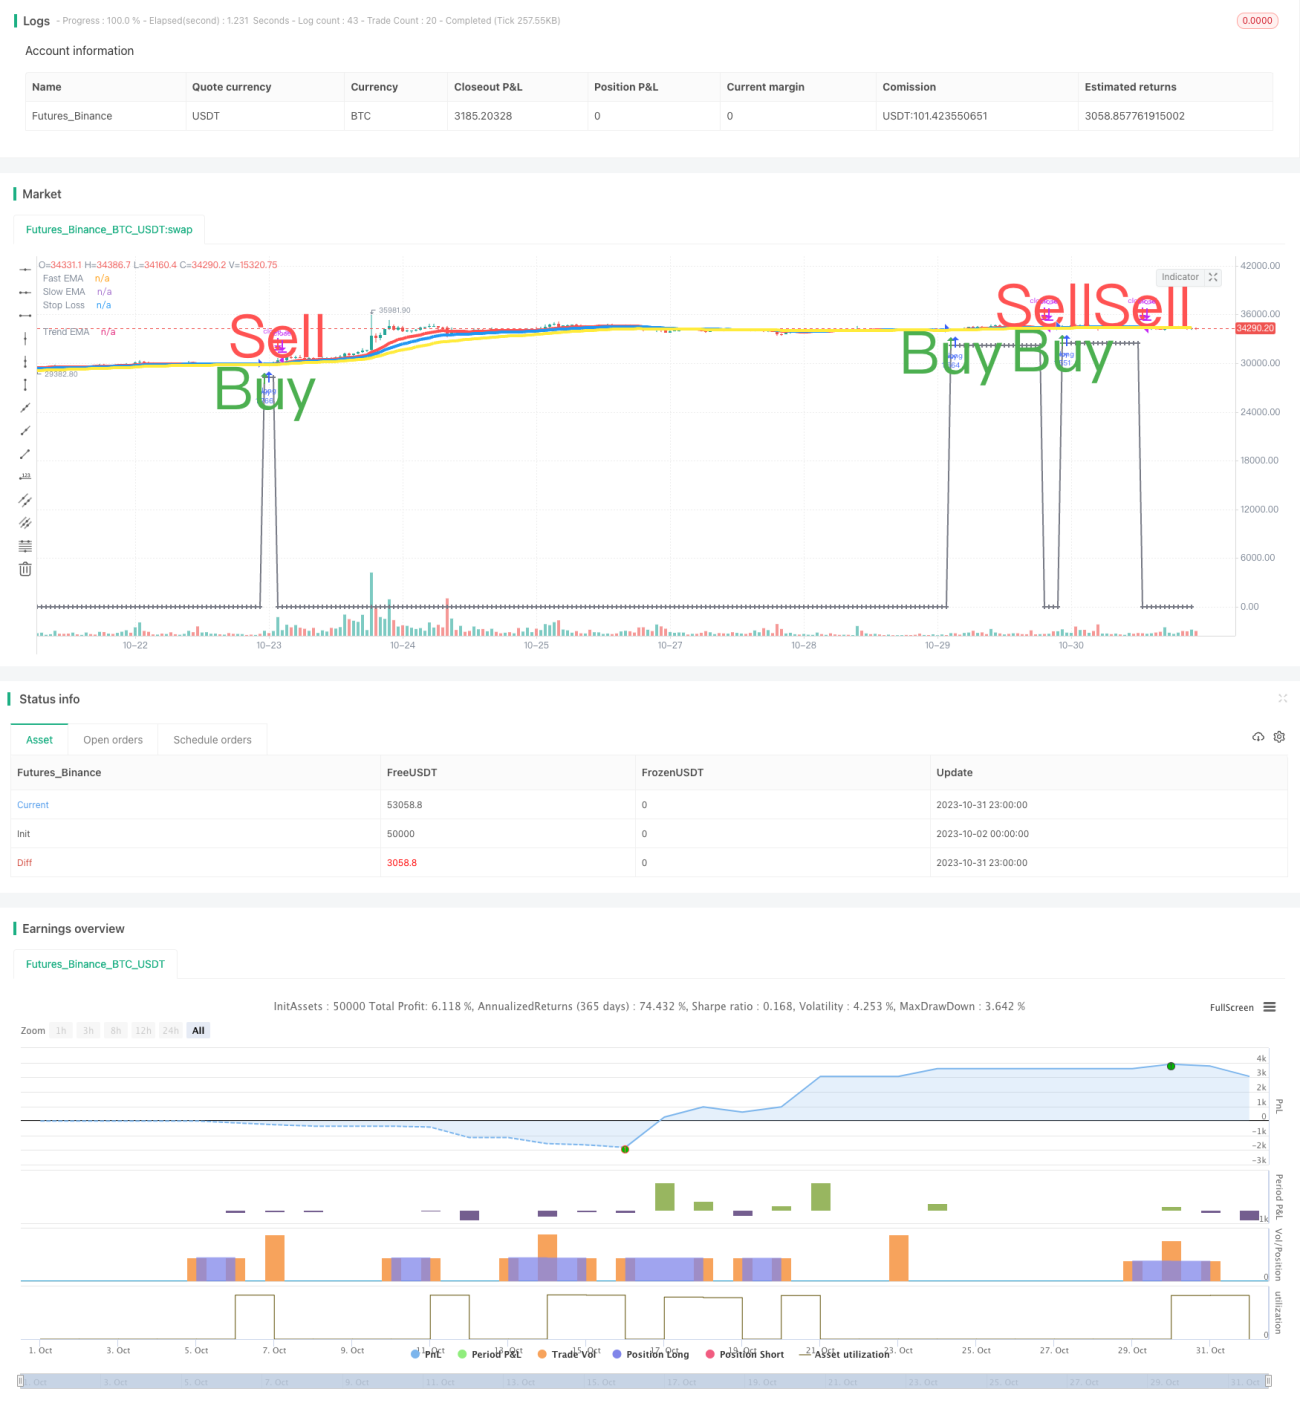
/*backtest
start: 2023-10-02 00:00:00
end: 2023-11-01 00:00:00
period: 1h
basePeriod: 15m
exchanges: [{"eid":"Futures_Binance","currency":"BTC_USDT"}]
*/

//@version=3
// SW SVE - Stochastic+Vol+EMAs [Sergio Waldoke]
// Script created by Sergio Waldoke (BETA VERSION v0.5, fine tuning PENDING)
// Stochastic process is the main source of signals, reinforced on buying by Volume. Also by Golden Cross.- 1