ডাবল মুভিং এভারেজ এবং উইলিয়ামস এভারেজ কম্বিনেশন স্ট্র্যাটেজি
ওভারভিউ
এই কৌশলটি ডাবল ইন্ডেক্সাল মুভিং এভারেজ এবং তিনটি উইলিয়ামস এভারেজকে একত্রিত করে একটি সমন্বিত প্রবণতা ট্র্যাকিং এবং প্রবণতা বিপরীত সিগন্যাল উত্পাদন সিস্টেম গঠন করে। এটির দুর্দান্ত পজিশন হোল্ডিং দক্ষতা রয়েছে যা কার্যকরভাবে মিথ্যা সংকেতগুলি ফিল্টার করতে পারে।
কৌশল নীতি
এই কৌশলটি মূলত দুটি উপ-কৌশল নিয়ে গঠিতঃ
ডাবল এক্সপোনেনশিয়াল মুভিং এভারেজ (ডিইএমএ) । এই সূচকটি একক এক্সপোনেনশিয়াল মুভিং এভারেজের প্রবণতা-অনুসরণ ক্ষমতা এবং ডাবল এক্সপোনেনশিয়াল মুভিং এভারেজের পিছিয়ে পড়া বৈশিষ্ট্যকে একত্রিত করে। যখন দাম বেড়ে যায়, তখন এটি আরও দ্রুত করতে পারে; যখন দাম কমে যায়, তখন এটি আরও দ্রুত স্থির করতে পারে।
উইলিয়ামসের তিন লাইন গড়. এই সূচকটি লম্বা, মাঝারি এবং সংক্ষিপ্ত লাইন নিয়ে গঠিত। এটি বিভিন্ন সময়কালের গড়ের ক্রস ব্যবহার করে ট্রেডিং সিগন্যাল তৈরির জন্য প্রবণতার পরিবর্তনগুলি বিচার করে। সংক্ষিপ্ত লাইনটি মাঝারি লাইন এবং মাঝারি লাইনটি অতিক্রম করে যখন দীর্ঘ লাইনটি অতিক্রম করে তখন একটি মাল্টিসিগন্যাল তৈরি করে। সংক্ষিপ্ত লাইনটি মাঝারি লাইন এবং মাঝারি লাইনটি অতিক্রম করে যখন দীর্ঘ লাইনটি অতিক্রম করে তখন একটি ফাঁকা সংকেত তৈরি করে।
এই কৌশলটির ট্রেডিং সিগন্যাল হল উপরের দুটি উপ-কৌশলগুলির ফলাফলকে ক্রমিকভাবে পরিচালনা করা। অর্থাৎ, এই কৌশলটি কেবল তখনই অর্ডার দেয় যখন দুটি উপ-কৌশল একই সাথে সংকেত দেয়। এটি কার্যকরভাবে মিথ্যা সংকেত হ্রাস করতে পারে এবং পজিশনের স্থিতিশীলতা বাড়িয়ে তুলতে পারে।
সামর্থ্য বিশ্লেষণ
এই কৌশলটির সবচেয়ে বড় সুবিধা হ’ল এটি কার্যকরভাবে মিথ্যা সংকেতগুলি ফিল্টার করতে পারে, যা তার কৌশলগত কাঠামোর দ্বারা নির্ধারিত হয়। যদিও ডাবল মুভিং এভারেজ এবং উইলিয়ামস এভারেজগুলির নিজস্ব অসুবিধা রয়েছে, তবে উভয়কে একত্রিত করে একে অপরকে ক্ষতিপূরণ দেওয়ার জন্য তাদের নিজস্ব সুবিধাগুলি ব্যবহার করা যেতে পারে। এটি এই কৌশলটিকে প্রবণতার পরিস্থিতিতে কার্যকরভাবে পজিশন ধরে রাখতে সক্ষম করে, যখন এটি অপসারণের পুরো পরিস্থিতিতে সময়মতো ক্ষতি বন্ধ করতে পারে।
উপরন্তু, এই কৌশলটির প্যারামিটারগুলি অপ্টিমাইজ করার জন্য প্রচুর জায়গা রয়েছে, যা বিভিন্ন জাতের এবং সময়কালের ট্রেডের বৈশিষ্ট্যগুলির সাথে সামঞ্জস্য করতে দ্বিগুণ চলমান গড়ের প্যারামিটারগুলি এবং উইলিয়ামস থ্রি স্ট্রিপ গড়ের প্যারামিটারগুলিকে সামঞ্জস্য করে।
ঝুঁকি বিশ্লেষণ
এই কৌশলটির প্রধান ঝুঁকি হল যে যখন বাজারের পরিস্থিতি তীব্রভাবে অস্থির হয়, তখন স্টপ লস পয়েন্টটি অতিক্রম করা যেতে পারে, যার ফলে বড় ক্ষতি হতে পারে। এটি একটি চলমান গড় কৌশলগুলির একটি সাধারণ সমস্যা। উপরন্তু, এই কৌশলটি ঘন ঘন পজিশনের পজিশনের পজিশনের পজিশনের জন্য ব্যবহার করা যেতে পারে, যা ট্রেডিং খরচ বৃদ্ধি করে।
এই ঝুঁকিগুলি নিয়ন্ত্রণ করার জন্য, প্যারামিটারগুলি অনুকূলিতকরণের সময় ওয়াক ফরওয়ার্ড বিশ্লেষণ পদ্ধতিটি ব্যবহার করার পরামর্শ দেওয়া হয় এবং যুক্তিসঙ্গত স্টপ লস সেট করা হয়। একই সাথে, অতিরিক্ত সূচকগুলি বাজারের অবস্থা নির্ধারণ করতে পারে, ঝড়ের সময় ট্রেডিং স্থগিত করা যায়।
অপ্টিমাইজেশান দিক
এই কৌশলটি নিম্নলিখিত দিকগুলিকে অনুকূলিতকরণ করেঃ
বিভিন্ন জাত এবং সময়কালের জন্য দ্বিগুণ চলমান গড়ের প্যারামিটারগুলিকে সামঞ্জস্য করুন।
উইলিয়ামস গড়ের তিনটি লাইন পর্যায়কে বাজারের ওঠানামা ফ্রিকোয়েন্সির সাথে সামঞ্জস্য করে।
পজিশন খোলার শর্ত বাড়ানো, নির্দিষ্ট সময়ে ট্রেডিং সিগন্যাল ফিল্টার করা। উদাহরণস্বরূপ, তীব্র ওঠানামা চলাকালীন ট্রেড করবেন না।
স্টপ লস কন্ট্রোলের জন্য স্টপ লস ইনডিকেটর যুক্ত করুন। স্টপ লস, গড় স্টপ লস ট্র্যাকিংয়ের মতো পদ্ধতিগুলি পরীক্ষা করতে পারেন।
মেশিন লার্নিং অ্যালগরিদমের স্বয়ংক্রিয় অপ্টিমাইজেশান প্যারামিটার প্রবর্তন করা।
সারসংক্ষেপ
এই কৌশলটি ডাবল মুভিং এভারেজ এবং উইলিয়ামস এভারেজের সুবিধাগুলি একত্রিত করে, ট্রেডিং সিগন্যালের কার্যকর ফিল্টারিং করে, মিথ্যা সংকেত হ্রাস করতে পারে এবং পজিশন হোল্ডিং দক্ষতা বাড়িয়ে তুলতে পারে। এটি বাজারের পরিস্থিতি অনুসারে প্যারামিটার অপ্টিমাইজেশনের মাধ্যমে আরও ভাল পারফরম্যান্স অর্জন করতে পারে, যার প্রচুর ব্যবহারের সম্ভাবনা রয়েছে। একই সাথে ঝুঁকি ব্যবস্থাপনার দিকে মনোযোগ দেওয়া প্রয়োজন, তীব্র ওঠানামা দ্বারা ক্ষতি নিয়ন্ত্রণ করা প্রয়োজন।
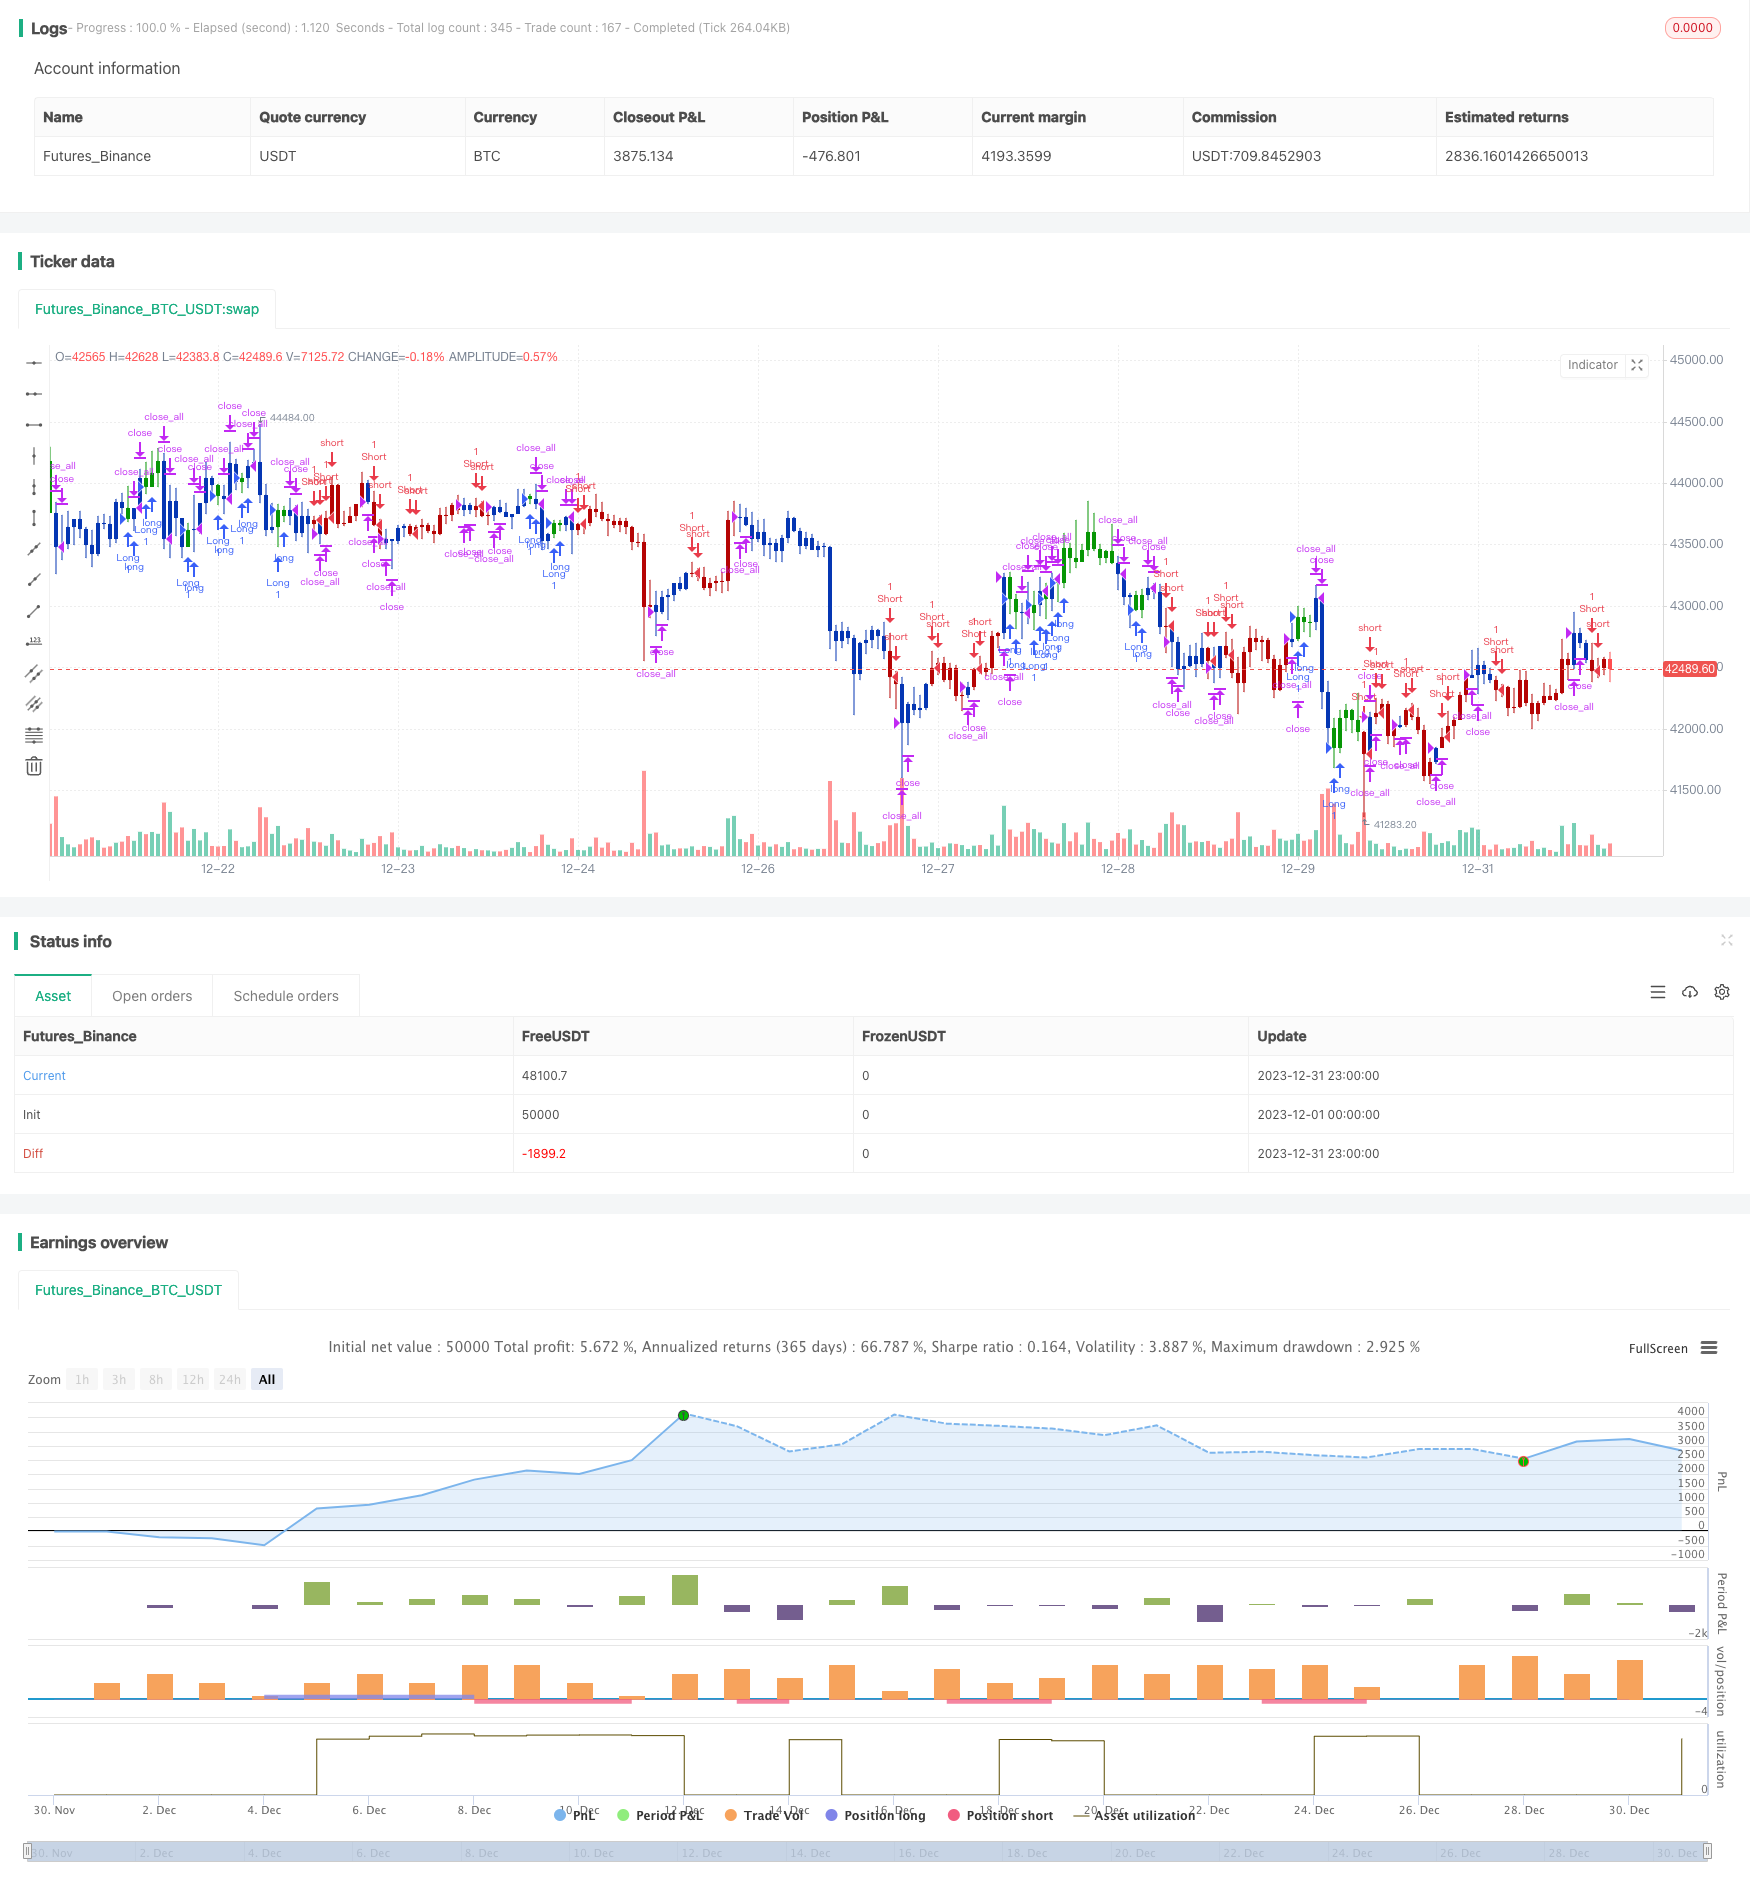
/*backtest
start: 2023-12-01 00:00:00
end: 2023-12-31 23:59:59
period: 1h
basePeriod: 15m
exchanges: [{"eid":"Futures_Binance","currency":"BTC_USDT"}]
*/

//@version=5
////////////////////////////////////////////////////////////
//  Copyright by HPotter v1.0 21/04/2022
// This is combo strategies for get a cumulative signal.
//
// First strategy
// This indicator plots 2/20 exponential moving average. For the Mov
// Avg X 2/20 Indicator, the EMA bar will be painted when the Alert criteria is met.
//
// Second strategy
// This indicator calculates 3 Moving Averages for default values of
// 13, 8 and 5 days, with displacement 8, 5 and 3 days: Median Price (High+Low/2).
// The most popular method of interpreting a moving average is to compare
// the relationship between a moving average of the security's price with
// the security's price itself (or between several moving averages).
//
//
// WARNING:
// - For purpose educate only
// - This script to change bars colors.
////////////////////////////////////////////////////////////
EMA20(Length) =>
    pos = 0.0
    xPrice = close
    xXA = ta.ema(xPrice, Length)
    nHH = math.max(high, high[1])
    nLL = math.min(low, low[1])
    nXS = nLL > xXA or nHH < xXA ? nLL : nHH
    iff_1 = nXS < close[1] ? 1 : nz(pos[1], 0)
    pos := nXS > close[1] ? -1 : iff_1
    pos


BWA3Lines(LLength,MLength,SLength,LOffset,MOffset,SOffset) =>
    pos = 0.0
    xLSma = ta.sma(hl2, LLength)[LOffset]
    xMSma = ta.sma(hl2, MLength)[MOffset]
    xSSma = ta.sma(hl2, SLength)[SOffset]
    pos := close < xSSma and xSSma < xMSma and xMSma < xLSma ? -1 :
    	     close > xSSma and xSSma > xMSma and xMSma > xLSma ? 1 : nz(pos[1], 0)
    pos

strategy(title='Combo 2/20 EMA & Bill Williams Averages. 3Lines', shorttitle='Combo', overlay=true)
var I1 = '●═════ 2/20 EMA ═════●'
Length = input.int(14, minval=1, group=I1)
var I2 = '●═════ 3Lines ═════●'
LLength = input.int(13, minval=1, group=I2)
MLength = input.int(8,minval=1, group=I2)
SLength = input.int(5,minval=1, group=I2)
LOffset = input.int(8,minval=1, group=I2)
MOffset = input.int(5,minval=1, group=I2)
SOffset = input.int(3,minval=1, group=I2)
var misc = '●═════ MISC ═════●'
reverse = input.bool(false, title='Trade reverse', group=misc)
var timePeriodHeader = '●═════ Time Start ═════●'
d = input.int(1, title='From Day', minval=1, maxval=31, group=timePeriodHeader)
m = input.int(1, title='From Month', minval=1, maxval=12, group=timePeriodHeader)
y = input.int(2005, title='From Year', minval=0, group=timePeriodHeader)
StartTrade = time > timestamp(y, m, d, 00, 00) ? true : false
posEMA20 = EMA20(Length)
prePosBWA3Lines = BWA3Lines(LLength,MLength,SLength,LOffset,MOffset,SOffset)
iff_1 = posEMA20 == -1 and prePosBWA3Lines == -1 and StartTrade ? -1 : 0
pos = posEMA20 == 1 and prePosBWA3Lines == 1 and StartTrade ? 1 : iff_1
iff_2 = reverse and pos == -1 ? 1 : pos
possig = reverse and pos == 1 ? -1 : iff_2
if possig == 1
    strategy.entry('Long', strategy.long)
if possig == -1
    strategy.entry('Short', strategy.short)
if possig == 0
    strategy.close_all()
barcolor(possig == -1 ? #b50404 : possig == 1 ? #079605 : #0536b3)