ব্রেকআউট ঊর্ধ্বমুখী প্রবণতার জন্য রেফারেন্স কৌশল
ওভারভিউ
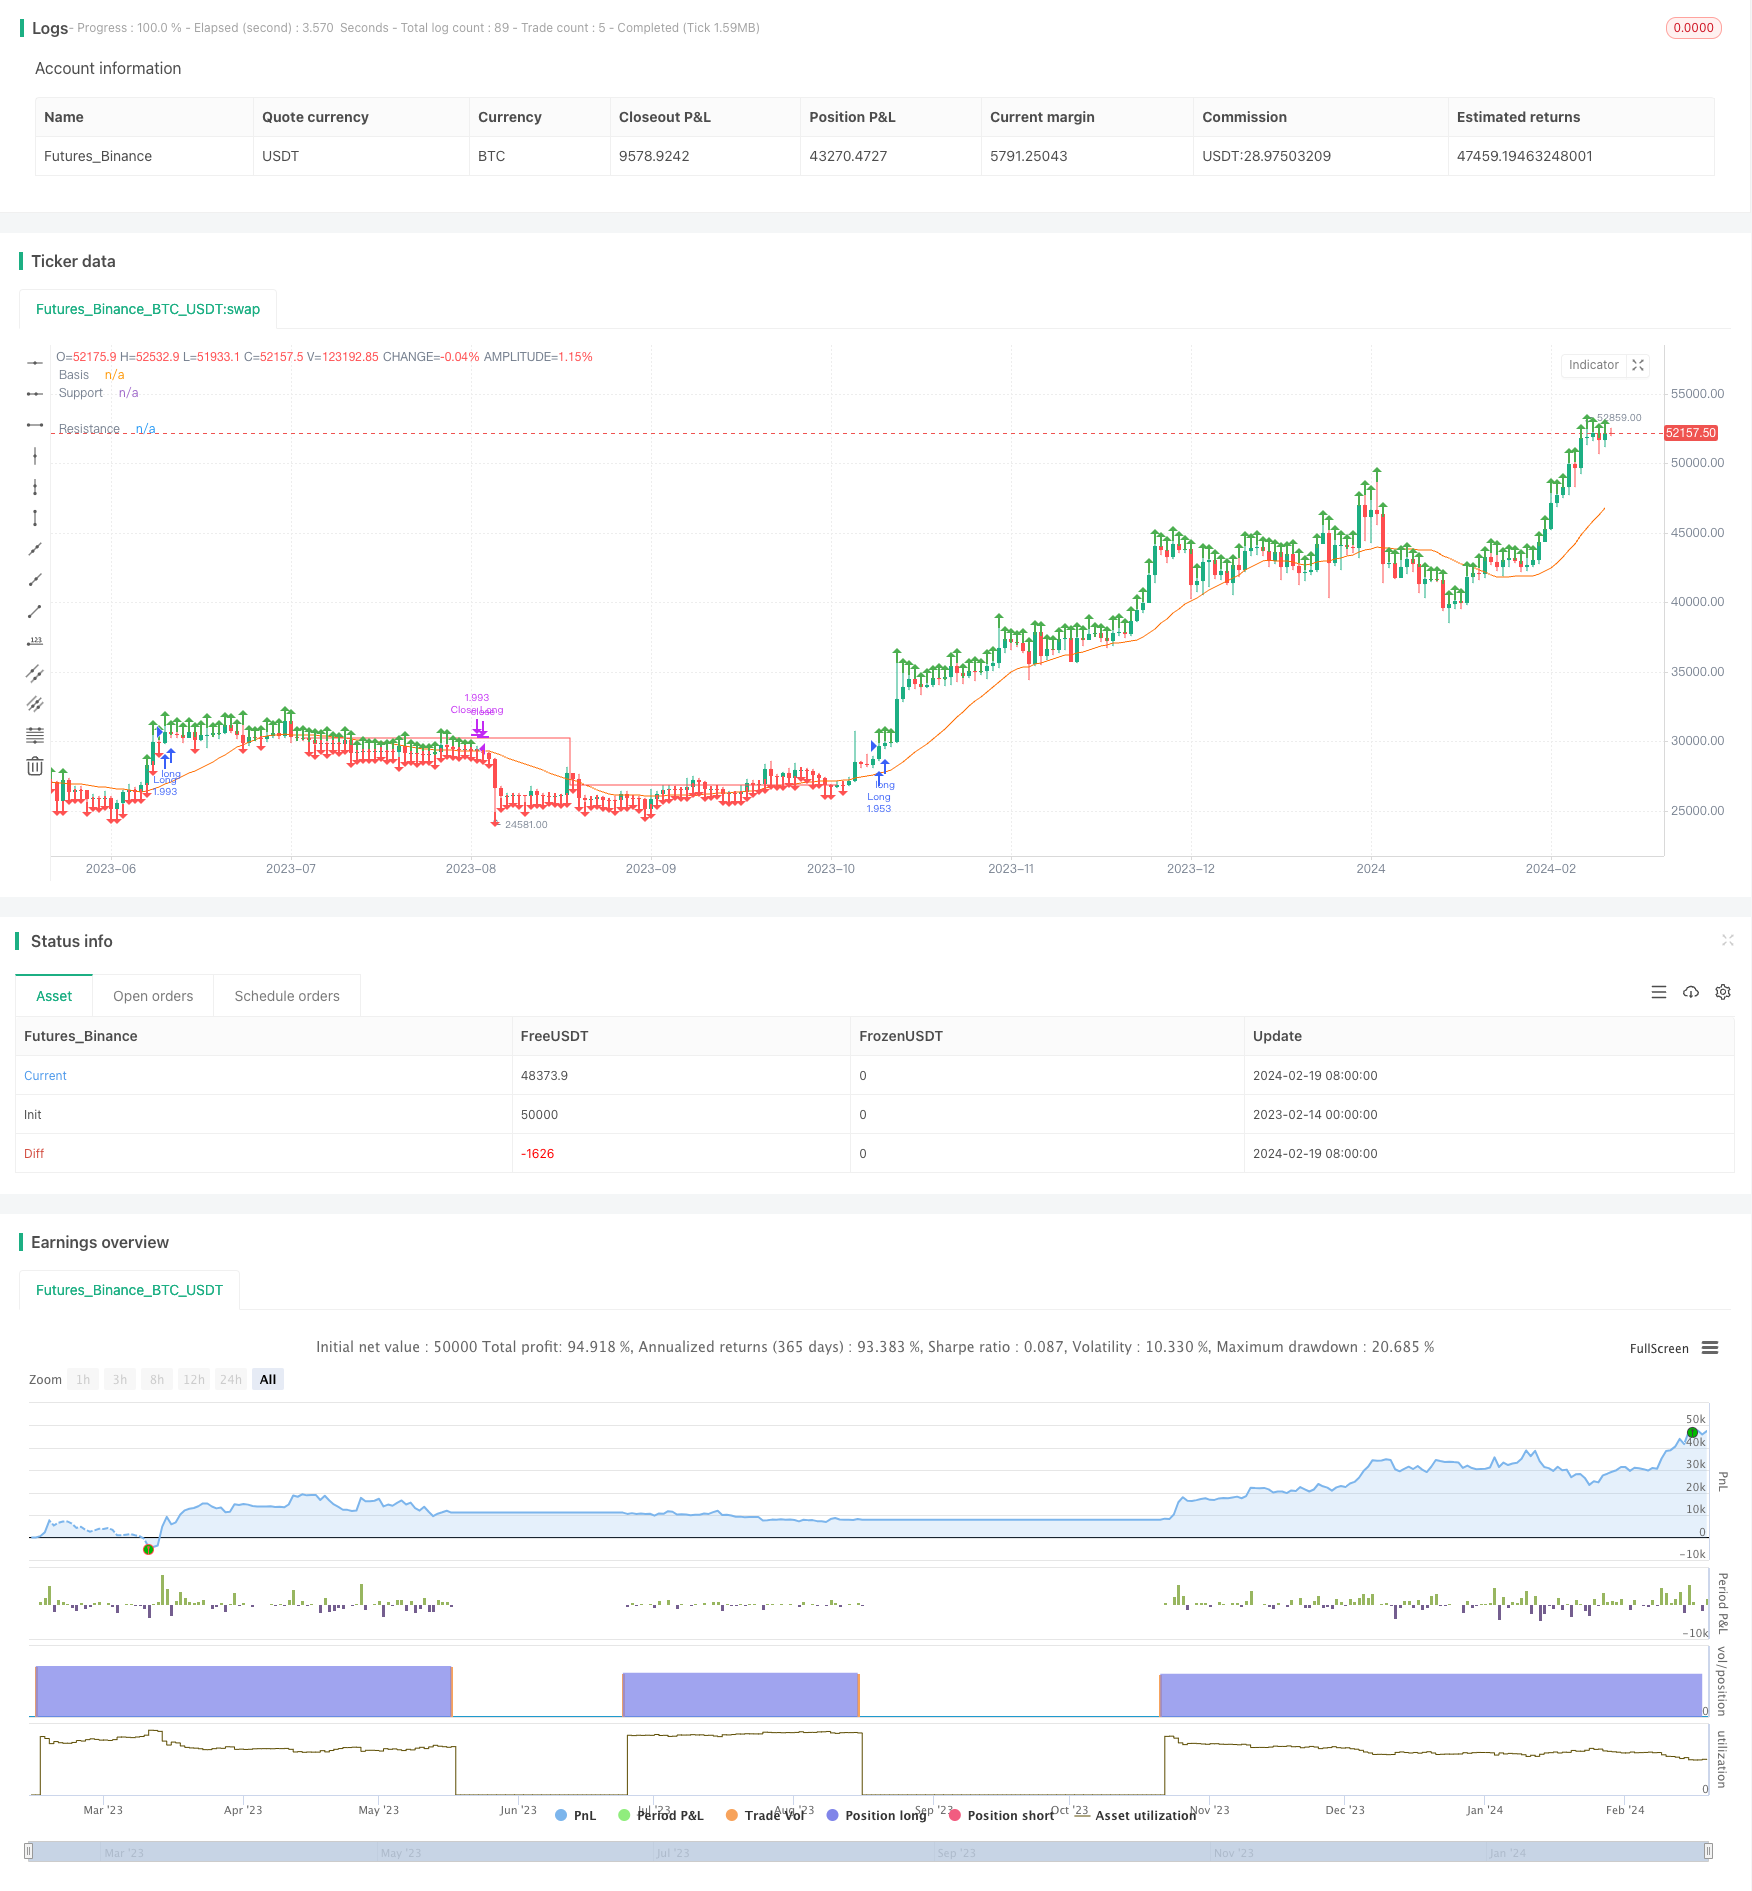
এই কৌশলটি একটি দীর্ঘ লাইন হোল্ডিং কৌশল যা একটি সরল চলমান গড়ের উপর ভিত্তি করে প্রবণতার দিক নির্ধারণ করে এবং প্রতিরোধের সমর্থনকারী লাইনগুলির সাথে একটি বিরতি সংকেত তৈরি করে। দামের পিভট উচ্চতা এবং পিভট নিম্নের গণনা করে, প্রতিরোধের লাইন এবং সমর্থন লাইনগুলি আঁকুন, যখন দাম প্রতিরোধের লাইনটি ভেঙে যায় তখন আরও বেশি করুন, যখন সমর্থন লাইনটি ভেঙে যায় তখন প্লেইন করুন। এই কৌশলটি প্রবণতাযুক্ত স্টকগুলির জন্য উপযুক্ত, যা একটি ভাল ঝুঁকি-ফিট অনুপাত অর্জন করতে পারে।
কৌশল নীতি
- একটি প্রবণতা নির্ণয় করার জন্য একটি বেঞ্চমার্ক হিসাবে 20 দিনের সরল চলমান গড় গণনা করা
- ব্যবহারকারীর ইনপুট প্যারামিটারগুলির উপর ভিত্তি করে পিভট হাইপস এবং পিভট লোস গণনা করুন
- পিভট উচ্চতা এবং পিভট নিম্নতা অনুযায়ী প্রতিরোধের লাইন এবং সমর্থন লাইন আঁকুন
- যখন বন্ধের মূল্য প্রতিরোধের লাইনের উপরে থাকে, তখন অতিরিক্ত প্রবেশ করুন
- যখন সাপোর্ট লাইন রেসপন্স লাইন অতিক্রম করে তখন প্লেইন করুন
এই কৌশলটি একটি সাধারণ চলমান গড় ব্যবহার করে সামগ্রিক প্রবণতার দিকনির্দেশনা নির্ধারণ করে এবং তারপরে মূল পয়েন্টগুলি ব্যবহার করে একটি ট্রেডিং সংকেত তৈরি করে। এটি একটি আদর্শ ব্রেক-টাইপ কৌশল। মূল পয়েন্ট এবং প্রবণতা বিচার করে, জাল ব্রেকগুলিকে কার্যকরভাবে ফিল্টার করা যায়।
সামর্থ্য বিশ্লেষণ
- কৌশলগত সুযোগ প্রচুর, উচ্চ অস্থিরতা স্টক জন্য উপযুক্ত, প্রবণতা ধরা সহজ
- রিস্ক কন্ট্রোল, রিস্ক রিটার্নের চেয়ে বেশি
- ব্রেকিং সিগন্যাল ব্যবহার করে ভুয়া ব্রেকিংয়ের ঝুঁকি এড়ানো
- কাস্টমাইজযোগ্য প্যারামিটার, অভিযোজিত
ঝুঁকি বিশ্লেষণ
- প্যারামিটার অপ্টিমাইজেশনের উপর নির্ভরশীল, ভুল প্যারামিটারগুলি মিথ্যা ভাঙ্গার সম্ভাবনা বাড়িয়ে তোলে
- ব্রেকিং সিগন্যাল বিলম্বিত, কিছু সুযোগ মিস হতে পারে
- ভূমিকম্পে ক্ষতিগ্রস্ত হতে পারে
- সমর্থন লাইন সময়মত পরিবর্তন না করলে ক্ষতি হতে পারে
স্টপ লস স্টপ কৌশলগুলির সাথে একত্রে রিয়েল-টাইম অপ্টিমাইজেশান প্যারামিটারগুলি ব্যবহার করে ঝুঁকি হ্রাস করা যেতে পারে।
অপ্টিমাইজেশান দিক
- চলমান গড়ের চক্রের প্যারামিটারগুলি অপ্টিমাইজ করুন
- সমর্থন প্রতিরোধের লাইন প্যারামিটার অপ্টিমাইজ করুন
- স্টপ লস স্টপ কৌশল যুক্ত করুন
- ব্রেকথ্রু নিশ্চিতকরণ ব্যবস্থা
- ট্রেডিং ভলিউম সহ সূচকগুলি ফিল্টার করুন
সারসংক্ষেপ
সামগ্রিকভাবে, এই কৌশলটি একটি আদর্শ ব্রেকথ্রু কৌশল, যা প্যারামিটার অপ্টিমাইজেশান এবং তরলতার উপর নির্ভর করে, ট্রেডারদের জন্য উপযুক্ত যারা প্রবণতা অনুসরণ করে। একটি রেফারেন্স ফ্রেমওয়ার্ক হিসাবে, প্রকৃত প্রয়োজন অনুসারে মডিউলগুলি প্রসারিত করা যেতে পারে, যা স্টপ লস স্টপ, সিগন্যাল ফিল্টারিং ইত্যাদির মাধ্যমে ঝুঁকি হ্রাস করে এবং স্থিতিশীলতা বাড়ায়।
/*backtest
start: 2023-02-14 00:00:00
end: 2024-02-20 00:00:00
period: 1d
basePeriod: 1h
exchanges: [{"eid":"Futures_Binance","currency":"BTC_USDT"}]
*/

// This source code is subject to the terms of the Mozilla Public License 2.0 at https://mozilla.org/MPL/2.0/
// © CheatCode1

//@version=5
strategy("Quantitative Trend Strategy- Uptrend long", 'Steady Uptrend Strategy', overlay=true, initial_capital = 1500, default_qty_value = 100, commission_type = strategy.commission.percent, commission_value = 0.01, default_qty_type = strategy.percent_of_equity)


length = input.int(20, minval=1)
src = input(close, title="Source")
basis = ta.sma(src, length)
offset = input.int(0, "Offset", minval = -500, maxval = 500)
plot(basis, "Basis", color=#FF6D00, offset = offset)

inp1 = input.int(46, 'LookbackLeft')
inp2 = input.int(32, 'LookbackRight')

l1 = ta.pivothigh(close, inp1, inp2)
S1 = ta.pivotlow(close, inp1, inp2)

// plot(l1, 'Pivothigh', color.red, 1)
// // plot(S1, 'Pivot Low', color.red)

l1V = ta.valuewhen(l1, close, 0)
S1V = ta.valuewhen(S1, close, 0)

Plotl1 = not na(l1) ? l1V : na
PlotS1 = not na(S1) ? S1V : na

plot(Plotl1, 'Resistance', color.green, 1, plot.style_stepline, true)
plot(PlotS1, 'Support', color.red, 1, plot.style_stepline, true)

Priceforlong = close > l1V ? true : na
Priceforshort = close < S1V ? true : na

plotshape(Priceforlong ? high : na, 'p', shape.arrowup, location.abovebar, color.green, size = size.small)
plotshape(Priceforshort ? low : na, 's', shape.arrowdown, location.belowbar, color.red, size = size.small)

vol = volume
volma = ta.sma(vol, 20)

Plotl1C = ta.valuewhen(na(Plotl1), l1V, 0)
PlotS1C = ta.valuewhen(na(PlotS1), S1V, 0)
//Strategy Execution
volc = volume > volma

Lc1 = Priceforlong

Sc1 = Priceforshort

sL = Plotl1 < PlotS1 ? close : na
sS = PlotS1 > Plotl1 ? close : na


if Lc1
    strategy.entry('Long', strategy.long)
// if Sc1 and C2
//     strategy.entry('Short', strategy.short)

if Priceforshort
    strategy.cancel('Long')
if Priceforlong
    strategy.cancel('Short')


// Stp1 = ta.crossover(k, d)
// Ltp1 = ta.crossunder(k, d)
// Ltp = d > 70  ? Ltp1 : na
// Stp = d < 30  ? Stp1 : na


if strategy.openprofit >= 0 and sL
    strategy.close('Long')
if strategy.openprofit >= 0 and sS
    strategy.close('Short')
takeP = input.float(2, title='Take Profit') / 100
stopL = input.float(1.75, title='Stop Loss') / 100


// // Pre Directionality

Stop_L = strategy.position_avg_price * (1 - stopL)

Stop_S = strategy.position_avg_price * (1 + stopL)

Take_S= strategy.position_avg_price * (1 - takeP)

Take_L = strategy.position_avg_price * (1 + takeP)

// sL = Plotl1 < PlotS1 ? close : na
// sS = PlotS1 < Plotl1 ? close : na

// //Post Excecution
if strategy.position_size > 0 and not (Lc1)
    strategy.exit("Close Long", stop = Stop_L, limit = Take_L)

if strategy.position_size < 0 and not (Sc1)
    strategy.exit("Close Short", stop = Stop_S, limit = Take_S)