TrendScalp-FractalBox-3EMA ist ein
Schriftsteller:ChaoZhang, Datum: 23.5.2022 UhrTags:EMA
Es gibt viele Indikatoren mit William
Wichtige Punkte:
Das EMA-Breitband wird mit 3 EMA
DISCLAIMER: Dieser Indikator wurde nur zu Lernzwecken erstellt und stellt keine Anlageberatung dar. Dieser Indikator sollte nicht als Ersatz für umfangreiche unabhängige Marktforschung verwendet werden, bevor Sie Ihre tatsächlichen Handelsentscheidungen treffen. Marktdaten oder andere Inhalte können jederzeit ohne Vorankündigung geändert werden. Die Haftung für Verluste oder Schäden, einschließlich, aber nicht beschränkt auf Verluste von Gewinnen, die sich direkt oder indirekt aus der Verwendung dieses Indikators ergeben, liegt bei dem Benutzer, der ihn verwendet.
Zurückprüfung
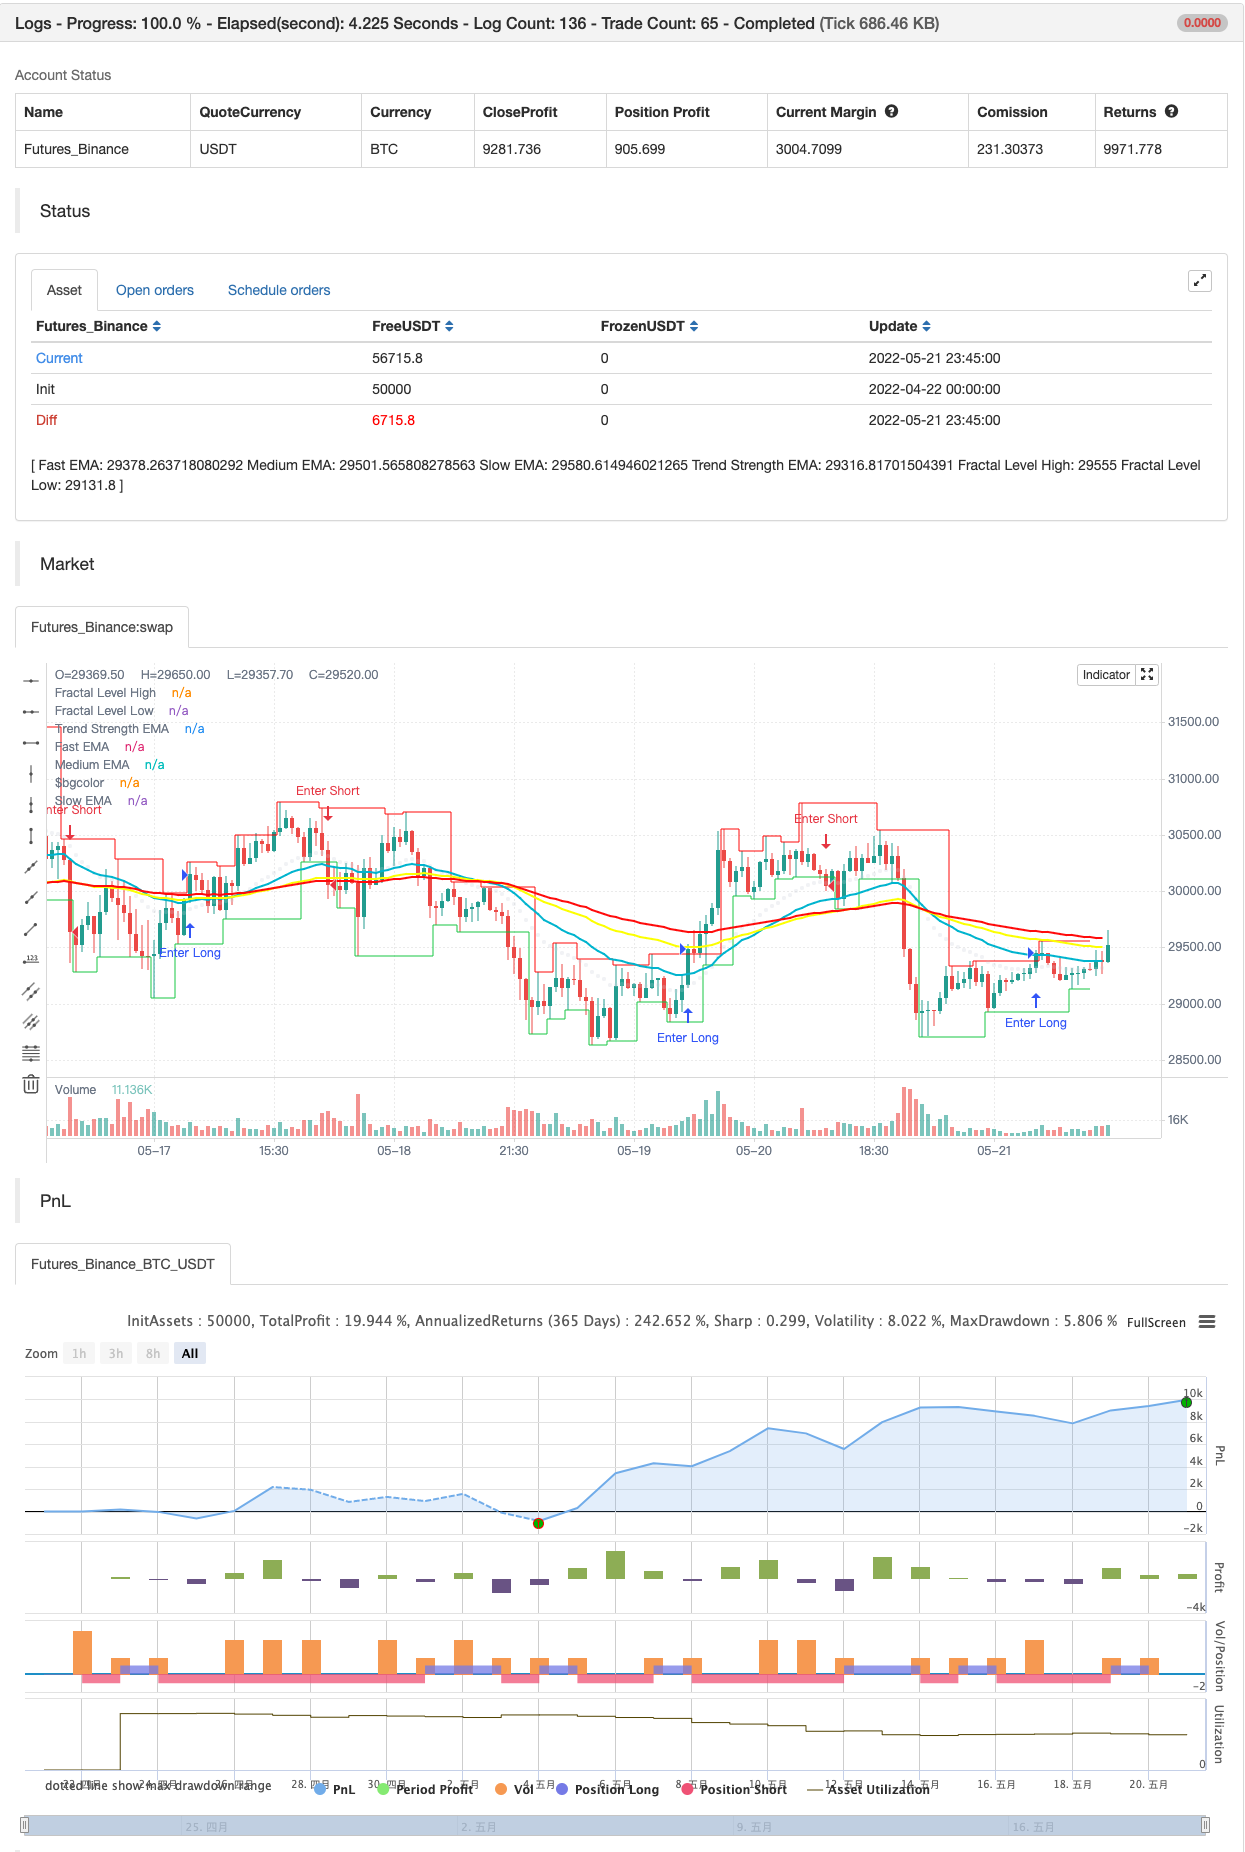
/*backtest
start: 2022-04-22 00:00:00
end: 2022-05-21 23:59:00
period: 45m
basePeriod: 5m
exchanges: [{"eid":"Futures_Binance","currency":"BTC_USDT"}]
*/

//@version=5

indicator('[VDB]TrendScalp-FractalBox-3EMA', shorttitle='[VDB]TS-FB-3EMA', overlay=true, max_lines_count=500)

// By: ©vireshdb/vdb/vdb007
//
//Description:
//          There are many indicators with William’s Fractal and Alligator. As many use EMA’s it may be useful to define an EMA ribbon and
//          combining Fractal levels/box (filling background between top and bottom fractals) for trend scalping. I searched for this kind of indicator in community – some show fractals,
//          some just levels, some with alligator etc.but couldn't find the one needed. Hence thought of this indicator which may be of interest to other users too.
//Key Points:
//          EMA ribbon is created using3 EMA’s 35/70/105. Users can change these as per their preference. This is used for trend identification –
//              1. Bullish bias if Price > EMA1 > EMA2 > EMA3. 2. Bearish bias if Price < EMA1 < EMA2 < EMA3.
//          Background is marked during crossing of EMA1 and EMA2 to alert possible change in trend.
//          5-bar fractals are used to mark the Fractal levels and backgrounds between top and bottom fractals are filled to create the Fractal Box.
//          Fractal levels are marked with offset 2 only when the fractal formation is complete and hence are lagging.
//How to Use:
//          Sloping EMA ribbon is used for identifying the trend.
//          Trend strength ema is enabled. Angle of 30degree and above is strength
//          Fractal box break-out/ break-downs are used to trigger the trade with fractal high/low for entry/stoploss.
//              - Waiting for price contraction towards EMA ribbon resulting in smaller boxes is key to initiate trade.
//              - Avoid bigger boxes as SL’s will be big and price may move within.
//              - To draw the vertical lines of FractalBox change fractal level0 style to stepline.
//          This indicator -
//              - Combined with the cycle/ banded indicators such as CCI/Stochastic/RSI etc can make it a good trend scalping setup
//              - While trading in the direction of momentum in higher timeframe.
// Reference : This indicator was achieved by combing some fractal ideas from "Fractal Framer by brobear"
//
// Copyright 2022 vireshdb
//
// This program is free software: you can redistribute it and/or modify
// it under the terms of the GNU General Public License as published by
// the Free Software Foundation, either version 3 of the License, or
// any later version.
//
// This program is distributed in the hope that it will be useful,
// but WITHOUT ANY WARRANTY; without even the implied warranty of
// MERCHANTABILITY or FITNESS FOR A PARTICULAR PURPOSE.  See the
// GNU General Public License for more details.
//
// The GNU General Public License can be found here
// <http://www.gnu.org/licenses/>.
//
// Start of code *************************************************************************************************

showema = input.bool(true, title='Show EMA Ribbon')
fastema = input.int(35, title='Fast EMA', minval=1)
medema = input.int(70, title='Medium EMA', minval=1)
slowema = input.int(105, title='Slow EMA', minval=1)
trstrema = input.int(20, title='Trend Strength EMA', minval=1)
EMA1 = ta.ema(close, fastema)
EMA2 = ta.ema(close, medema)
EMA3 = ta.ema(close, slowema)
TSEMA = ta.ema(close, trstrema)

plot(showema and fastema ? EMA1 : na, title='Fast EMA', color=color.new(#00bcd4, 0), linewidth=2)
plot(showema and medema ? EMA2 : na, title='Medium EMA', color=color.new(#fcff00, 0), linewidth=2)
plot(showema and slowema ? EMA3 : na, title='Slow EMA', color=color.new(#ff0909, 0), linewidth=2)
plot(showema and trstrema ? TSEMA : na, title='Trend Strength EMA', color=color.new(#d1d4dc, 75), linewidth=1, style=plot.style_circles)

bgcolor(color=ta.crossover(EMA1, EMA2) ? color.new(color.lime, 90) : ta.crossunder(EMA1, EMA2) ? color.new(color.red, 90) : na, title='Trend Marker')

// FRACTAL Levels and Box *******************************************************************************************
PlotFractLevel = input(defval=true, title='Show Fractal Levels and Box')
lnwidth = input.int(defval=1, title='Fractal Line Width', minval=1, maxval=3)

//----- Main ---------------------
fractLevelHigh = float(na)
fractLevelLow = float(na)
fractHigh = bool(na)
fractLow = bool(na)
lag = 0
lag := 2
fractHigh := high[4] <= high[2] and high[3] <= high[2] and high[2] > high[1] and high[2] > high ? true : false
fractLow := low[4] >= low[2] and low[3] >= low[2] and low[2] < low[1] and low[2] < low ? true : false

// Fractal levels
fractLevelHigh := fractHigh ? nz(high[lag], high) : nz(fractLevelHigh[1], high)
fractLevelLow := fractLow ? nz(low[lag], low) : nz(fractLevelLow[1], low)

//---- Plotting Fractal levels ---------------------
p1 = plot(PlotFractLevel ? fractLevelHigh : na, title='Fractal Level High', color=color.new(#ff0909, 0), linewidth=lnwidth, offset=-lag, style=plot.style_stepline)
p2 = plot(PlotFractLevel ? fractLevelLow : na, title='Fractal Level Low', color=color.new(#1bce4e, 0), linewidth=lnwidth, offset=-lag, style=plot.style_stepline)
fill(p1, p2, title='Fill Fractal Box', color=fractLevelHigh >= fractLevelLow ? color.new(#d1d4dc,90) : color.new(#fff59d, 90))

// Alert conditions
alertcondition(close > nz(fractLevelHigh, high), title='Above Fractal Level High', message='Fractal High Breakout')
alertcondition(close < nz(fractLevelLow, low), title='Below Fractal Level Low', message='Fractal Low Breakdown')

// End of FRACTAL Levels and Box ****************************************************************************************
// End of code***********************************************************************************************************

if close > nz(fractLevelHigh, high)
    strategy.entry("Enter Long", strategy.long)
else if close < nz(fractLevelLow, low)
    strategy.entry("Enter Short", strategy.short)
- Handelsstrategie auf der Grundlage von aufeinanderfolgenden MACD-Gold- und Todeskreuzungen
- Erweiterte Bollinger Bands RSI-Handelsstrategie
- Strategie für die dreifache EMA-Überschreitung
- Exponential Moving Average Crossover Leverage-Strategie
- GM-8 & ADX Doppel gleitende Durchschnittsstrategie
- Erweiterte EMA-Crossover-Strategie mit RSI/MACD/ATR
- Z-Score-Trend nach Strategie
- Langzeit-Eintritt auf EMA-Kreuzung mit Risikomanagementstrategie
- VWAP-Handelsstrategie
- WaveTrend Kreuz LazyBear Strategie
- AlphaTradingBot Handelsstrategie
- MACD-Reloaded-Strategie
- Supertrended gleitende Durchschnitte
- Handel mit ABC
- 15min BTCUSDTPERP BOT
- Shannon-Entropie V2
- Supertrend mit dem Trailing-Stopp-Verlust
- Volumenfluss v3
- Krypto-Futures-Stundenscalping mit ma & rsi - ogcheckers
- ATR ausgeglichen
- Bestellblock-Finder
- QQE-Signale
- U-Bit-Gitterspannungsfilter
- CM MACD-Anzeiger - Mehrfacher Zeitrahmen - V2
- HODL LINE
- 2 Bewegliche Durchschnittsfarbrichtung
- Scalping PullBack-Tool R1
- Die Kauf- und Verkaufsstrategie hängt von AO+Stoch+RSI+ATR ab.
- EMA-Trend-Wolke
- RedK Volumen-Beschleunigte Richtungsenergie-Verhältnis
- Donchian Breakout keine Ummalung