Super Trend V Strategie

Überblick
Die Übertrend-V-Strategie ist eine Short-Line-Trading-Strategie, die auf Moving Averages und Standard Differences basiert. Sie verwendet die Super Trend-Anzeige, um die Trendrichtung des Preises zu bestimmen, in Kombination mit der Unterstützung und dem Widerstand, der durch die Moving Averages gebildet wird.
Strategieprinzip
Die Strategie berechnet zunächst den Super Trend, der die Richtung des Trends anhand der Beziehung zwischen ATR und dem Preis bestimmen soll. Wenn der Preis über dem Aufwärtstrend liegt, ist er positiv, wenn der Preis unter dem Abwärtstrend liegt, ist er negativ.
Dann berechnen Sie den Moving Average EMA des Preises und den Moving Average EMA des Eröffnungspreises, der als Kaufsignal gilt, wenn der Preis über dem Moving Average liegt und über dem Eröffnungsmittelwert liegt, und als Verkaufsignal, wenn der Preis unter dem Moving Average liegt und unter dem Eröffnungsmittelwert liegt.
Dann berechnen Sie die Auf- und Abfahrt des Preiskanals mit Hilfe der Standardabweichung und führen Sie eine glatte Verarbeitung durch. Wenn der Preis die Standardabweichung überschreitet, wird das Stoppsignal ausgelöst, wenn der Preis die Standardabweichung überschreitet, wird das Stoppsignal ausgelöst.
Schließlich werden die Bewegenden Durchschnitte aus verschiedenen Zeiträumen kombiniert, um die Richtung des Trends zu bestimmen, kombiniert mit dem Super Trend-Indikator, um eine stabile Tendenz zu bestimmen.
Strategische Vorteile
- Verwenden Sie den Super Trend-Indikator, um die Richtung der Preisentwicklung zu bestimmen und eine Trendwende zu vermeiden, die zu Verlusten führt.
- Der Moving Average in Kombination mit dem Startpreis hilft bei der Ermittlung der Einstiegszeit und verhindert falsche Durchbrüche.
- Standard-Differenz-Kanal, um potenzielle Unterstützungs- und Widerstandsbereiche zu prognostizieren und einen Stop-Loss-Preis zu setzen
- Mehrfache Zeiträume, kombiniert mit Trends, erhöhen die Stabilität
Strategisches Risiko
- Die Super Trend-Indikatoren sind zurückgeblieben und könnten einen Trendwechsel verpassen
- Der bewegliche Durchschnitt erzeugt ein Verzögerungssignal, der nicht zum richtigen Zeitpunkt eingesetzt wird.
- Der Standarddeviation-Kanal ist zu fixiert, um die Marktschwankungen in Echtzeit zu reflektieren.
- Mehrere Zeitspannen können sich widersprechen
Die Risiken können auf folgende Weise gelöst werden:
- Die Super Trend-Parameter werden entsprechend verkürzt, um die Sensitivität zu erhöhen
- Optimierung der Moving-Average-Periode oder Hinzufügung anderer Indikatoren zur Einschätzung
- Dynamische Anpassung der Standard-Differenz-Kanalparameter, um die Bandbreite an den Markt anzupassen
- Festlegung einer klaren Mehrzyklus-Urteilslogik, um mögliche Konflikte zu behandeln
Richtung der Strategieoptimierung
- Optimierung der Super Trend-Parameter auf der Suche nach der besten Kombination
- Versuchen Sie es mit anderen Indikatoren in Kombination mit einem Moving Average.
- Versuchen Sie, die Standarddeviation-Kanalparameter dynamisch anzupassen
- Versuche verschiedene Kombinationen von mehreren Perioden und finde die passende Periode
- Optimierung von Stop-Loss-Stopp-Strategien zur Erhöhung der Gewinnspanne
Zusammenfassen
Die Übertrend-V-Strategie integriert die Vorzüge von Indikatoren wie Trends, Durchschnittslinien und Standard-Differenz-Kanäle, um die Richtung der Trendentscheidung zu stabilisieren, die richtige Einstiegsmomente zu wählen und eine kurze Handelsstrategie für die Stop-Loss-Stopp-Optimierung in der Preiszone einzurichten. Verbesserungen durch Parameteroptimierung, Indikatoroptimierung und Stop-Loss-Stopp-Optimierung können die Strategie-Stabilität und die Profitabilität verbessern.
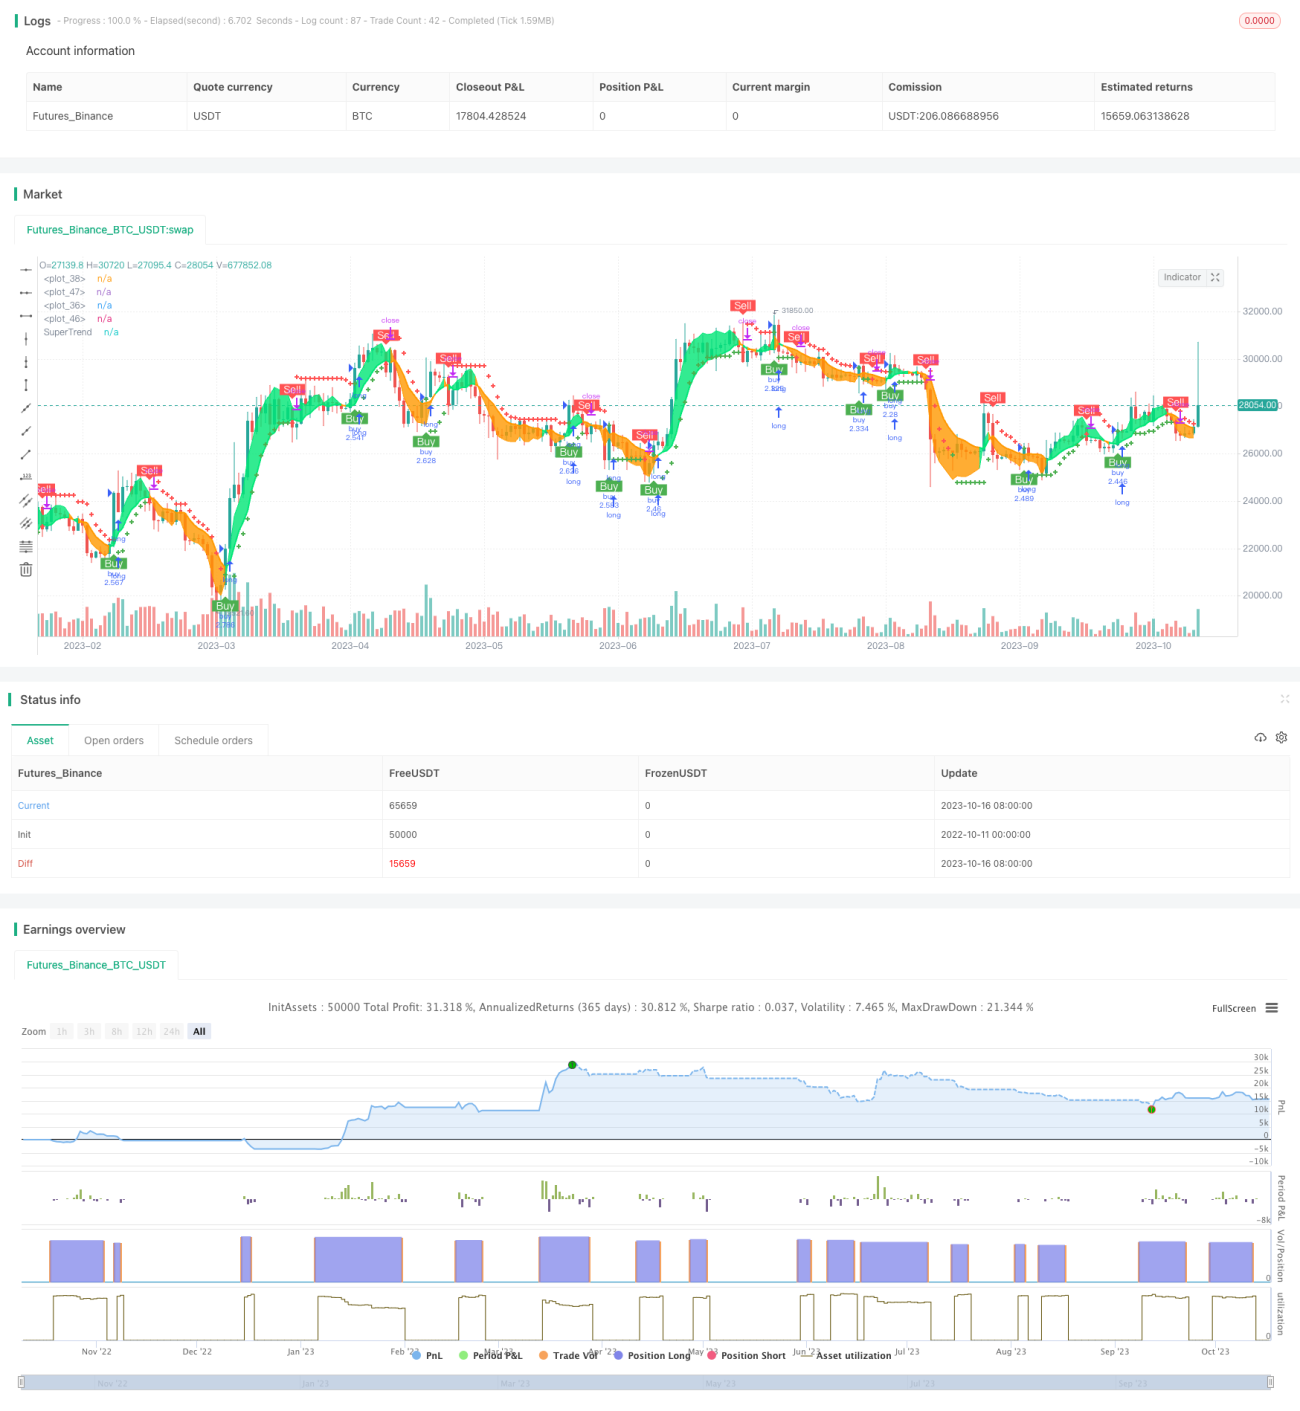
/*backtest
start: 2022-10-11 00:00:00
end: 2023-10-17 00:00:00
period: 1d
basePeriod: 1h
exchanges: [{"eid":"Futures_Binance","currency":"BTC_USDT"}]
*/

// © theCrypster 2020

//@version=4
strategy(title = "Super trend V Strategy version", overlay = true, pyramiding=1,initial_capital = 1000, default_qty_type= strategy.percent_of_equity, default_qty_value = 100, calc_on_order_fills=false, slippage=0,commission_type=strategy.commission.percent,commission_value=0.075)- 1