
Die Strategie nutzt verschiedene technische Indikatoren wie beispielsweise Moving Averages und Oscillators, die in Kombination mit Durchschnittskursen die Kursentwicklung und die Wendepunkte identifizieren und Kauf- und Verkaufsaktionen durchführen.
Die Strategie besteht aus folgenden Teilen:
Auswahl des Zeitraums: Setzen Sie die Anzahl der Minuten im Zeitrahmen der K-Linienkarte, z. B. 1 Minute, 5 Minuten usw.
Wählen Sie den Moving Average: Konfigurieren Sie die Parameter für die häufig verwendeten Moving Averages wie EMA, SMA, 10-Tage-Linie, 20-Tage-Linie usw.
Auswahl der Schokkindicator: Parameter für Schokkindicator wie RSI, MACD, William und andere.
Berechnung von Kauf- und Verkaufssignalen: Berechnung der Werte der Moving Averages und Schwankungsindikatoren mit Hilfe von benutzerdefinierten Funktionen. Ein Kaufsignal wird erzeugt, wenn die kurzfristige Durchschnittslinie über die langfristige Durchschnittslinie fällt; ein Verkaufsignal wird erzeugt, wenn die kurzfristige Durchschnittslinie unter die langfristige Durchschnittslinie fällt.
Rating-System: Die Kauf- und Verkaufssignale der einzelnen Indikatoren werden numerisch bewertet, dann wird der Durchschnitt genommen, um den Gesamtbewertungsindex zu erhalten. Der Bewertungsindex ist größer als 0 für Kaufsignale und kleiner als 0 für Verkaufssignale.
Handelssignale: Erzeugen Sie ein endgültiges Handelssignal, um zu kaufen oder zu verkaufen, je nachdem, ob der Ratingindex größer oder kleiner als 0 ist.
Die Strategie kombiniert verschiedene Indikatoren, um die Preistrends und Wendepunkte zu identifizieren und die Signalsicherheit zu erhöhen. Die Durchschnittslinie ist ein effektiver Trendtechnischer Signal, der in Kombination mit den Schwingungsindikatoren dazu beiträgt, falsche Durchbrüche zu vermeiden. Die Bewertungssysteme machen die Handelssignale auch klarer.
Diese Risiken können durch folgende Maßnahmen verringert werden:
Die Strategie kann in folgenden Bereichen weiter optimiert werden:
Zusammenfassend lässt sich sagen, dass die Strategie die Durchschnittsbrechungen und verschiedene Indikatoren integriert, um die Preisentwicklung effektiv zu identifizieren. Es ist jedoch erforderlich, die Optimierung ständig zu testen und die Risiken zu kontrollieren. In Zukunft können Verbesserungen in Bezug auf die Kombination von Aktien, Parameteroptimierung und Verluststopps vorgenommen werden.
Die Strategie basiert auf dem Durchschreiten der Mittellinie als primärem Handelssignal, unterstützt durch die Bestätigung durch verschiedene Stagnationskennzahlen und erzeugt mit einem Bewertungssystem eindeutige Kauf- und Verkaufssignale. Die Strategie ist in der Lage, Preistrends und Wendepunkte effektiv zu identifizieren, erfordert jedoch die Kontrolle der Handelsfrequenz, die Senkung der Handelskosten und -risiken und die kontinuierliche Optimierung der Parameter.
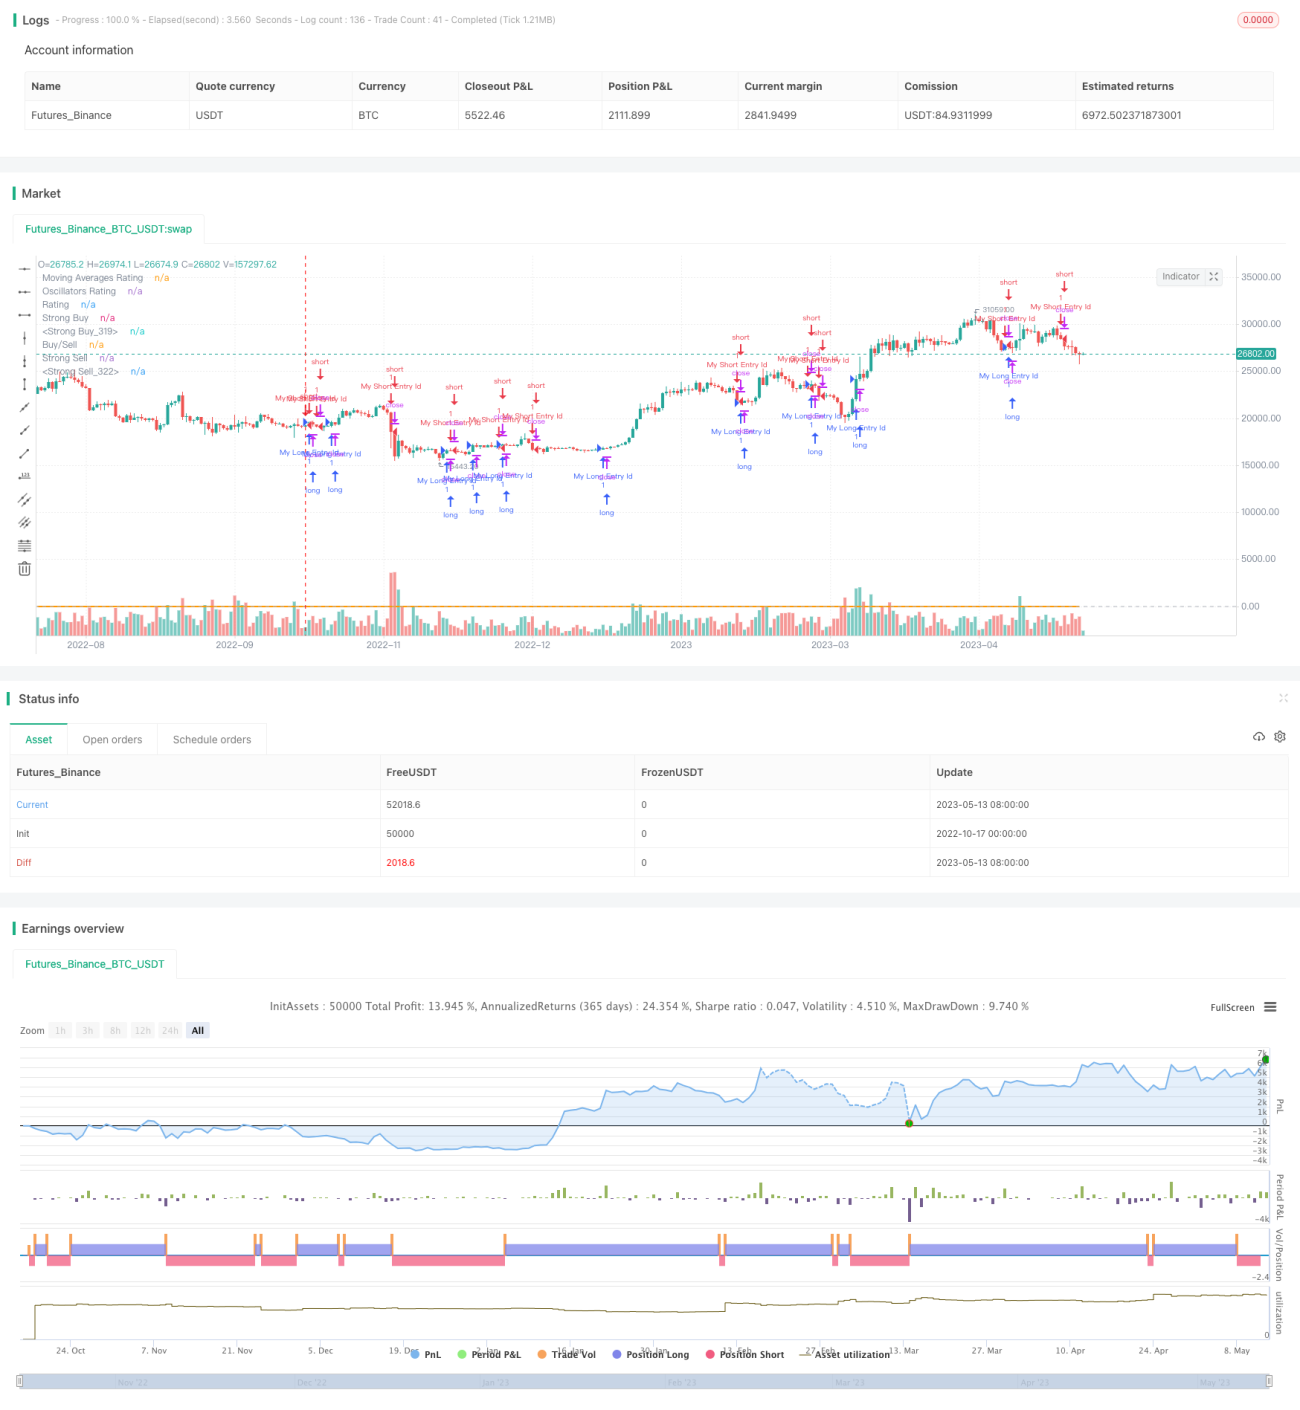
/*backtest
start: 2022-10-17 00:00:00
end: 2023-05-14 00:00:00
period: 1d
basePeriod: 1h
exchanges: [{"eid":"Futures_Binance","currency":"BTC_USDT"}]
*/
//@version=4
strategy("TV Signal", overlay=true, initial_capital = 500, currency = "USD")
// -------------------------------------- GLOBAL SELECTION --------------------------------------------- //
//res = input(defval="5" , title="resolution " , type=resolution)
res_num = input("240", title="Resolution (minutes)", options=["1", "5", "15", "60", "240"] )
res = res_num
src = close
// -----------------------------------MOVING AVERAGES SELECTION----------------------------------------- //
// EMAS input
ema10 = 10
ema20 = 20
ema30 = 30
ema50 = 50
ema100 = 100
ema200 = 200
// SMAS input
sma10 = 10
sma20 = 20
sma30 = 30
sma50 = 50
sma100 = 100
sma200 = 200
// Ichimoku - is not active in the calculation brought to you by TV TEAM for the lolz
// VWMA
vwma20 = 20
// Hull
hma9 = 9
// -----------------------------------OSCILLATORS SELECTION----------------------------------------- //
//RSI
rsi_len = input(14, minval=1, title="RSI Length")
//STOCH K
stoch_k = input(14, minval=1, title="STOCH K")
stoch_d = input(3, minval=1, title="STOCH D")
stoch_smooth = input(3, minval=1, title="STOCH Smooth")
//CCI
cci_len = input(20, minval=1, title="CCI Length")
//Momentum
momentum_len = input(10, minval=1, title="Momentum Length")
//MACD
macd_fast = input(12, title="MACD fast")
macd_slow = input(27, title="MACD slow")
//ADX
adxlen = input(14, title="ADX Smoothing")
dilen = input(14, title="DI Length")
//BBP
bbp_len = input(13, title="BBP EMA Length")
//William Percentage Range
wpr_length = input(14, minval=1, title="William Perc Range Length")
//Ultimate Oscillator
uo_length7 = input(7, minval=1, title="UO Length 7"), uo_length14 = input(14, minval=1, title="UO Length 14"), uo_length28 = input(28, minval=1, title="UO Length 28")
// -------------------------------------- FUNCTIONS - Moving Averages -------------------------------------- //
// Simple Moving Averages Calculation Function - SELL indicator values < price // BUY – indicator values > price
calc_sma_index(len, src, res) =>
sma_val = request.security(syminfo.tickerid, res, sma(src, len))
sma_index = if( sma_val > close )
-1
else
1
sma_index
// Exponential Moving Averages Calculation Function - SELL indicator values < price // BUY – indicator values > price
calc_ema_index(len, src, res) =>
ema_val = request.security(syminfo.tickerid, res, sma(src, len))
ema_index = if( ema_val > close )
-1
else
1
ema_index
// Hull Moving Averages Calculation Function - SELL indicator values < price // BUY – indicator values > price
calc_hull_index(len, src, res) =>
hull_val = request.security(syminfo.tickerid, res, wma(2*wma(src, len/2)-wma(src, len), round(sqrt(len))))
hull_index = if( hull_val > close )
-1
else
1
hull_index
// VW Moving Averages Calculation Function - SELL indicator values < price // BUY – indicator values > price
calc_vwma_index(len, src, res) =>
vwma_val = request.security(syminfo.tickerid, res, vwma(src, len))
vwma_index = if( vwma_val > close )
-1
else
1
vwma_index
// -------------------------------------- FUNCTIONS - Oscillators -------------------------------------- //
// RSI indicator < lines that represent oversold conditions(70) and indicator values are rising = -1
// RSI indicator > lines that represent overbought conditions(30) and indicator values are falling = +1
calc_rsi_index(len, src, res) =>
up = rma(max(change(src), 0), len)
down = rma(-min(change(src), 0), len)
rsi = down == 0 ? 100 : up == 0 ? 0 : 100 - (100 / (1 + up / down))
rsi_res = request.security(syminfo.tickerid, res, rsi)
rsi_change = rsi_res - rsi_res[1]
rsi_index = 0
if( rsi_res > 70 and rsi_change < 0 )
rsi_index := -1
if( rsi_res < 30 and rsi_change > 0 )
rsi_index := 1
rsi_index
// STOCH indicator – main line < lower band (20) and main line crosses the signal line from bottom-up
// STOCH indicato – main line > upper band (80) and main line crosses the signal line from above-down
calc_stoch_index(len_k, len_d, smoothK, res) =>
stoch_k = sma(stoch(close, high, low, len_k), smoothK)
stoch_d = sma(stoch_k, len_d)
res_stoch_k = request.security(syminfo.tickerid, res, stoch_k)
res_stoch_d = request.security(syminfo.tickerid, res, stoch_d)
spread = (res_stoch_k/res_stoch_d -1)*100
stoch_index = 0
if( res_stoch_k > 80 and spread < 0 )
stoch_index := -1
if( res_stoch_k < 20 and spread > 0 )
stoch_index := 1
stoch_index
// CCI indicator – indicator < oversold level (-100) and reversed upwards
// CCI indicator – indicator > overbought level (100) and reversed downwards
calc_cci_index(len, src, res) =>
cci_ma = sma(src, len)
cci = (src - cci_ma) / (0.015 * dev(src, len))
cci_res = request.security(syminfo.tickerid, res, cci)
cci_change = cci_res - cci_res[1]
cci_index = 0
if( cci_res > 100 and cci_change > 0 )
cci_index := -1
if( cci_res < -100 and cci_change < 0 )
cci_index := 1
cci_index
//AWESOME OSCILLATOR – saucer and values are greater than 0 or zero line cross from bottom-up - BUY
//AWESOME OSCILLATOR – saucer and values are lower than 0 or zero line cross from above-down - SELL
calc_awesome_index(src, res) =>
ao = sma(hl2,5) - sma(hl2,34)
ao_res = request.security(syminfo.tickerid, res, ao)
ao_change = ao_res - ao_res[1]
ao_index = 0
if( ao_res > 0 and ao_change > 0 )
ao_index := 1
if( ao_res < 0 and ao_change < 0 )
ao_index := -1
ao_index
// Momentum indicator - indicator values are rising - BUY
// Momentum indicator - indicator values are falling - SELL
calc_momentum_index(len, src, res) =>
mom = src - src[len]
res_mom = request.security(syminfo.tickerid, res, mom)
mom_index = 0
if res_mom>= 0
mom_index := 1
if res_mom <= 0
mom_index := -1
mom_index
// MACD - main line values > signal line values - BUY
// MACD - main line values < signal line values - SELL
calc_macd_index(macd_fast, macd_slow, src, res) =>
macd = ema(src, macd_fast) - ema(src, macd_slow)
res_macd = request.security(syminfo.tickerid, res, macd)
macd_index = 0
if res_macd>= 0
macd_index := 1
if res_macd <= 0
macd_index := -1
macd_index
//STOCHRSI - main line < lower band (20) and main line crosses the signal line from bottom-up
//STOCHRSI - main line > upper band (80) and main line crosses the signal line from above-down
calc_stochrsi_index(len_rsi, len_stoch, smoothK, smoothD, src, res) =>
rsi = rsi(src, len_rsi)
stoch_k = sma(stoch(rsi, rsi, rsi, len_stoch), smoothK)
stoch_d = sma(stoch_k, smoothD)
res_stoch_k = request.security(syminfo.tickerid, res, stoch_k)
res_stoch_d = request.security(syminfo.tickerid, res, stoch_d)
spread = (res_stoch_k/res_stoch_d -1)*100
stochrsi_index = 0
if( res_stoch_k > 80 and spread < 0 )
stochrsi_index := -1
if( res_stoch_k < 20 and spread > 0 )
stochrsi_index := 1
stochrsi_index
//Williams % Range - line is above -20 and values are dropping - Overbough conditions - SELL
//Williams % Range - line is below -80 and values are rising - Oversold conditions - BUY
calc_wpr_index(len, src, res) =>
wpr_upper = highest(len)
wpr_lower = lowest(len)
wpr = 100 * (src - wpr_upper) / (wpr_upper - wpr_lower)
wpr_res = request.security(syminfo.tickerid, res, wpr)
wpr_change = wpr_res - wpr_res[1]
wpr_index = 0
if( wpr_res < -80 and wpr_change > 0 )
wpr_index := 1
if( wpr_res > -20 and wpr_change < 0 )
wpr_index := -1
wpr_index
//Ultimate Oscillator - line is above -20 and values are dropping - Overbough conditions - SELL
//Ultimate Oscillator - line is below -80 and values are rising - Oversold conditions - BUY
average(bp, tr_, length) => sum(bp, length) / sum(tr_, length)
calc_uo_index(len7, len14, len28, res) =>
high_ = max(high, close[1])
low_ = min(low, close[1])
bp = close - low_
tr_ = high_ - low_
avg7 = average(bp, tr_, len7)
avg14 = average(bp, tr_, len14)
avg28 = average(bp, tr_, len28)
uo = 100 * (4*avg7 + 2*avg14 + avg28)/7
uo_res = request.security(syminfo.tickerid, res, uo)
uo_index = 0
if uo_res >= 70
uo_index := 1
if uo_res <= 30
uo_index := -1
uo_index
//Average Directional Index - indicator > 20 and +DI line crossed -DI line from bottom-up
//Average Directional Index - indicator > 20 and +DI line crossed -DI line from above-down
dirmov(len) =>
up = change(high)
down = -change(low)
truerange = rma(tr, len)
plus = fixnan(100 * rma(up > down and up > 0 ? up : 0, len) / truerange)
minus = fixnan(100 * rma(down > up and down > 0 ? down : 0, len) / truerange)
[plus, minus]
adx(dilen, adxlen) =>
[plus, minus] = dirmov(dilen)
sum = plus + minus
adx = 100 * rma(abs(plus - minus) / (sum == 0 ? 1 : sum), adxlen)
adxHigh(dilen, adxlen) =>
[plus, minus] = dirmov(dilen)
plus
adxLow(dilen, adxlen) =>
[plus, minus] = dirmov(dilen)
minus
calc_adx_index(res) =>
sig = adx(dilen, adxlen) //ADX
sigHigh = adxHigh(dilen, adxlen) // DI+
sigLow = adxLow(dilen, adxlen) // DI-
res_sig = request.security(syminfo.tickerid, res, sig)
res_sigHigh = request.security(syminfo.tickerid, res, sigHigh)
res_sigLow = request.security(syminfo.tickerid, res, sigLow)
spread = (res_sigHigh/res_sigLow -1)*100
adx_index = 0
if res_sig >= 20 and spread > 0
adx_index := 1
if res_sig >= 20 and spread < 0
adx_index := -1
adx_index
//Bull Bear Power Index - bear power is below 0 and is weakening -> BUY
//Bull Bear Power Index - bull power is above 0 and is weakening -> SELL
calc_bbp_index(len, src, res ) =>
ema = ema(src, len)
bulls = high - ema
bears = low - ema
bulls_res = request.security(syminfo.tickerid, res, bulls)
bears_res = request.security(syminfo.tickerid, res, bears)
sum = bulls_res + bears_res
bbp_index = 0
if bears_res < 0 and bears_res > bears_res[1]
bbp_index := 1
if bulls_res > 0 and bulls_res < bulls_res[1]
bbp_index := -1
bbp_index
// --------------------------------MOVING AVERAGES CALCULATION------------------------------------- //
sma10_index = calc_sma_index(sma10, src, res)
sma20_index = calc_sma_index(sma20, src, res)
sma30_index = calc_sma_index(sma30, src, res)
sma50_index = calc_sma_index(sma50, src, res)
sma100_index = calc_sma_index(sma100, src, res)
sma200_index = calc_sma_index(sma200, src, res)
ema10_index = calc_ema_index(ema10, src, res)
ema20_index = calc_ema_index(ema20, src, res)
ema30_index = calc_ema_index(ema30, src, res)
ema50_index = calc_ema_index(ema50, src, res)
ema100_index = calc_ema_index(ema100, src, res)
ema200_index = calc_ema_index(ema200, src, res)
hull9_index = calc_ema_index(hma9, src, res)
vwma20_index = calc_ema_index(vwma20, src, res)
ichimoku_index = 0.0 //Ichimoku - is not active in the calculation brought to you by TV TEAM for the lolz
moving_averages_index = ( ema10_index + ema20_index + ema30_index + ema50_index + ema100_index + ema200_index +
sma10_index + sma20_index + sma30_index + sma50_index + sma100_index + sma200_index +
ichimoku_index + vwma20_index + hull9_index ) / 15
// -----------------------------------OSCILLATORS CALCULATION----------------------------------------- //
rsi_index = calc_rsi_index(rsi_len, src, res)
stoch_index = calc_stoch_index(stoch_k, stoch_d, stoch_smooth, res)
cci_index = calc_cci_index(cci_len, src, res)
ao_index = calc_awesome_index(src, res)
mom_index = calc_momentum_index(momentum_len, src, res)
macd_index = calc_macd_index(macd_fast, macd_slow, src, res)
stochrsi_index = calc_stochrsi_index(rsi_len, stoch_k, stoch_d, stoch_smooth, src, res)
wpr_index = calc_wpr_index(wpr_length, src, res)
uo_index = calc_uo_index(uo_length7, uo_length14, uo_length28, res)
adx_index = calc_adx_index(res)
bbp_index = calc_bbp_index(bbp_len , src, res)
oscillators_index = ( rsi_index + stoch_index + adx_index + cci_index + stochrsi_index + ao_index + mom_index + macd_index + wpr_index + uo_index + bbp_index ) / 11
rating_index = ( moving_averages_index + oscillators_index ) / 2
plot(moving_averages_index, color=green, linewidth = 1, title="Moving Averages Rating",transp = 70)
plot(oscillators_index , color=blue, linewidth = 1, title="Oscillators Rating",transp = 70)
plot(rating_index , color=orange, linewidth = 2, title="Rating")
strongbuy = hline(1, "Strong Buy" , color=silver )
buy = hline(0.5, "Strong Buy" , color=green )
normal = hline(0, "Buy/Sell" , color=silver )
sell = hline(-0.5,"Strong Sell", color=red )
strongsell = hline(-1, "Strong Sell", color=silver )
fill(strongbuy,buy, color=green, transp=90)
fill(buy,normal, color=#b2ffb2, transp=90)
fill(sell,normal, color=#F08080, transp=90)
fill(strongsell,sell, color=red, transp=90)
longCondition = rating_index > 0
if (longCondition)
strategy.entry("My Long Entry Id", strategy.long)
shortCondition = rating_index < 0
if (shortCondition)
strategy.entry("My Short Entry Id", strategy.short)