Adaptive Stop-Profit- und Stop-Loss-Strategie basierend auf dualen Zeitrahmen und Momentum-Indikatoren
Überblick
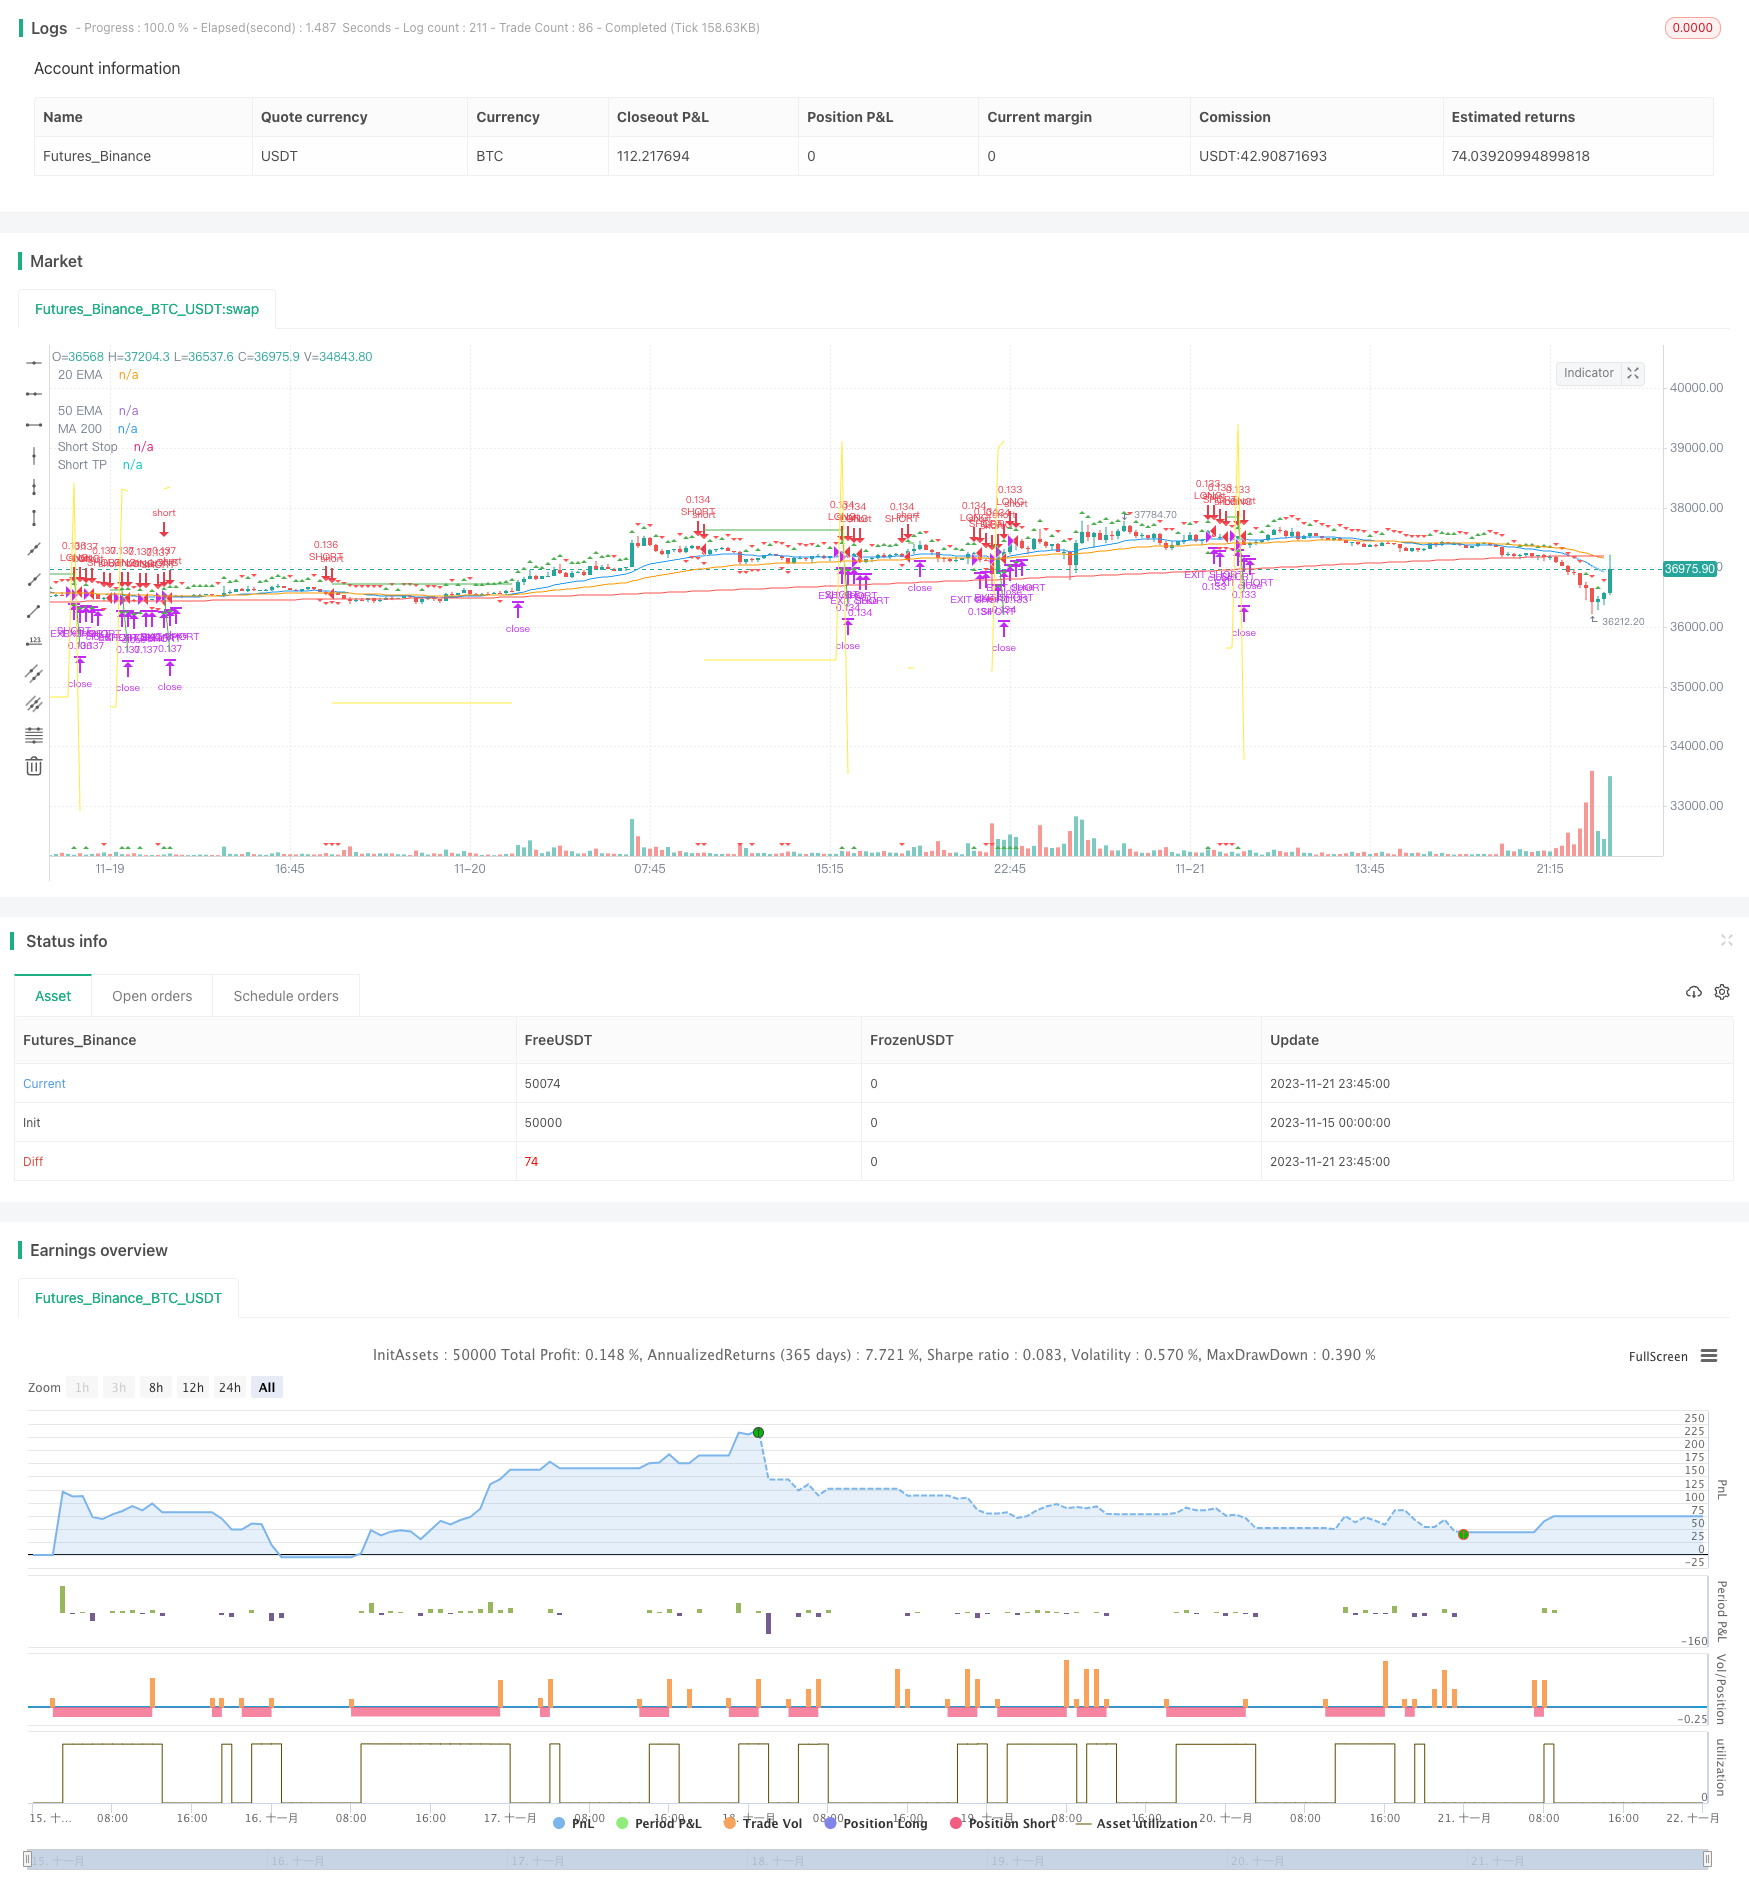
Die Strategie nutzt eine Kombination aus zwei Zeitfenstern und Dynamikindikatoren, um eine anpassungsfähige Stop-Loss zu realisieren. Die Hauptzeitfenster überwachen die Richtung des Trends, die Hilfszeitfenster dienen zur Bestätigung der Signale. Wenn die beiden Richtungen übereinstimmen, werden Handelssignale erzeugt. Nach der Markteinführung werden die Stop-Loss- und Stop-Loss-Positionen mit fortlaufenden Stopps aktualisiert.
Strategieprinzip
Die Hauptzeitrahmen verwenden die lineare Regression der Sqqueeze Momentum (SQM), um Trends zu beurteilen. Die Hilfszeitrahmen verwenden die EMA-Kombination der SQM, um falsche Signale zu filtern.
Wenn die Hauptgrafik SQM nach oben durchbricht und die Hilfsgrafik SQM auch nach oben geht, machen Sie mehr; wenn die Hauptgrafik SQM nach unten durchbricht und die Hilfsgrafik SQM auch nach unten geht, machen Sie eine Lücke.
Nach dem Eintritt wird der anfängliche Stop-Loss und der Stop-Loss nach den Eingabeparametern festgelegt. Wenn der Preis den Stop-Loss erreicht, werden die Stop-Loss und der Stop-Loss aktualisiert. Die spezifische Methode ist: Der Stop-Loss erhöht sich proportional, der Stop-Loss nimmt proportional ab, um einen progressiven Stop-Loss zu erreichen.
Strategische Vorteile
Doppelte Zeitrahmen filtern falsche Signale, um die Genauigkeit zu gewährleisten.
Der SQM-Indikator beurteilt die Richtung der Trends und vermeidet die Störung durch Marktgeräusche.
Anpassung von Stop-Loss-Mechanismen, maximale Gewinnbindung und effektive Risikokontrolle.
Risikoanalyse
Die SQM-Indikatorparameter sind falsch eingestellt und können einen Trendwendepunkt verpassen, was zu Verlusten führt.
Die falsche Auswahl des Zeitrahmens der Hilfsdiagramme filtert die Geräusche nicht effektiv und führt zu Fehltransaktionen.
Die Stop-Loss-Marge ist zu hoch gesetzt, sodass ein einziger Verlust schwerwiegend sein kann.
Optimierungsrichtung
SQM-Indikatorparameter müssen an die verschiedenen Märkte angepasst werden, um ihre Sensibilität zu gewährleisten.
Die Hilfszeitrahmen erfordern auch Tests mit verschiedenen Zeitspannen, um zu sehen, welche die beste Filterung erzeugen.
Die Stop-Loss-Werte sind nicht feststehend, sondern lassen sich in einer Bandbreite einstellen, die sich an den Marktschwankungen anpasst.
Zusammenfassen
Die Strategie ist insgesamt sehr praktisch, bi-Zeitrahmen mit Dynamik-Indikatoren Trends zu beurteilen, und die Verwendung von adaptive Stop-Loss-Methode zu stabilen Gewinn. Durch die Optimierung der SQM-Indikator-Parameter, unterstützt Grafik-Zyklus und Stop-Loss-Margin-Einstellungen, kann die Strategie die Wirkung zu verbessern, lohnt sich in der Realität angewendet und optimiert werden.
/*backtest
start: 2023-11-15 00:00:00
end: 2023-11-22 00:00:00
period: 15m
basePeriod: 5m
exchanges: [{"eid":"Futures_Binance","currency":"BTC_USDT"}]
*/

//@version=4
strategy("SQZ Multiframe Strategy", overlay=true, default_qty_type=strategy.percent_of_equity, default_qty_value=10)
fast_ema_len = input(11, minval=5, title="Fast EMA")
slow_ema_len = input(34, minval=20, title="Slow EMA")
sqm_lengthKC = input(20, title="SQM KC Length")
kauf_period = input(20, title="Kauf Period")
kauf_mult = input(2,title="Kauf Mult factor")
min_profit_sl = input(5.0, minval=1, maxval=100, title="Min profit to start moving SL [%]")
longest_sl = input(10, minval=1, maxval=100, title="Maximum possible of SL [%]")
sl_step = input(0.5, minval=0.0, maxval=1.0, title="Take profit factor")
// ADMF
CMF_length = input(11, minval=1, title="CMF length") // EMA27 = SMMA/RMA14 ~ lunar month
show_plots = input(true, title="Show plots")

lower_resolution = timeframe.period=='1'?'5':timeframe.period=='5'?'15':timeframe.period=='15'?'30':timeframe.period=='30'?'60':timeframe.period=='60'?'240':timeframe.period=='240'?'D':timeframe.period=='D'?'W':'M'
higher_resolution = timeframe.period=='5'?'1':timeframe.period=='15'?'5':timeframe.period=='30'?'15':timeframe.period=='60'?'30':timeframe.period=='240'?'60':timeframe.period=='D'?'240':timeframe.period=='W'?'D':'W'

// Calculate Squeeze Momentum
sqm_val = linreg(close - avg(avg(highest(high, sqm_lengthKC), lowest(low, sqm_lengthKC)),sma(close,sqm_lengthKC)), sqm_lengthKC,0)
sqm_val_high = security(syminfo.tickerid, higher_resolution, linreg(close - avg(avg(highest(high, sqm_lengthKC), lowest(low, sqm_lengthKC)),sma(close,sqm_lengthKC)), sqm_lengthKC,0), lookahead=barmerge.lookahead_on)
sqm_val_low = security(syminfo.tickerid, lower_resolution, linreg(close - avg(avg(highest(high, sqm_lengthKC), lowest(low, sqm_lengthKC)),sma(close,sqm_lengthKC)), sqm_lengthKC,0), gaps=barmerge.gaps_off, lookahead=barmerge.lookahead_on)

// Emas
high_close = security(syminfo.tickerid, higher_resolution, close, lookahead=barmerge.lookahead_on)
high_fast_ema = security(syminfo.tickerid, higher_resolution, ema(close, fast_ema_len), lookahead=barmerge.lookahead_on)
high_slow_ema = security(syminfo.tickerid, higher_resolution, ema(close, slow_ema_len), lookahead=barmerge.lookahead_on)
//low_fast_ema = security(syminfo.tickerid, lower_resolution, ema(close, fast_ema_len), lookahead=barmerge.lookahead_on)
//low_slow_ema = security(syminfo.tickerid, lower_resolution, ema(close, slow_ema_len), lookahead=barmerge.lookahead_on)

// CMF
ad = close==high and close==low or high==low ? 0 : ((2*close-low-high)/(high-low))*volume
money_flow = sum(ad, CMF_length) / sum(volume, CMF_length)


// Entry conditions
low_condition_long  = (sqm_val_low > sqm_val_low[1])
low_condition_short = (sqm_val_low < sqm_val_low[1])
money_flow_min = (money_flow[4] > money_flow[3]) and (money_flow[3] > money_flow[2]) and (money_flow[2] < money_flow[1])  and (money_flow[1] < money_flow)
money_flow_max = (money_flow[4] < money_flow[3]) and (money_flow[3] < money_flow[2]) and (money_flow[2] > money_flow[1])  and (money_flow[1] > money_flow)
condition_long = ((sqm_val > sqm_val[1]))  and (money_flow_min or money_flow_min[1] or money_flow_min[2] or money_flow_min[3]) and lowest(sqm_val, 5) < 0
condition_short = ((sqm_val < sqm_val[1])) and (money_flow_max or money_flow_max[1] or money_flow_max[2] or money_flow_max[3]) and highest(sqm_val, 5) > 0
high_condition_long =  true//high_close > high_fast_ema and high_close > high_slow_ema //(high_fast_ema > high_slow_ema) //and (sqm_val_low > sqm_val_low[1])
high_condition_short = true//high_close < high_fast_ema and high_close < high_slow_ema//(high_fast_ema < high_slow_ema) //and (sqm_val_low < sqm_val_low[1])
enter_long = low_condition_long and condition_long and high_condition_long
enter_short = low_condition_short and condition_short and high_condition_short

// Stop conditions
var current_target_price = 0.0
var current_sl_price = 0.0 // Price limit to take profit
var current_target_per = 0.0
var current_profit_per = 0.0

set_targets(isLong, min_profit, current_target_per, current_profit_per) =>
    target = 0.0
    sl = 0.0
    if isLong
        target := close * (1.0 + current_target_per)
        sl := close * (1.0 - (longest_sl/100.0)) // Longest SL
    else
        target := close * (1.0 - current_target_per)
        sl := close * (1.0 + (longest_sl/100.0)) // Longest SL
    [target, sl]

target_reached(isLong, min_profit, current_target_per, current_profit_per) =>
    target = 0.0
    sl = 0.0
    profit_per = 0.0
    target_per = 0.0
    if current_profit_per == 0
        profit_per := (min_profit*sl_step) / 100.0
    else
        profit_per := current_profit_per +  ((min_profit*sl_step) / 100.0)
    target_per := current_target_per + (min_profit / 100.0)
    if isLong
        target := strategy.position_avg_price * (1.0 + target_per)
        sl := strategy.position_avg_price * (1.0 + profit_per)
    else
        target := strategy.position_avg_price * (1.0 - target_per)
        sl := strategy.position_avg_price * (1.0 - profit_per)
    [target, sl, profit_per, target_per]

hl_diff = sma(high - low, kauf_period)
stop_condition_long = 0.0
new_stop_condition_long = low - (hl_diff * kauf_mult)
if (strategy.position_size > 0)
    if (close > current_target_price)
        [target, sl, profit_per, target_per] = target_reached(true, min_profit_sl, current_target_per, current_profit_per)
        current_target_price := target
        current_sl_price := sl
        current_profit_per := profit_per
        current_target_per := target_per


    stop_condition_long := max(stop_condition_long[1], current_sl_price)
else
    stop_condition_long := new_stop_condition_long
stop_condition_short = 99999999.9
new_stop_condition_short = high + (hl_diff * kauf_mult)
if (strategy.position_size < 0)
    if (close < current_target_price)
        [target, sl, profit_per, target_per] = target_reached(false, min_profit_sl, current_target_per, current_profit_per)
        current_target_price := target
        current_sl_price := sl
        current_profit_per := profit_per
        current_target_per := target_per
    stop_condition_short := min(stop_condition_short[1], current_sl_price)
else
    stop_condition_short := new_stop_condition_short


// Submit entry orders
if (enter_long and (strategy.position_size <= 0))
    if (strategy.position_size < 0)
        strategy.close(id="SHORT")
    current_target_per := (min_profit_sl / 100.0)
    current_profit_per := 0.0
    [target, sl] = set_targets(true, min_profit_sl, current_target_per, current_profit_per)
    current_target_price := target
    current_sl_price := sl
    strategy.entry(id="LONG", long=true)
    // if show_plots
    //     label.new(bar_index, high, text=tostring("LONG\nSL: ") + tostring(stop_condition_long), style=label.style_labeldown, color=color.green)

if (enter_short and (strategy.position_size >= 0))
    if (strategy.position_size > 0)
        strategy.close(id="LONG")
    current_target_per := (min_profit_sl / 100.0)
    current_profit_per := 0.0
    [target, sl] = set_targets(false, min_profit_sl, current_target_per, current_profit_per)
    current_target_price := target
    current_sl_price := sl
    strategy.entry(id="SHORT", long=false)
    // if show_plots
        // label.new(bar_index, high, text=tostring("SHORT\nSL: ") + tostring(stop_condition_short), style=label.style_labeldown, color=color.red)

if (strategy.position_size > 0)
    strategy.exit(id="EXIT LONG", stop=stop_condition_long)

if (strategy.position_size < 0)
    strategy.exit(id="EXIT SHORT", stop=stop_condition_short)

// Plot anchor trend
plotshape(low_condition_long, style=shape.triangleup,
                 location=location.abovebar, color=color.green)
plotshape(low_condition_short, style=shape.triangledown,
                 location=location.abovebar, color=color.red)

plotshape(condition_long, style=shape.triangleup,
                 location=location.belowbar, color=color.green)
plotshape(condition_short, style=shape.triangledown,
                 location=location.belowbar, color=color.red)

//plotshape((close < profit_target_short) ? profit_target_short : na, style=shape.triangledown,
//                 location=location.belowbar, color=color.yellow)
plotshape(enter_long, style=shape.triangleup,
                 location=location.bottom, color=color.green)
plotshape(enter_short, style=shape.triangledown,
                 location=location.bottom, color=color.red)

// Plot emas
plot(ema(close, 20), color=color.blue, title="20 EMA")
plot(ema(close, 50), color=color.orange, title="50 EMA")
plot(sma(close, 200), color=color.red, title="MA 200")

// Plot stop loss values for confirmation
plot(series=(strategy.position_size > 0) and show_plots ? stop_condition_long : na,
     color=color.green, style=plot.style_linebr,
     title="Long Stop")
plot(series=(strategy.position_size < 0) and show_plots ? stop_condition_short : na,
     color=color.green, style=plot.style_linebr,
     title="Short Stop")
plot(series=(strategy.position_size < 0) and show_plots ? current_target_price : na,
     color=color.yellow, style=plot.style_linebr,
     title="Short TP")
plot(series=(strategy.position_size > 0) and show_plots ? current_target_price : na,
     color=color.yellow, style=plot.style_linebr,
     title="Long TP")
//plot(series=(strategy.position_size < 0) ? profit_sl_short : na,
//     color=color.gray, style=plot.style_linebr,
//     title="Short Stop")