Crossover-Optimierungsstrategie mit gleitendem Durchschnitt und mehreren Zeitskalen
Erstellungsdatum:
2024-01-05 12:05:42
zuletzt geändert:
2024-01-05 12:05:42
Kopie:
2
Klicks:
898
1
konzentrieren Sie sich auf
1750
Anhänger
Überblick
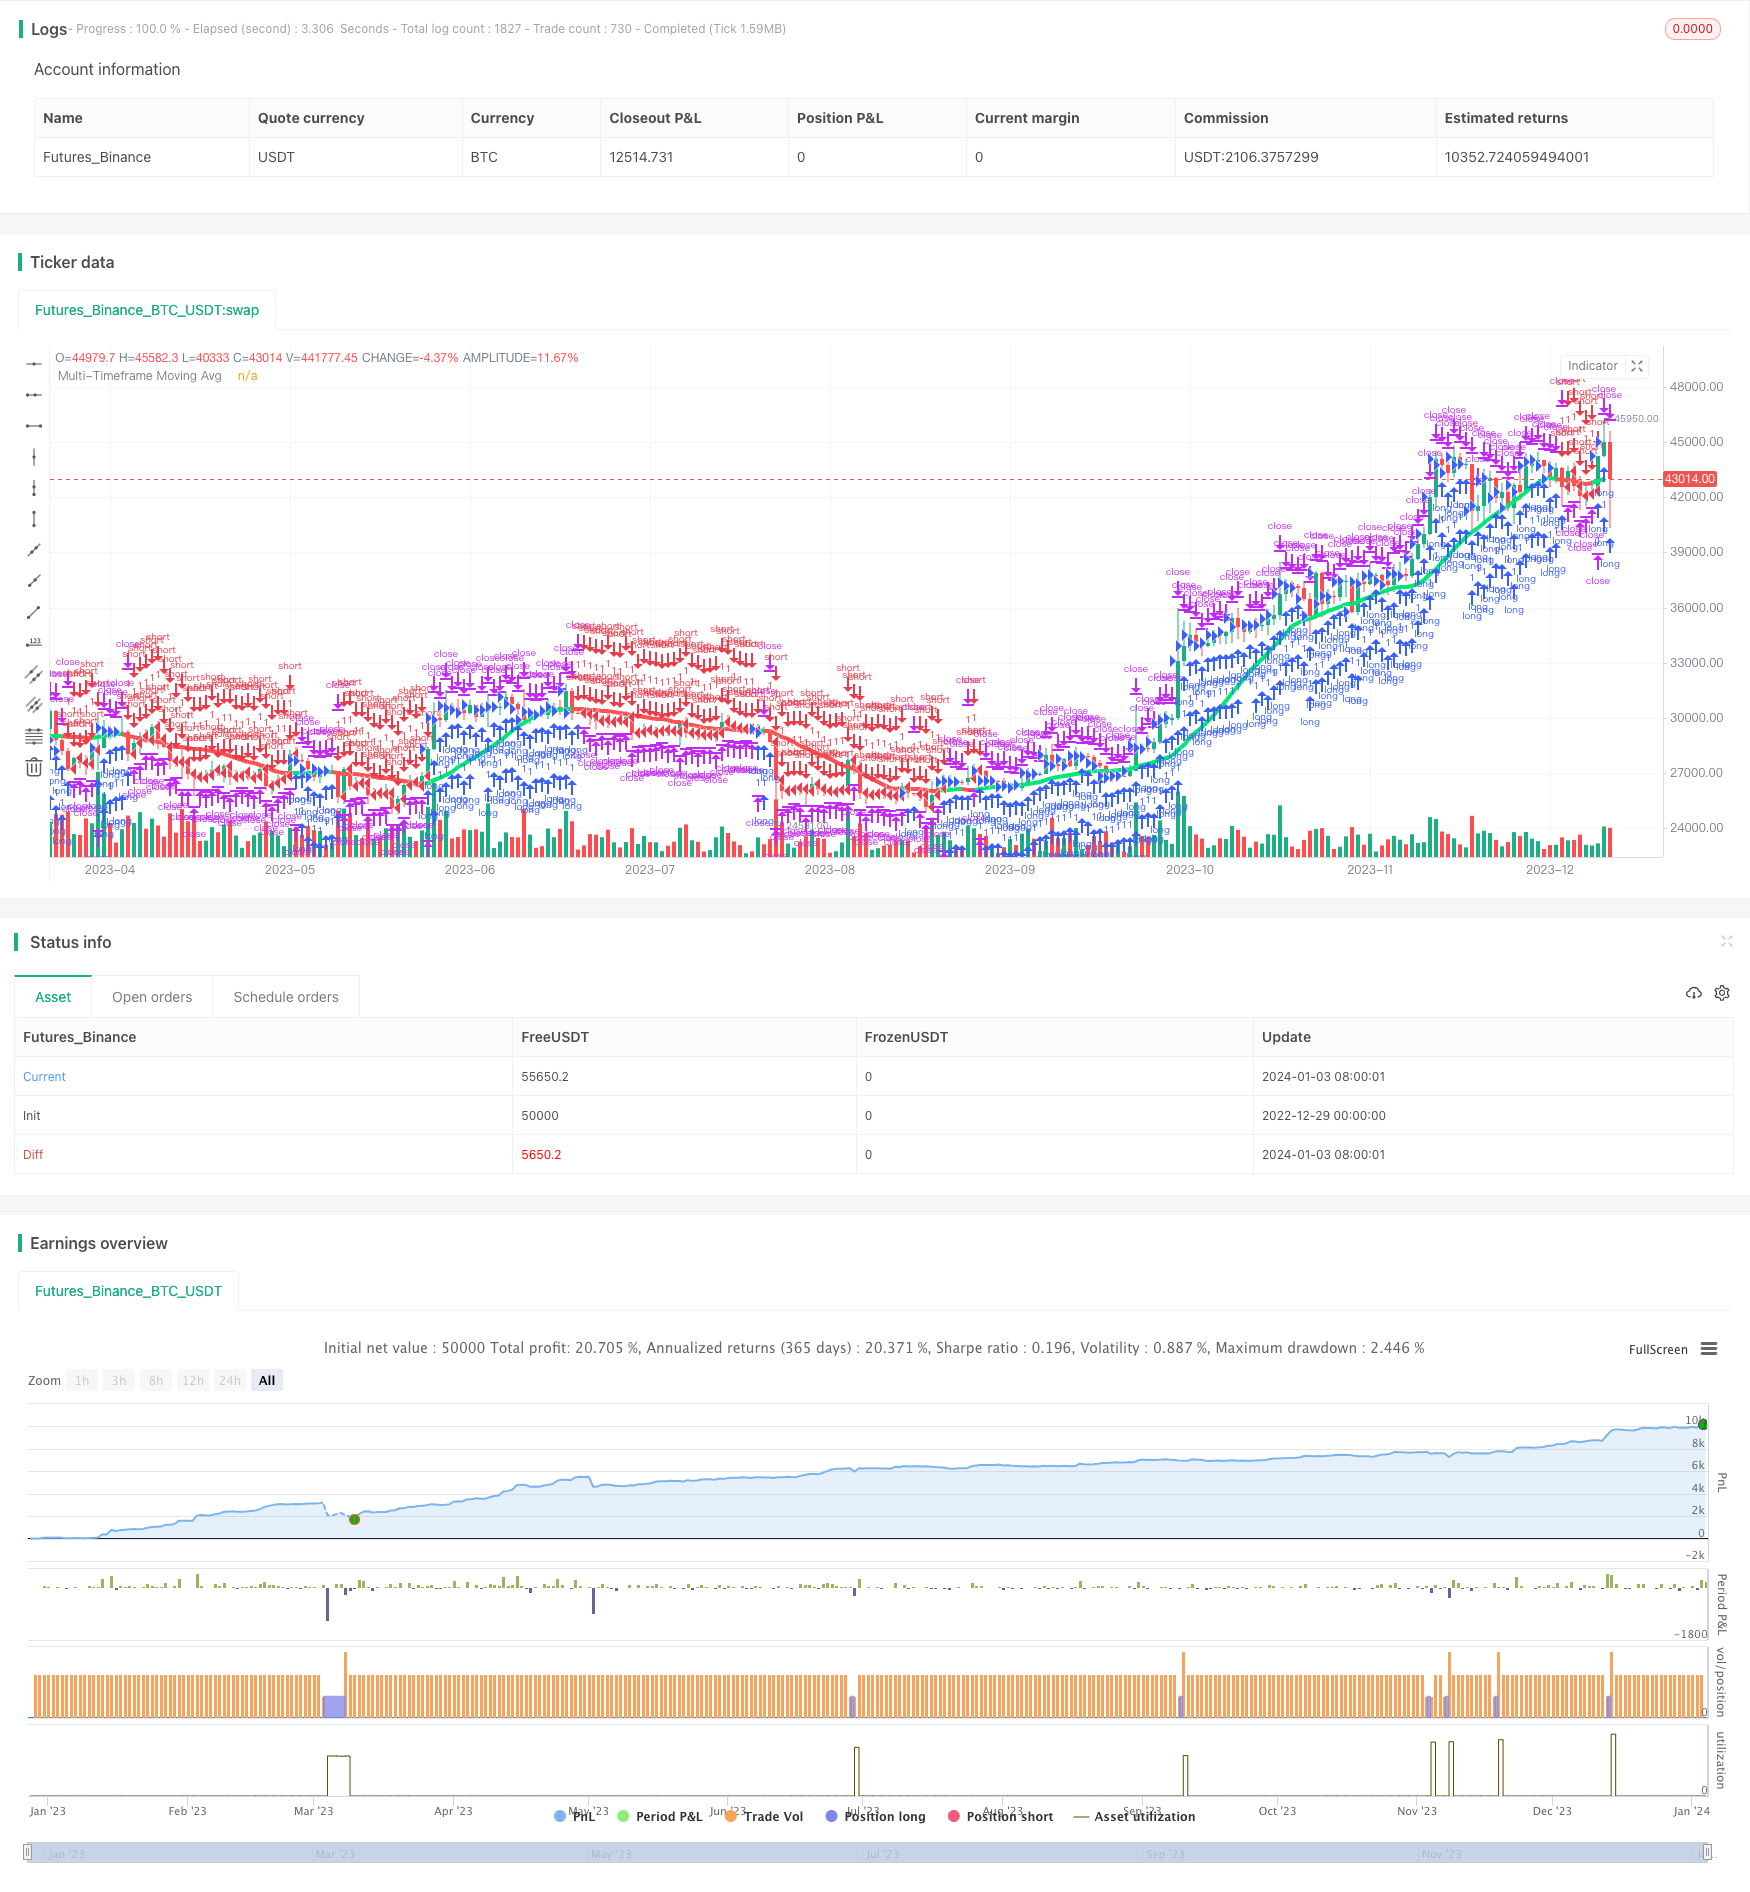
Die Strategie basiert auf der Umschreibung des bekannten Indikators CM_Ultimate_MA_MTF und ermöglicht die Erstellung von Moving Averages auf mehreren Zeitskalen und die Kreuzung von MA aus verschiedenen Zeiträumen. Die Strategie verfügt auch über eine Stop-Loss-Funktion.
Strategieprinzip
- Je nach Benutzeroption werden die MA-Linien in der Hauptgraphik und in höheren Perioden durch verschiedene Arten von MA-Indikatoren getrennt gezeichnet.
- Wenn die MA-Linie mit schneller Periode die MA-Linie mit langsamer Periode durchläuft, machen Sie mehr; wenn die MA-Linie mit schneller Periode die MA-Linie mit langsamer Periode durchläuft, machen Sie leere.
- Ein Tracking-Stop-Mechanismus wurde hinzugefügt, um die Risiken weiter zu kontrollieren.
Analyse der Stärken
- Mehrzeitskala-MA-Kreuzung verbessert die Signalqualität und reduziert die Falschsignale.
- Eine Kombination verschiedener Arten von MA kann die Vorteile der jeweiligen Indikatoren nutzen und die Stabilität verbessern.
- Die Verfolgung von Stop-Losses hilft bei der rechtzeitigen Beendigung von Verlusten und verringert die Wahrscheinlichkeit von erheblichen Verlusten.
Risikoanalyse
- Der MA-Wert ist zurückgeblieben und könnte die Gelegenheit zur kurzfristigen Aktion verpassen.
- Die Parameter für die MA-Periode müssen entsprechend optimiert werden, da sonst zu viele Falschsignale erzeugt werden könnten.
- Unvernünftige Einstellungen des Stopp-Punktes können zu unnötigen Schäden führen.
Optimierungsrichtung
- MA-Kombinationen mit verschiedenen Parametern können getestet werden, um die optimale Parameter zu finden.
- Zusätzliche Filter können die Signalqualität verbessern.
- Die Stop-Loss-Strategie kann optimiert werden, um sie besser an die Merkmale des Marktes anzupassen.
Zusammenfassen
Die Strategie integriert die Multi-Time-Frame-Analyse von Moving Averages und die Stop-Loss-Verfolgung, um die Signalqualität zu verbessern und das Risiko zu kontrollieren. Durch die Optimierung der Parameter und die Aufnahme anderer Indikatoren kann die Effektivität der Strategie weiter verbessert werden.
Strategiequellcode
/*backtest
start: 2022-12-29 00:00:00
end: 2024-01-04 00:00:00
period: 1d
basePeriod: 1h
exchanges: [{"eid":"Futures_Binance","currency":"BTC_USDT"}]
*/

//@version=2

strategy(title = "Ultimate Moving Average Strategy", shorttitle = "UMA Strategy", overlay = true)

//Created by user ChrisMoody 4-24-2014
//Converted to strategy by Virtual_Machinist 7-11-2018
//Plots The Majority of Moving Averages
//Defaults to Current Chart Time Frame --- But Can Be Changed to Higher Or Lower Time Frames
//2nd MA Capability with Show Crosses Feature

//inputs
src = close
useCurrentRes = input(true, title="Use Current Chart Resolution?")
resCustom = input(title="Use Different Timeframe? Uncheck Box Above",  defval="D")
len = input(20, title="Moving Average Length - LookBack Period")
atype = input(1,minval=1,maxval=7,title="1=SMA, 2=EMA, 3=WMA, 4=HullMA, 5=VWMA, 6=RMA, 7=TEMA")
cc = input(true,title="Change Color Based On Direction?")
smoothe = input(2, minval=1, maxval=10, title="Color Smoothing - 1 = No Smoothing")
doma2 = input(false, title="Optional 2nd Moving Average")
len2 = input(50, title="Moving Average Length - Optional 2nd MA")
atype2 = input(1,minval=1,maxval=7,title="1=SMA, 2=EMA, 3=WMA, 4=HullMA, 5=VWMA, 6=RMA, 7=TEMA")
cc2 = input(true,title="Change Color Based On Direction 2nd MA?")
warn = input(false, title="***You Can Turn On The Show Dots Parameter Below Without Plotting 2nd MA to See Crosses***")
warn2 = input(false, title="***If Using Cross Feature W/O Plotting 2ndMA - Make Sure 2ndMA Parameters are Set Correctly***")
sd = input(false, title="Show Dots on Cross of Both MA's")

useStop     = input(defval = true, title = "Use Trailing Stop?")
slPoints    = input(defval = 200, title = "Stop Loss Trail Points", minval = 1)
slOffset    = input(defval = 400, title = "Stop Loss Trail Offset", minval = 1)

res = useCurrentRes ? timeframe.period : resCustom
//hull ma definition
hullma = wma(2*wma(src, len/2)-wma(src, len), round(sqrt(len)))
//TEMA definition
ema1 = ema(src, len)
ema2 = ema(ema1, len)
ema3 = ema(ema2, len)
tema = 3 * (ema1 - ema2) + ema3

avg = atype == 1 ? sma(src,len) : atype == 2 ? ema(src,len) : atype == 3 ? wma(src,len) : atype == 4 ? hullma : atype == 5 ? vwma(src, len) : atype == 6 ? rma(src,len) : tema
//2nd Ma - hull ma definition
hullma2 = wma(2*wma(src, len2/2)-wma(src, len2), round(sqrt(len2)))
//2nd MA TEMA definition
sema1 = ema(src, len2)
sema2 = ema(sema1, len2)
sema3 = ema(sema2, len2)
stema = 3 * (sema1 - sema2) + sema3

avg2 = atype2 == 1 ? sma(src,len2) : atype2 == 2 ? ema(src,len2) : atype2 == 3 ? wma(src,len2) : atype2 == 4 ? hullma2 : atype2 == 5 ? vwma(src, len2) : atype2 == 6 ? rma(src,len2) : tema

out = avg
out_two = avg2

out1 = request.security(syminfo.tickerid, res, out)
out2 = request.security(syminfo.tickerid, res, out_two)

ma_up = out1 >= out1[smoothe]
ma_down = out1 < out1[smoothe]

col = cc ? ma_up ? lime : ma_down ? red : aqua : aqua
col2 = cc2 ? ma_up ? lime : ma_down ? red : aqua : aqua

circleYPosition = out2

plot(out1, title="Multi-Timeframe Moving Avg", style=line, linewidth=4, color = col)
plot(doma2 and out2 ? out2 : na, title="2nd Multi-TimeFrame Moving Average", style=circles, linewidth=4, color=col2)
plot(sd and cross(out1, out2) ? circleYPosition : na,style=cross, linewidth=5, color=yellow)

// Strategy conditions

longCond    = ma_up
shortCond   = ma_down
// entries and base exit
strategy.entry("long", strategy.long, when = longCond)
strategy.entry("short", strategy.short, when = shortCond)

if (useStop)
    strategy.exit("XL", from_entry = "long", trail_points = slPoints, trail_offset = slOffset)
    strategy.exit("XS", from_entry = "short", trail_points = slPoints, trail_offset = slOffset)
// not sure needed, but just incase..
strategy.exit("XL", from_entry = "long", when = shortCond)
strategy.exit("XS", from_entry = "short", when = longCond)