Dynamische CCI-Unterstützungs- und Widerstandsstrategie
Überblick
Die Strategie nutzt die CCI-Kernpunkte, um dynamische Unterstützungs- und Widerstandspunkte zu berechnen, und kombiniert Trendbeurteilung, um nach Kauf- und Verkaufssignalen zu suchen. Die Strategie kombiniert die Umkehrmerkmale des CCI mit der Fähigkeit, Trends zu verfolgen, um Umkehrpunkte in mittleren Trends zu erfassen, um Profit zu machen.
Strategieprinzip
Der CCI zeigt an, ob ein Markt zu schwach oder zu stark ist. Die Grenzwerte 80 und 80 können verwendet werden, um zu beurteilen, ob ein Markt überkauft oder überverkauft ist. Die Strategie nutzt diese Eigenschaft des CCI, indem sie die Knotenpunkte der 50-K-Linien auf beiden Seiten berechnet, um die oberen und unteren Knotenpunkte zu erhalten.
Die Strategie erzeugt ein Kaufsignal, wenn der Schlusskurs über dem Eröffnungspreis und unter der oberen Unterstützungslinie liegt. Es erzeugt ein Verkaufsignal, wenn der Schlusskurs unter dem Eröffnungspreis und über der unteren Widerstandslinie liegt. Um Handelssignale zu filtern, die nicht in die Richtung des Haupttrends gehen, kombiniert die Strategie auch die EMA und den Slip-Index, um die Richtung des aktuellen Haupttrends zu bestimmen.
Die Stop-Loss- und Stop-Stopp-Regelungen basieren auf dynamischen Berechnungen der ATR-Indikatoren, was die Risikokontrolle dieser Strategie auch vernünftiger macht.
Analyse der Stärken
- Nutzen Sie die Umkehrcharakteristiken des CCI-Indikators, um in der Nähe der Umkehrpunkte zu kaufen und zu verkaufen, um die Gewinnwahrscheinlichkeit zu erhöhen.
- Es ist wichtig, dass man sich in der Lage fühlt, Trends zu beurteilen, um Rückschläge zu vermeiden und Verluste zu minimieren.
- Die Dynamische Stop-Loss-Sperre ermöglicht eine vernünftigere Risikokontrolle.
- Anpassbare Parameter wie CCI-Perioden, die Größe der Bufferzone usw. sind für mehrere Marktbedingungen geeignet.
Risikoanalyse
- Der CCI-Indikator ist sehr anfällig für falsche Signale und muss mit einem Trendfilter kombiniert werden.
- Die Umkehrung ist nicht unbedingt erfolgreich, es besteht die Gefahr einer Verlustwahrscheinlichkeit.
- Die falsche Einstellung der Parameter kann zu zu häufigen Geschäften oder verpassten Handelsmöglichkeiten führen.
Risiken können durch die Optimierung von Parametern und die Anpassung der Stop-Loss-Marge verringert werden. Darüber hinaus kann die Strategie als Hilfsmittel für andere Indikatoren verwendet werden, ohne sich vollständig auf ihre Handelssignale zu verlassen.
Optimierungsrichtung
- Optimierung der Größe der Bufferzonen für unterschiedlich schwankende Märkte.
- Optimierung der ATR-Zyklusparameter für eine genauere dynamische Stop-Loss-Stoppung.
- Versuchen Sie es mit verschiedenen CCI-Parametern.
- Test der Wirksamkeit anderer Arten von Trendbeurteilungsindikatoren.
Zusammenfassen
Diese Strategie integriert die Fähigkeit der CCI-Indikatoren für die Mehrfach-Filterung mit der Filterbestätigung von Trendurteilen und hat einen gewissen praktischen Wert. Die dynamische Stop-Loss-Stopp macht die Strategie auch in der praktischen Anwendung risikokontrollierbar. Durch die Optimierung und Verbesserung der Parameter werden voraussichtlich bessere Ergebnisse erzielt.
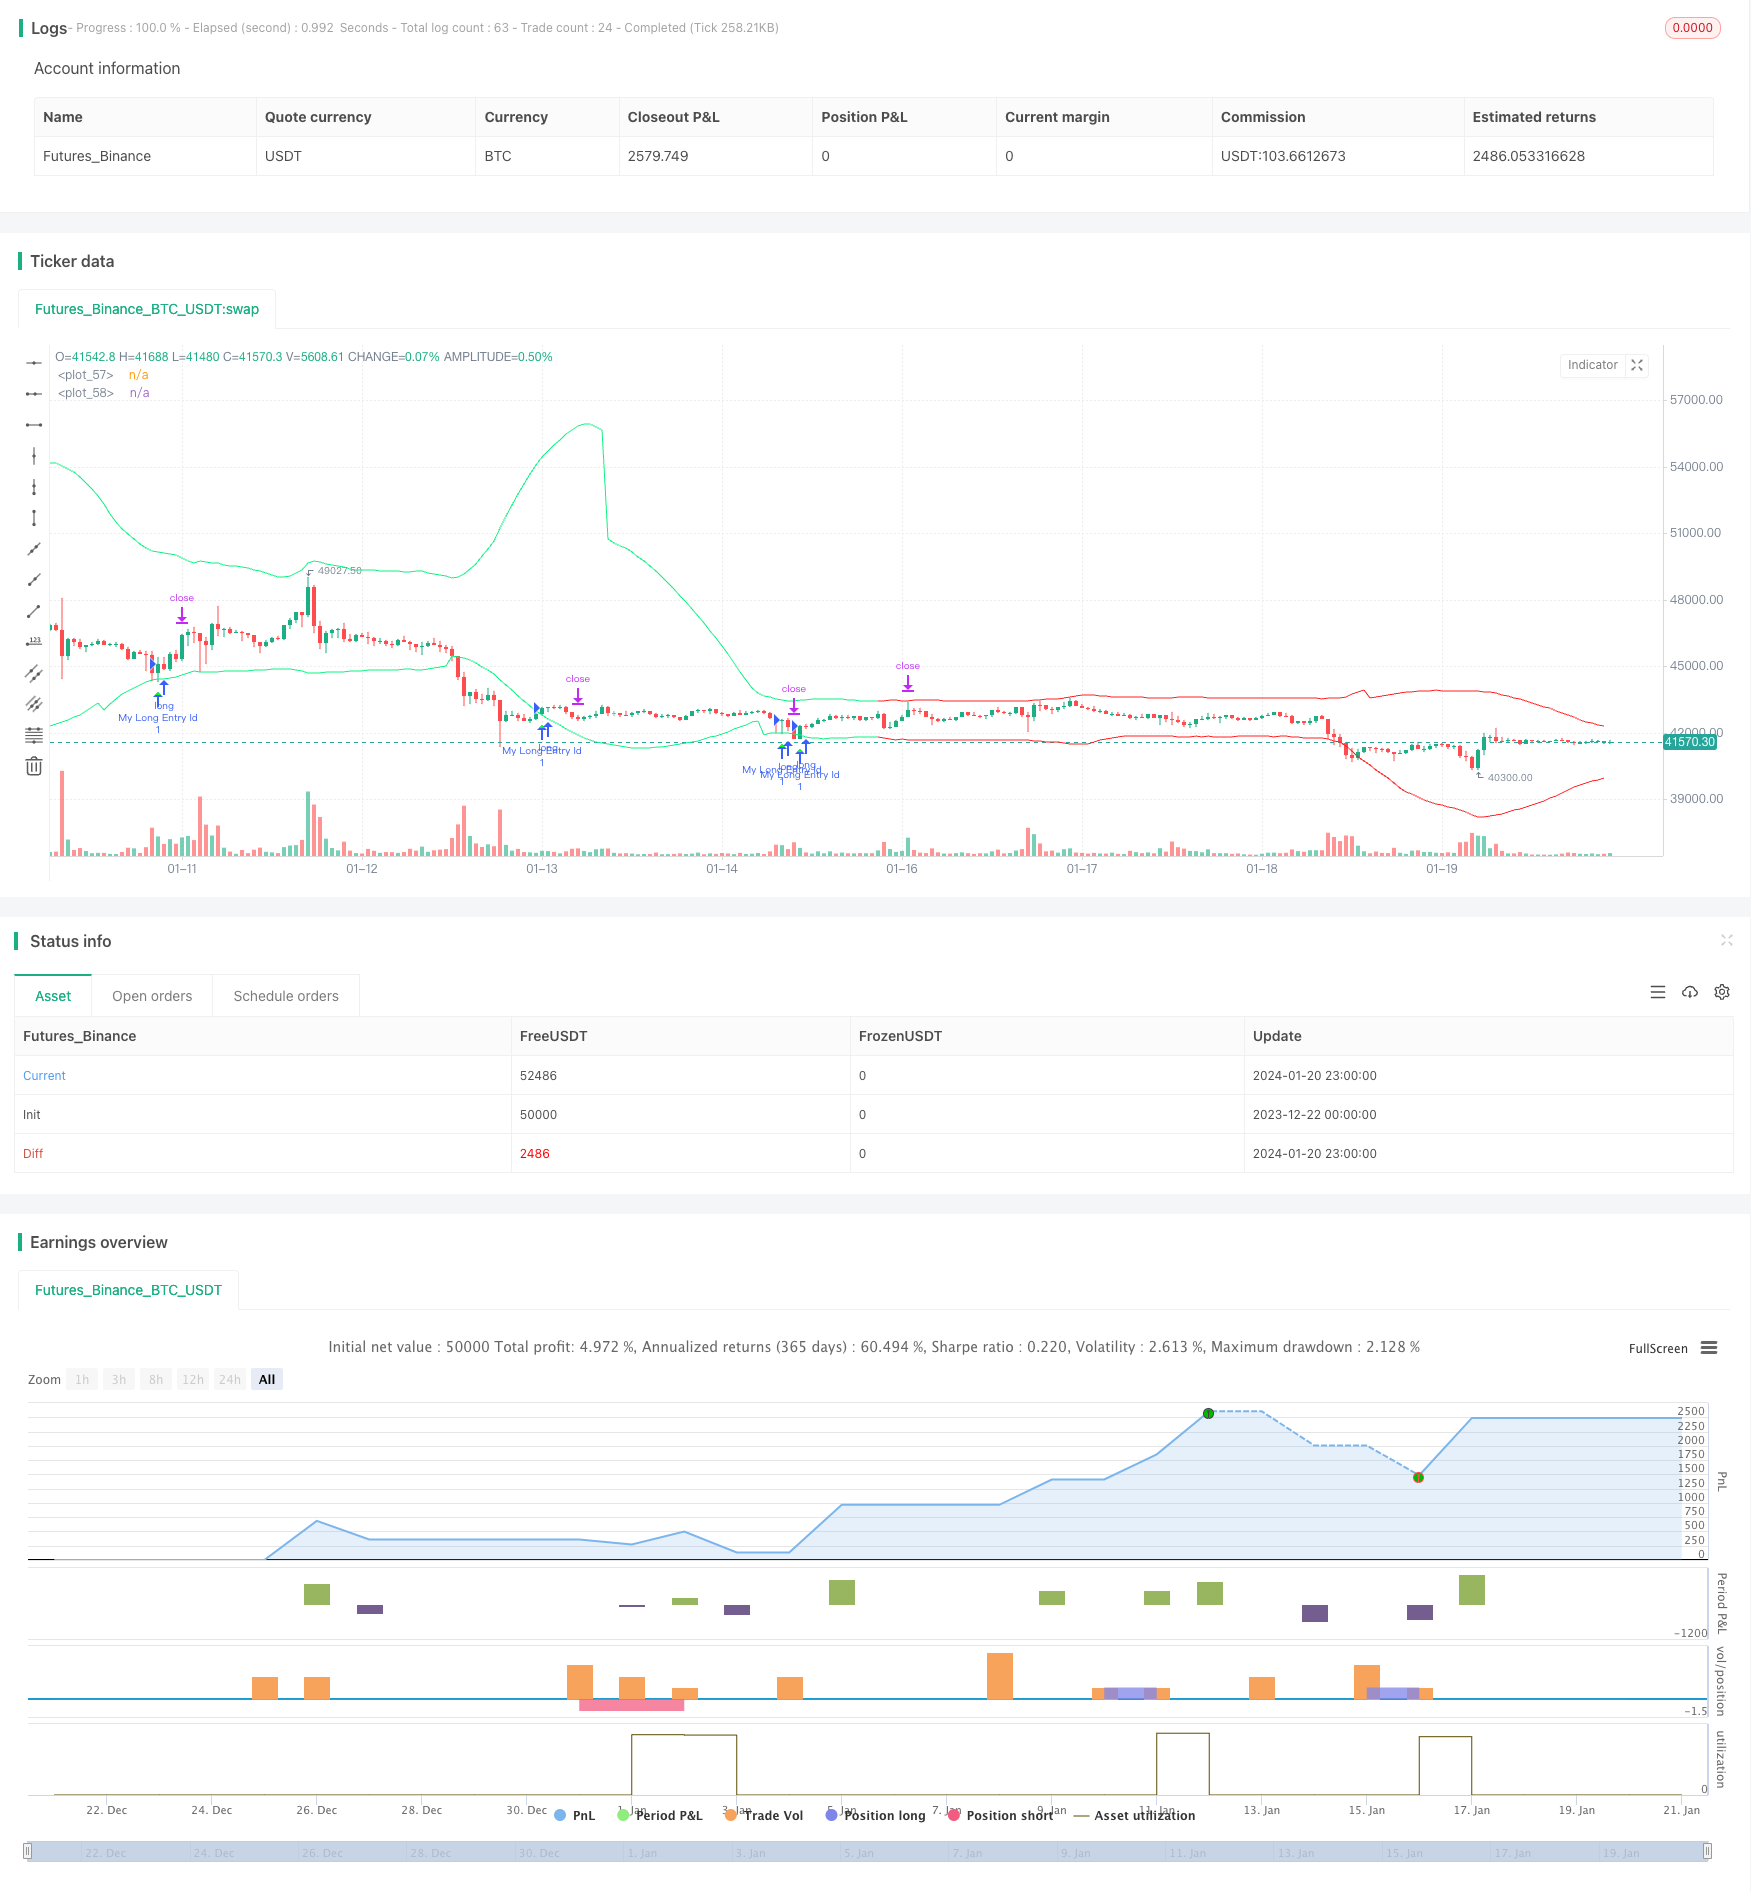
/*backtest
start: 2023-12-22 00:00:00
end: 2024-01-21 00:00:00
period: 1h
basePeriod: 15m
exchanges: [{"eid":"Futures_Binance","currency":"BTC_USDT"}]
*/

// This Pine Script™ code is subject to the terms of the Mozilla Public License 2.0 at https://mozilla.org/MPL/2.0/
// © AliSignals


//@version=5
strategy("CCI based support and resistance strategy", overlay=true  )


cci_length = input.int(50, "cci length")
right_pivot = input.int(50, "right pivot")
left_pivot = input.int(50, "left pivot")
buffer = input.float(10.0, "buffer")
trend_matter = input.bool(true, "trend matter?")
showmid = input.bool ( false , "show mid?")
trend_type = input.string("cross","trend type" ,options = ["cross","slope"])
slowma_l = input.int(100, "slow ma length")
fastma_l = input.int(50, "fast ma length")
slope_l = input.int(5,  "slope's length for trend detection")
ksl = input.float(1.1)
ktp = input.float(2.2)
restf = input.timeframe(title="Time Frame of Last Period for Calculating max" , defval="D")


// Calculating Upper and Lower CCI
cci = ta.cci(hlc3,cci_length)

uppercci = 0.0
lowercci = 0.0

uppercci := fixnan(ta.pivothigh(cci, left_pivot, right_pivot)) - buffer
lowercci := fixnan(ta.pivotlow (cci, left_pivot, right_pivot)) + buffer
midccci  = math.avg(uppercci,lowercci)


// Support and Resistance based on CCI
res = uppercci*(0.015*ta.dev(hlc3,cci_length))+ ta.sma(hlc3,cci_length)
sup = lowercci*(0.015*ta.dev(hlc3,cci_length))+ ta.sma(hlc3,cci_length)
mid =  midccci*(0.015*ta.dev(hlc3,cci_length))+ ta.sma(hlc3,cci_length)


// Calculating trend
t_cross  = 0
t_cross := ta.ema(close,fastma_l) > ta.ema(close,slowma_l) ? 1 : ta.ema(close,fastma_l) < ta.ema(close,slowma_l) ? -1 : t_cross[1]

t_slope  = 0
t_slope := ta.ema(close,slowma_l) > ta.ema(close,slowma_l)[slope_l] ? 1 : ta.ema(close,slowma_l) < ta.ema(close,slowma_l)[slope_l]  ? -1 : t_slope[1]

t  = 0
t := trend_type == "cross" ? t_cross : trend_type == "slope" ? t_slope : na

colort =  trend_matter == false ? color.rgb(201, 251, 0) : t == 1 ? color.rgb(14, 243, 132) :  t == -1 ? color.rgb(255, 34, 34) : na
bull_t = trend_matter == false or t ==  1
bear_t = trend_matter == false or t == -1

plot(res, color = colort)
plot(sup, color = colort)
plot(showmid == true ? mid : na)


// Long and Short enter condition
buy  = bull_t == 1 and ta.lowest (2) < sup and close > open and close > sup
sell = bear_t == 1 and ta.highest(2) > res and close < open and close < res

plotshape( buy , color=color.rgb(6, 255, 23) , location = location.belowbar, style = shape.triangleup  , size = size.normal)
plotshape( sell, color=color.rgb(234, 4, 4) ,  location = location.abovebar, style = shape.triangledown, size = size.normal)


atr = ta.atr(100)


CLOSE=request.security(syminfo.tickerid, restf, close)
max = 0.0
max := CLOSE == CLOSE[1] ? math.max(max[1], atr) : atr
act_atr = 0.0
act_atr := CLOSE == CLOSE[1] ? act_atr[1] : max[1]

atr1 =  math.max(act_atr, atr)

dis_sl = atr1 * ksl
dis_tp = atr1 * ktp


var float longsl  = open[1] - dis_sl
var float shortsl = open[1] + dis_sl
var float longtp =   open[1] + dis_tp
var float shorttp =  open[1] - dis_tp


longCondition = buy
if (longCondition)
    strategy.entry("My Long Entry Id", strategy.long)

shortCondition = sell
if (shortCondition)
    strategy.entry("My Short Entry Id", strategy.short)


longsl  := strategy.position_size > 0  ? longsl[1]  : close - dis_sl
shortsl := strategy.position_size < 0 ? shortsl[1] : close + dis_sl
longtp  := strategy.position_size > 0  ? longtp[1]  : close + dis_tp
shorttp := strategy.position_size < 0 ? shorttp[1] : close - dis_tp


if strategy.position_size > 0
    strategy.exit(id="My Long close Id", from_entry ="My Long Entry Id" , stop=longsl, limit=longtp)
if strategy.position_size < 0
    strategy.exit(id="My Short close Id", from_entry ="My Short Entry Id" , stop=shortsl, limit=shorttp)