BTC-Handelsstrategie basierend auf dem gleitenden EMA-Durchschnitt und dem MACD-Indikator
Überblick
Diese Strategie ist eine kombinierte Strategie, die auf der Differenz zwischen der EMA-Mittellinie und dem MACD-Indikator basiert und für den Short-Line-Handel mit BTC verwendet wird. Sie kombiniert die Signale der EMA-Mittellinie und des MACD, um unter bestimmten Bedingungen ein Kauf- und Verkaufssignal zu erzeugen.
Strategieprinzip
Wenn die Differenz negativ ist und kleiner als die Schwelle ist und der MACD eine leere Kreuzung aufweist, wird ein Kaufsignal erzeugt. Wenn die Differenz positiv ist und größer als die Schwelle ist und der MACD eine mehrköpfige Kreuzung aufweist, wird ein Verkaufssignal erzeugt.
Durch die Kombination von Signalen mit EMA-Mitteldifferenz und MACD-Indikatoren können einige Falschsignale gefiltert und die Reliabilität des Signals verbessert werden.
Analyse der Stärken
- Mit Hilfe von Composite Indicators sind die Signale zuverlässiger
- Kurzperiodenparameter für kurzfristige Transaktionen
- Mit Stop-Loss- und Stop-Stopp-Einstellungen können Sie Risiken kontrollieren
Risikoanalyse
- Der Stop-Loss kann bei starken Marktschwankungen durchbrochen werden.
- Die Parameter müssen optimiert werden, um sie besser an unterschiedliche Marktbedingungen anzupassen
- Verschiedene Währungen und Börsen müssen getestet werden
Optimierungsrichtung
- Optimierung der EMA- und MACD-Parameter, um sie besser an die schwankende Umgebung von BTC anzupassen
- Erhöhung der offenen Positionen und der Strategie zur Erhöhung und Verringerung der Positionen und zur Optimierung der Kapitalnutzung
- Erhöhung von Stop-Loss-Methoden, wie beispielsweise Moving Stop, Vibration Stop, um das Risiko zu verringern
- Verschiedene Börsen und Währungen getestet
Zusammenfassen
Die Strategie integriert die Vorteile der beiden Indikatoren Mesane und MACD und nutzt die Kombination von Signalen, um falsche Signale wirksam zu filtern. Durch Optimierung der Parameter und der Strategie zur Positionseröffnung können stabile Gewinne erzielt werden. Es ist jedoch erforderlich, auf das Risiko eines Durchbruchs der Stop Loss zu achten, das weiter getestet und verbessert werden muss.
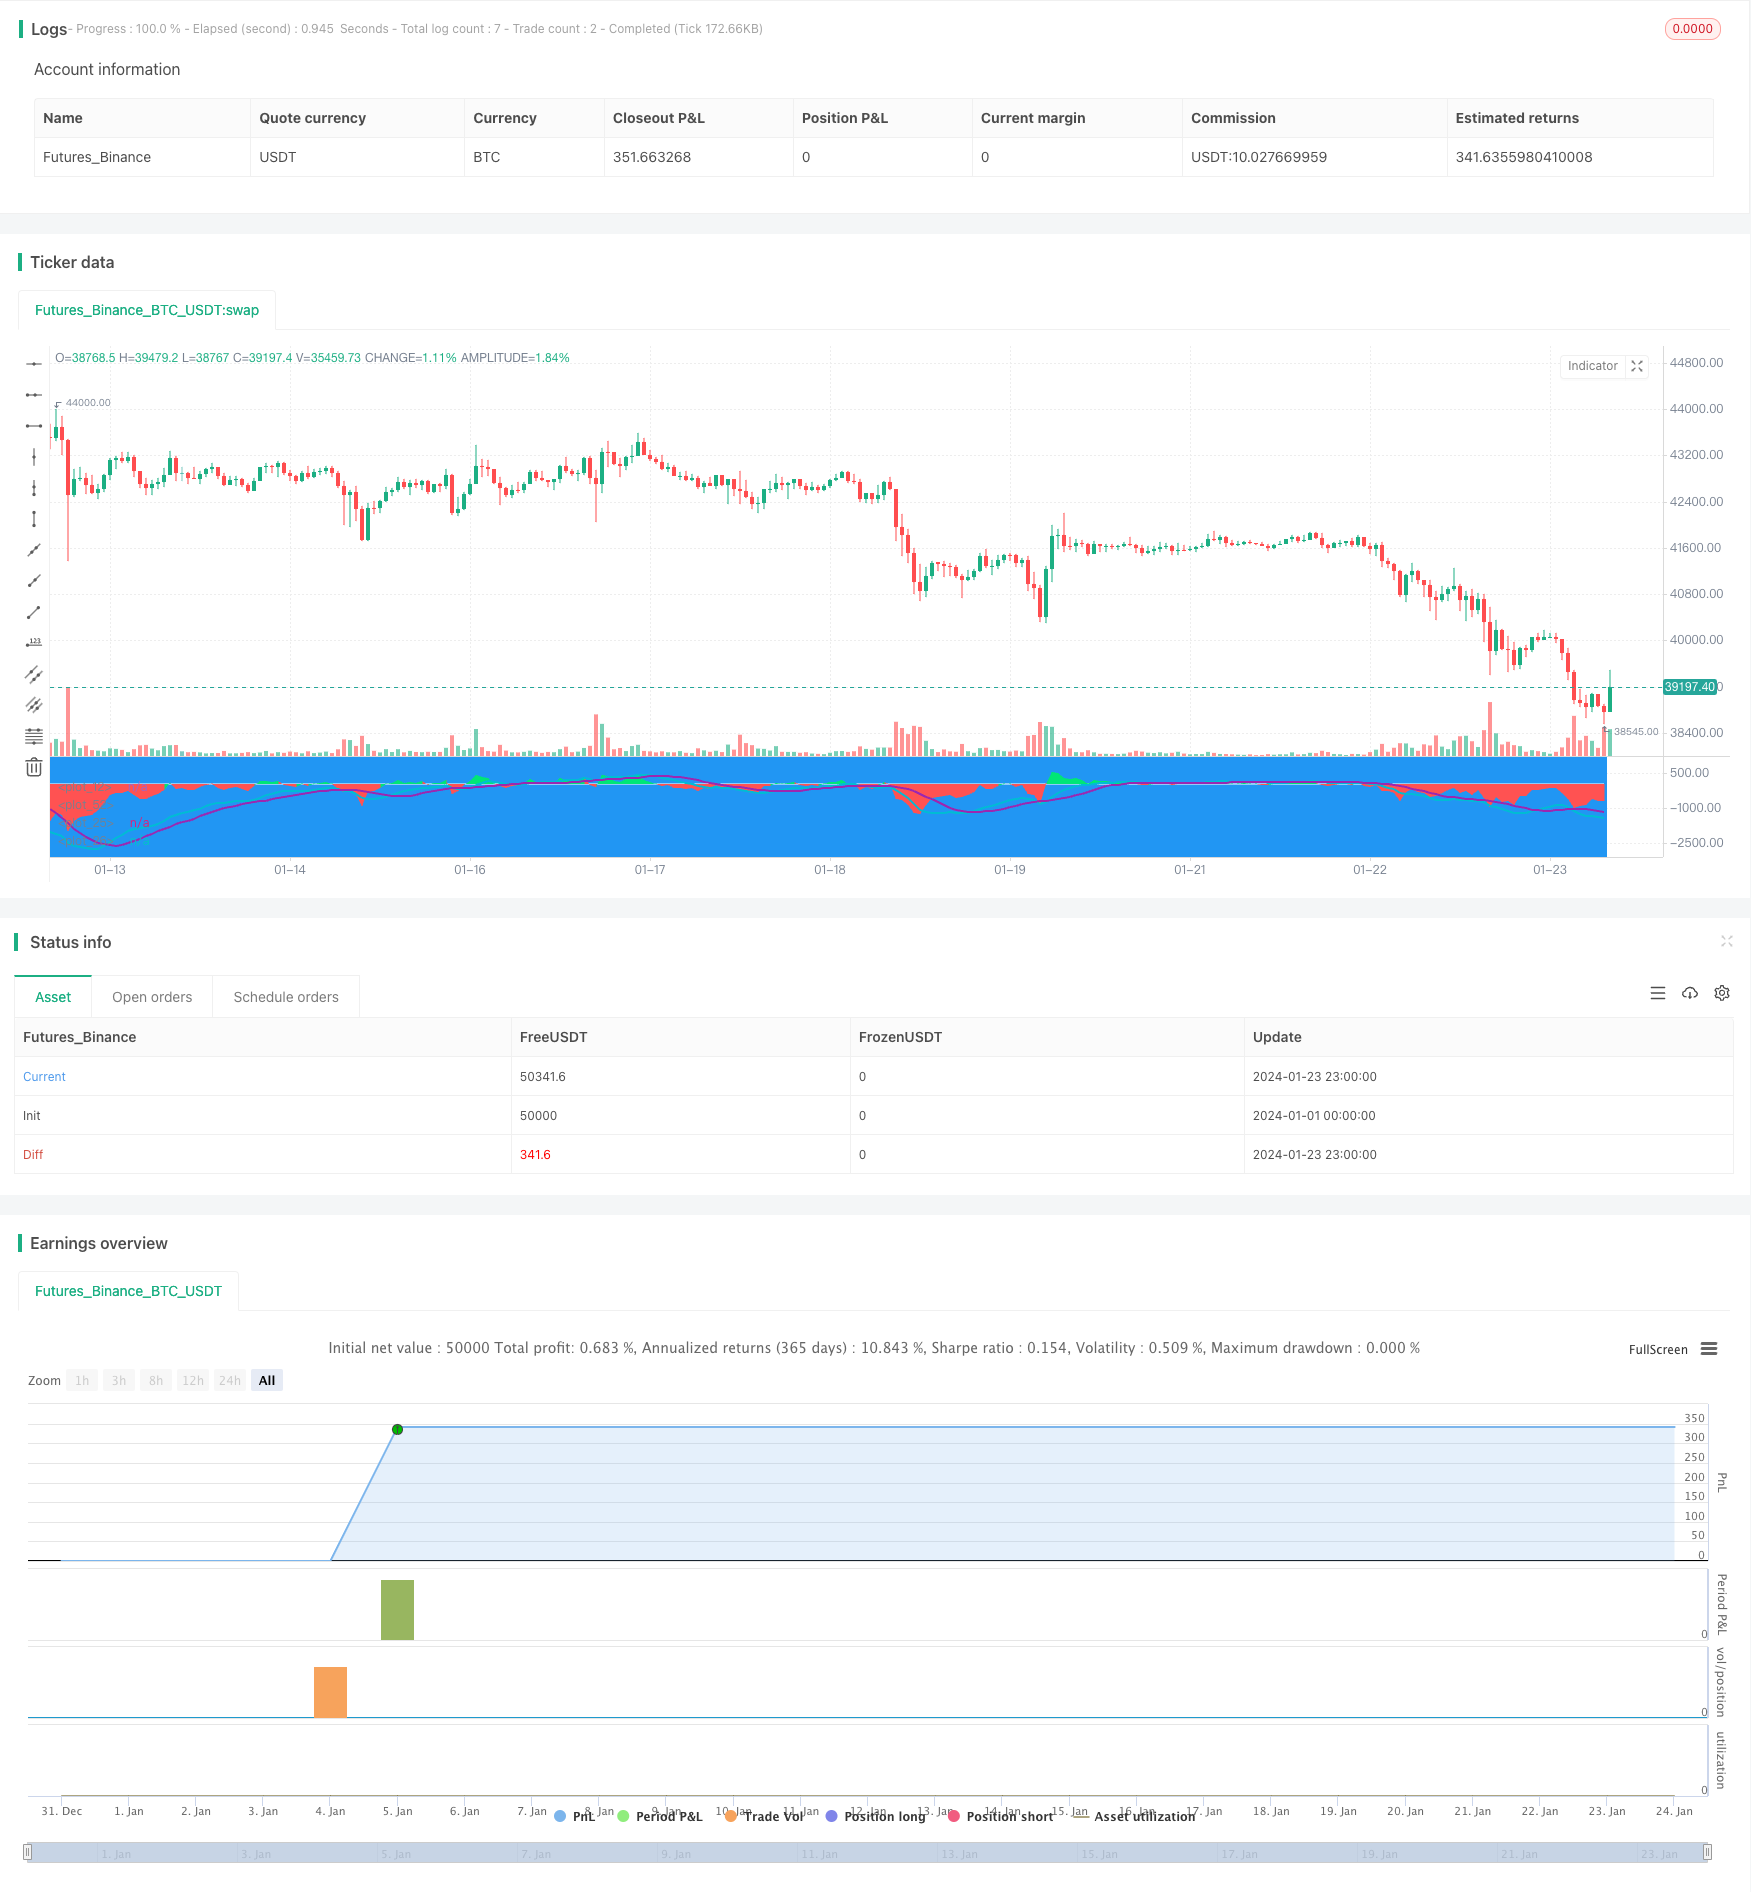
/*backtest
start: 2024-01-01 00:00:00
end: 2024-01-24 00:00:00
period: 1h
basePeriod: 15m
exchanges: [{"eid":"Futures_Binance","currency":"BTC_USDT"}]
*/

//@version=3
strategy("EMA50Diff & MACD Strategy", overlay=false)
EMA = input(18, step=1)
MACDfast = input(12)
MACDslow = input(26)
EMADiffThreshold = input(8)
MACDThreshold = input(80)
TargetValidityThreshold = input(65, step=5)
Target = input(120, step=5)
StopLoss = input(650, step=5)
ema = ema(close, EMA)
hl = plot(0, color=white, linewidth=1)
diff = close - ema
clr = color(blue, transp=100)
if diff>0
    clr := lime
else
    if diff<0
        clr := red

fastMA = ema(close, MACDfast)
slowMA = ema(close, MACDslow)
macd = (fastMA - slowMA)*3
signal = sma(macd, 9)
plot(macd, color=aqua, linewidth=2)
plot(signal, color=purple, linewidth=2)

macdlong = macd<-MACDThreshold and signal<-MACDThreshold and crossover(macd, signal)
macdshort = macd>MACDThreshold and signal>MACDThreshold and crossunder(macd, signal)
position = 0.0
position := nz(strategy.position_size, 0.0)
long = (position < 0 and close < strategy.position_avg_price - TargetValidityThreshold and macdlong) or
     (position == 0.0 and diff < -EMADiffThreshold and diff > diff[1] and diff[1] < diff[2] and macdlong)

short = (position > 0 and close > strategy.position_avg_price + TargetValidityThreshold and macdshort) or
      (position == 0.0 and diff > EMADiffThreshold and diff < diff[1] and diff[1] > diff[2] and macdshort)
amount = (strategy.equity / close) //- ((strategy.equity / close / 10)%10)
bgclr = color(blue, transp=100) //#0c0c0c
if long
    strategy.entry("long", strategy.long, amount)
    bgclr := green
if short
    strategy.entry("short", strategy.short, amount)
    bgclr := maroon
bgcolor(bgclr, transp=20)
strategy.close("long", when=close>strategy.position_avg_price + Target)
strategy.close("short", when=close<strategy.position_avg_price - Target)
strategy.exit("STOPLOSS", "long", stop=strategy.position_avg_price - StopLoss)
strategy.exit("STOPLOSS", "short", stop=strategy.position_avg_price + StopLoss)
//plotshape(long, style=shape.labelup, location=location.bottom, color=green)
//plotshape(short, style=shape.labeldown, location=location.top, color=red)
pl = plot(diff, style=histogram, color=clr)
fill(hl, pl, color=clr)