Referenzstrategie für den Ausbruch nach oben
Überblick
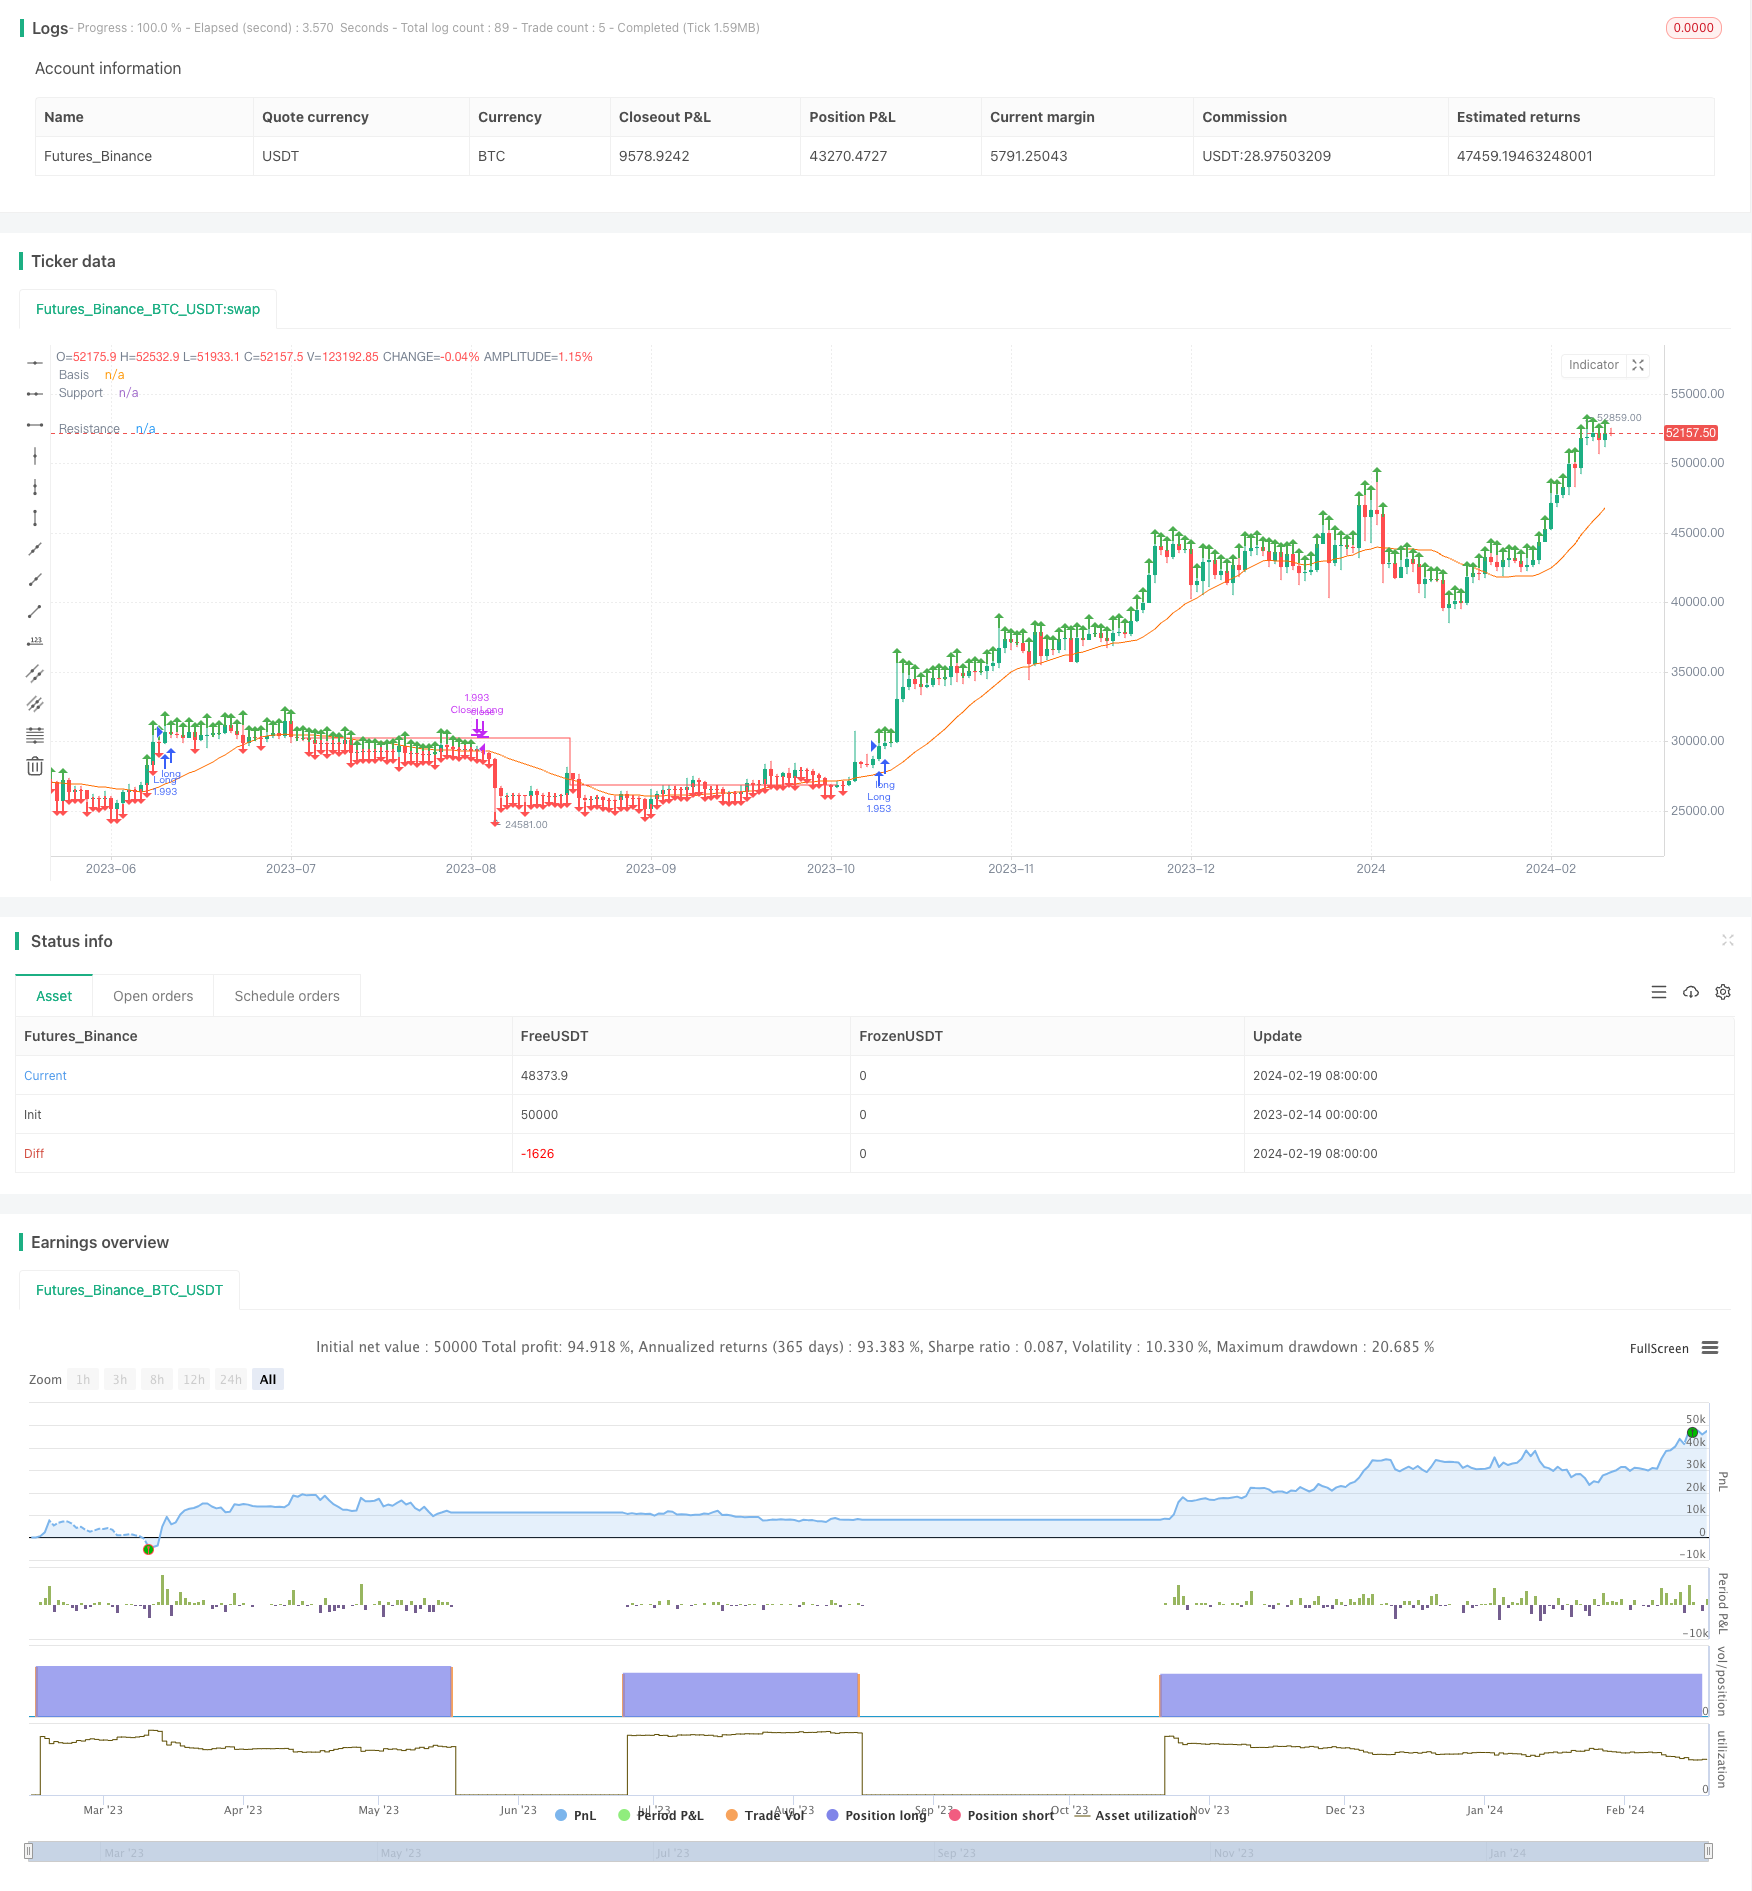
Die Strategie ist eine Longline-Positionsstrategie, bei der die Richtung der Tendenz auf Basis eines einfachen Moving Averages bestimmt wird, die mit Resistenz-Unterstützungslinien kombiniert wird, um ein Breakout-Signal zu erzeugen. Durch die Berechnung von Preis-Pivot-Höhen und Pivot-Tiefs wird eine Resistenz- und Unterstützungslinie erstellt.
Strategieprinzip
- Der 20-Tage-Simple Moving Average wird als Basis für Trends berechnet.
- Berechnung von Pivot-Hoch- und Pivot-Tiefpunkten anhand von Benutzerinput-Parametern
- Abbildung der Widerstands- und Unterstützungslinien nach Pivot-Hoch- und Pivot-Tiefpunkt
- Eintritt, wenn der Schlusskurs über der Widerstandslinie liegt
- Wenn die Unterstützung unterhalb der Widerstandslinie durchbricht, platzieren
Diese Strategie verwendet einen einfachen Moving Average, um die Richtung des Gesamttrends zu bestimmen, und nutzt dann einen Kernausbruch, um ein Handelssignal zu erzeugen. Sie gehört zu den typischen Breakout-Strategien. Durch den Kernausbruch und die Trendentscheidung können falsche Breakouts effektiv gefiltert werden.
Analyse der Stärken
- Strategische Chancen sind groß, geeignet für Aktien mit hoher Volatilität und leicht zu erfassen
- Risikokontrolle: mehr Risiko als Gewinn
- Einbruchssignal zur Vermeidung der Gefahr eines falschen Einbruchs
- Benutzerdefinierte Parameter und Anpassungsfähigkeit
Risikoanalyse
- Abhängig von Parameteroptimierungen, bei denen falsche Parameter die Wahrscheinlichkeit einer False-Breakout erhöhen
- Das Signal für den Durchbruch wurde verzögert und könnte einige Gelegenheiten verpasst haben.
- Schadensanfälligkeit bei Erschütterungen
- Nachlässige Anpassung der Unterstützungslinie kann zu Verlusten führen
Das Risiko kann durch die Optimierung der Parameter auf der Festplatte in Kombination mit einer Stop-Loss-Strategie verringert werden.
Optimierungsrichtung
- Optimierung von Moving Average-Periodenparametern
- Optimierung der Widerstandsparameter der Stützlinie
- Erhöhung der Stop-Loss-Strategie
- Erweiterung der Durchbruch-Bestätigungsmechanismen
- Filtersignale in Verbindung mit Indizern wie Handelsvolumen
Zusammenfassen
Die Strategie als Ganzes ist eine typische Durchbruchstrategie, die auf Parameteroptimierung und Liquidität angewiesen ist und für Trender geeignet ist. Als Referenzrahmen kann nach tatsächlichen Bedürfnissen ein Modul erweitert werden, um das Risiko zu verringern und die Stabilität zu verbessern, indem die Stopp-Loss-Stopps, Signalfilterung usw. eingesetzt werden.
/*backtest
start: 2023-02-14 00:00:00
end: 2024-02-20 00:00:00
period: 1d
basePeriod: 1h
exchanges: [{"eid":"Futures_Binance","currency":"BTC_USDT"}]
*/

// This source code is subject to the terms of the Mozilla Public License 2.0 at https://mozilla.org/MPL/2.0/
// © CheatCode1

//@version=5
strategy("Quantitative Trend Strategy- Uptrend long", 'Steady Uptrend Strategy', overlay=true, initial_capital = 1500, default_qty_value = 100, commission_type = strategy.commission.percent, commission_value = 0.01, default_qty_type = strategy.percent_of_equity)


length = input.int(20, minval=1)
src = input(close, title="Source")
basis = ta.sma(src, length)
offset = input.int(0, "Offset", minval = -500, maxval = 500)
plot(basis, "Basis", color=#FF6D00, offset = offset)

inp1 = input.int(46, 'LookbackLeft')
inp2 = input.int(32, 'LookbackRight')

l1 = ta.pivothigh(close, inp1, inp2)
S1 = ta.pivotlow(close, inp1, inp2)

// plot(l1, 'Pivothigh', color.red, 1)
// // plot(S1, 'Pivot Low', color.red)

l1V = ta.valuewhen(l1, close, 0)
S1V = ta.valuewhen(S1, close, 0)

Plotl1 = not na(l1) ? l1V : na
PlotS1 = not na(S1) ? S1V : na

plot(Plotl1, 'Resistance', color.green, 1, plot.style_stepline, true)
plot(PlotS1, 'Support', color.red, 1, plot.style_stepline, true)

Priceforlong = close > l1V ? true : na
Priceforshort = close < S1V ? true : na

plotshape(Priceforlong ? high : na, 'p', shape.arrowup, location.abovebar, color.green, size = size.small)
plotshape(Priceforshort ? low : na, 's', shape.arrowdown, location.belowbar, color.red, size = size.small)

vol = volume
volma = ta.sma(vol, 20)

Plotl1C = ta.valuewhen(na(Plotl1), l1V, 0)
PlotS1C = ta.valuewhen(na(PlotS1), S1V, 0)
//Strategy Execution
volc = volume > volma

Lc1 = Priceforlong

Sc1 = Priceforshort

sL = Plotl1 < PlotS1 ? close : na
sS = PlotS1 > Plotl1 ? close : na


if Lc1
    strategy.entry('Long', strategy.long)
// if Sc1 and C2
//     strategy.entry('Short', strategy.short)

if Priceforshort
    strategy.cancel('Long')
if Priceforlong
    strategy.cancel('Short')


// Stp1 = ta.crossover(k, d)
// Ltp1 = ta.crossunder(k, d)
// Ltp = d > 70  ? Ltp1 : na
// Stp = d < 30  ? Stp1 : na


if strategy.openprofit >= 0 and sL
    strategy.close('Long')
if strategy.openprofit >= 0 and sS
    strategy.close('Short')
takeP = input.float(2, title='Take Profit') / 100
stopL = input.float(1.75, title='Stop Loss') / 100


// // Pre Directionality

Stop_L = strategy.position_avg_price * (1 - stopL)

Stop_S = strategy.position_avg_price * (1 + stopL)

Take_S= strategy.position_avg_price * (1 - takeP)

Take_L = strategy.position_avg_price * (1 + takeP)

// sL = Plotl1 < PlotS1 ? close : na
// sS = PlotS1 < Plotl1 ? close : na

// //Post Excecution
if strategy.position_size > 0 and not (Lc1)
    strategy.exit("Close Long", stop = Stop_L, limit = Take_L)

if strategy.position_size < 0 and not (Sc1)
    strategy.exit("Close Short", stop = Stop_S, limit = Take_S)