Duale Trendfolge-Quantitative-Strategie

Überblick
Die Kernidee der Strategie ist die Kombination von 123 Reversal Strategien und Rainbow Oscillator Indikatoren, um eine doppelte Trendverfolgung zu ermöglichen, um die Erfolgsrate der Strategie zu erhöhen. Die Strategie verfolgt kurz- und mittelfristige Preistrends und passt ihre Positionen dynamisch an, um die Überschüsse zu erzielen, die über die große Masse hinausgehen.
Strategieprinzip
Die Strategie besteht aus zwei Teilen:
-
123 Umkehrstrategie: Wenn der Schlusskurs in den letzten zwei Tagen gefallen ist und der Schlusskurs heute gestiegen ist und die Slow K-Linie am 9. unter 50 liegt, machen Sie mehr; wenn der Schlusskurs in den letzten zwei Tagen gewachsen ist und der Schlusskurs heute gefallen ist und die Fast K-Linie am 9. über 50 liegt, machen Sie einen Leerstand.
-
Der Rainbow Oscillator Index: Dieser Indikator zeigt die Abweichung der Preise vom Moving Average an. Wenn der Indikator über 80 liegt, zeigt dies, dass der Markt instabil ist. Wenn der Indikator unter 20 liegt, zeigt dies, dass der Markt eine Umkehrung zeigt.
Diese Strategie kombiniert die beiden und eröffnet Positionen, wenn ein OTC-Signal auftritt, oder ist ansonsten leer.
Analyse der Stärken
Diese Strategie hat folgende Vorteile:
- Doppelte Filterung, verbesserte Signalqualität und geringere Fehleinschätzung.
- Das Unternehmen hat sich in der Vergangenheit bemüht, seine Positionen dynamisch zu korrigieren, um die Verluste im einseitigen Handel zu reduzieren.
- Integration von kurz- und mittelfristigen Indikatoren zur Steigerung der strategischen Stabilität
Risikoanalyse
Die Strategie birgt auch folgende Risiken:
- Eine falsche Optimierung der Parameter kann zu einer Überpassung führen.
- Doppelpositionen erhöhen die Transaktionskosten.
- Der Stop-Loss-Punkt kann leicht durchbrochen werden, wenn der Preis der Marke stark schwankt.
Diese Risiken können durch Anpassung der Parameter, Optimierung des Positionsmanagements und vernünftigen Stop-Loss-Setzungen gemindert werden.
Optimierungsrichtung
Diese Strategie kann optimiert werden durch:
- Optimierung der Parameter, um die optimale Parameterkombination zu finden.
- Hinzufügen eines Moduls zur Positionsverwaltung, das die Positionen an die Dynamik der Volatilität und der Rücknahme anpasst.
- Das Modul "Stop-Loss" wurde hinzugefügt, um den mobilen Stop-Loss vernünftiger zu gestalten.
- Die Entwicklung von Anwendungen, die auf die Entwicklung von Trends ausgerichtet sind, wird durch die Entwicklung von Algorithmen unterstützt.
Zusammenfassen
Diese Strategie integriert 123 Umkehrstrategien und Rainbow-Oscillator-Indikatoren, um eine doppelte Trendverfolgung zu ermöglichen und gleichzeitig eine hohe Stabilität zu gewährleisten. Es besteht ein gewisser Spielraum für zusätzliche Gewinne. Durch kontinuierliche Optimierung wird erwartet, dass die Ertragsrate der Strategie weiter verbessert wird.
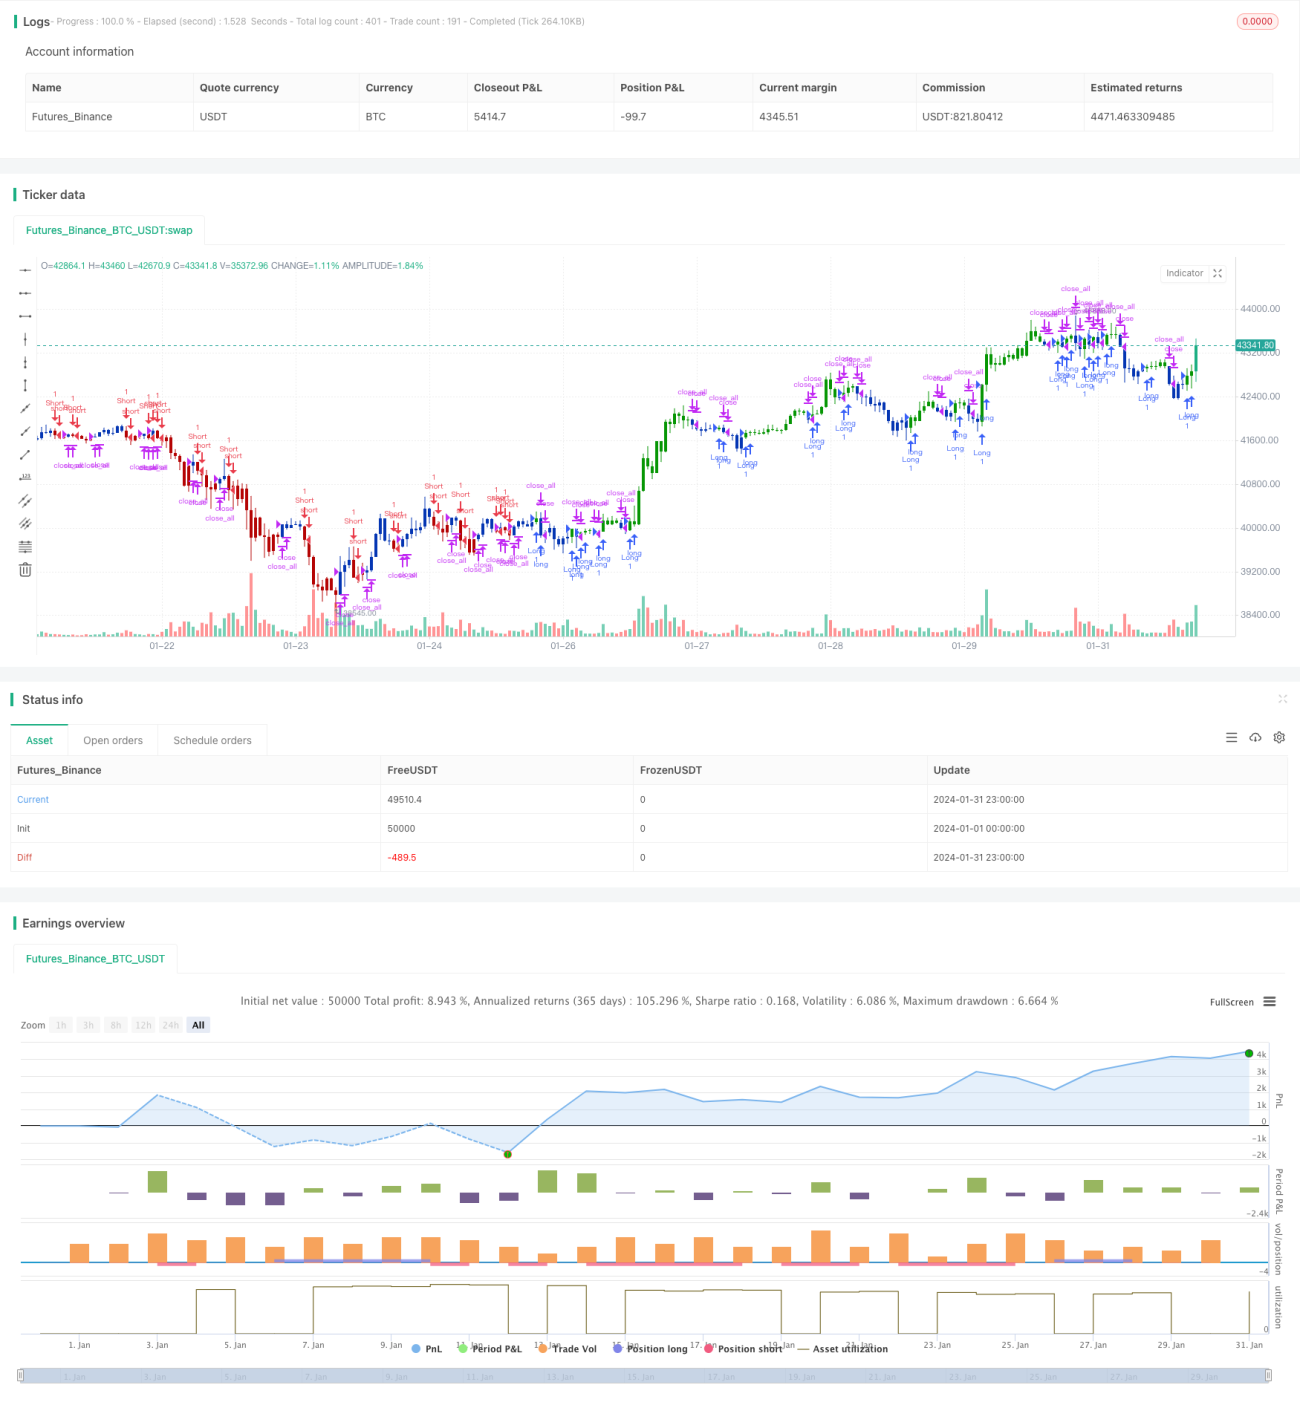
/*backtest
start: 2024-01-01 00:00:00
end: 2024-01-31 23:59:59
period: 1h
basePeriod: 15m
exchanges: [{"eid":"Futures_Binance","currency":"BTC_USDT"}]
*/

//@version=4
////////////////////////////////////////////////////////////
//  Copyright by HPotter v1.0 25/05/2021
// This is combo strategies for get a cumulative signal. - 1