Multi-Timeframe-Handelsstrategie basierend auf dem Kompressionsindikator

Überblick
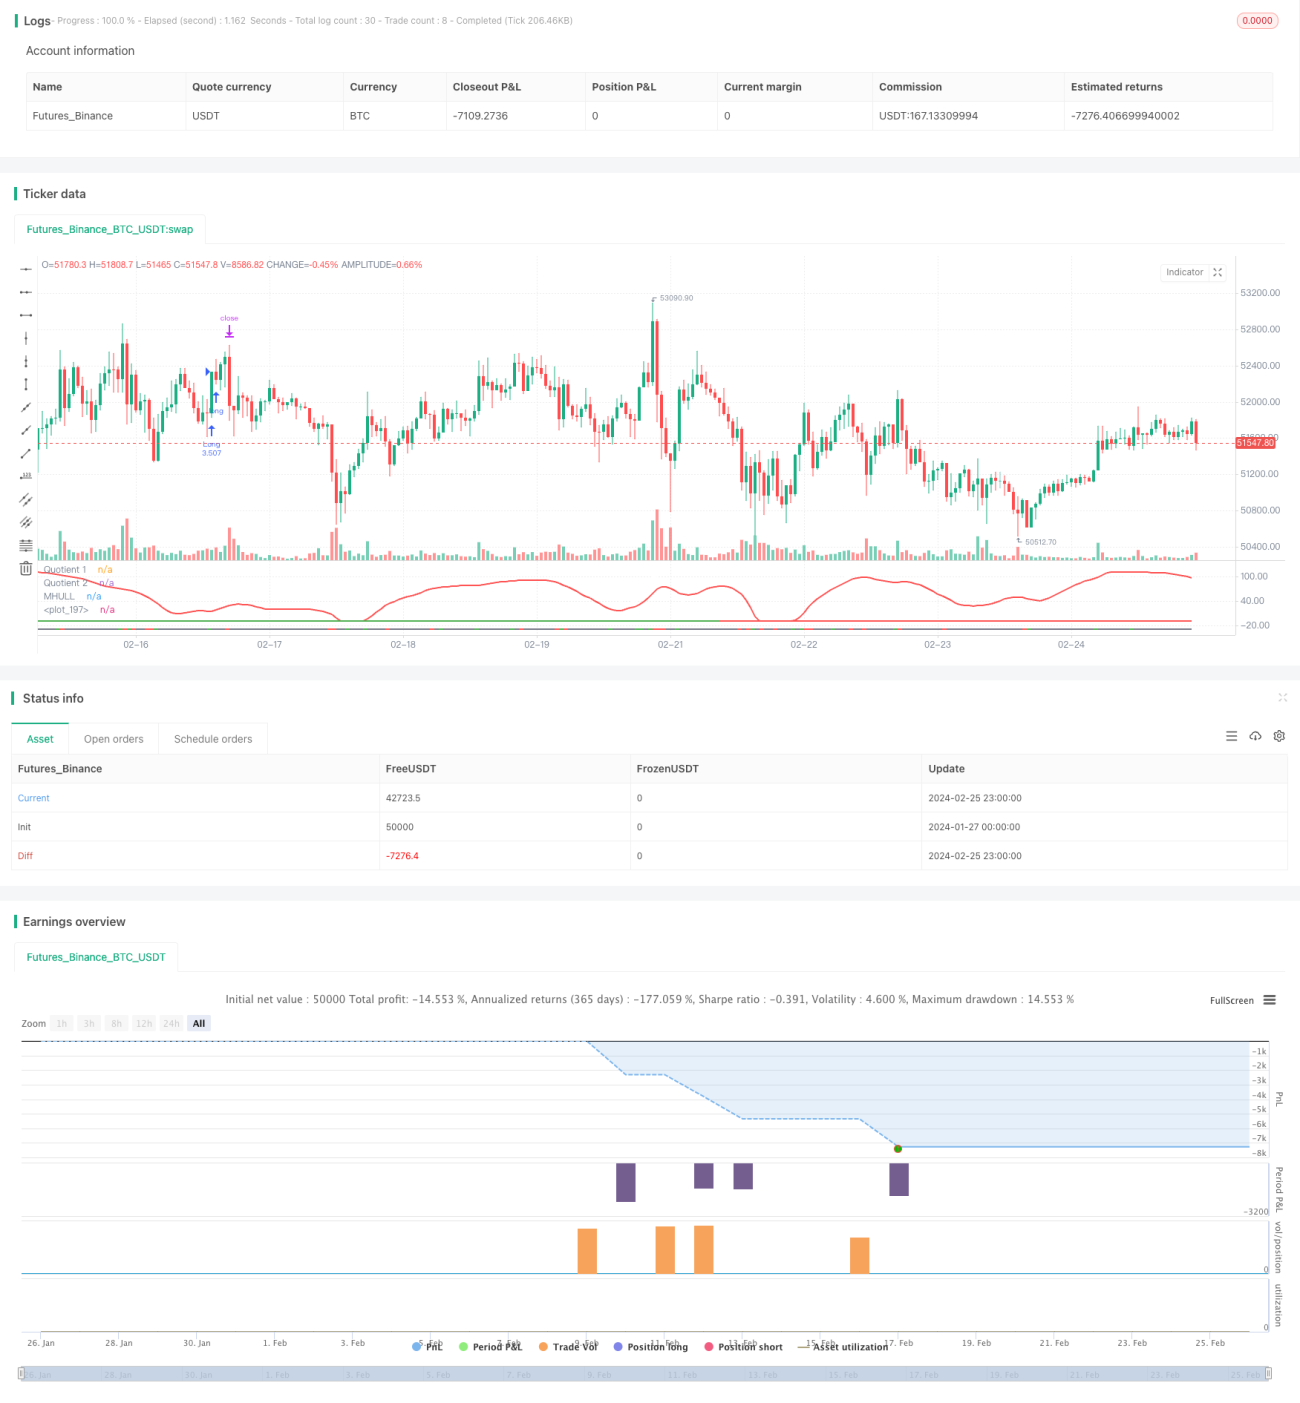
Die Strategie ermöglicht eine quantitative Strategie zur Trendverfolgung und zum Durchbruch von Transaktionen in mehreren Zeitrahmen durch die Kombination von Boom Hunter, Hull Suite und Volatilitätsoscillator. Die Strategie ist für digitale Assets mit hoher Volatilität und unerwarteten Preisentwicklungen wie Bitcoin geeignet.
Grundsätze
Die Kernlogik der Strategie basiert auf den folgenden drei Indikatoren:
-
**Boom Hunter ist ein japanischer Film- und TV-Schauspieler.**Die Quotient-Technologie ist ein Oszillator, der die Komprimierung von Indikatoren nutzt, um Kauf- und Verkaufssignale durch die Kreuzung von zwei Indikatoren (Quotient1 und Quotient2) zu bestimmen.
-
Hull-Suite: Eine Reihe von glatten beweglichen Mittellinien, die die Trendrichtung durch die Beziehung zwischen der mittleren und der oberen und unteren Bahn bestimmen.
-
Der VolatilitätsoscillatorDer Preisindex ist ein Oszillator, der die Informationen über die Preisschwankungen quantifiziert.
Die Eintrittslogik dieser Strategie besteht darin, dass der Preis den Hull-Mittelkurs durchbrechen und von der oberen oder unteren Bahn abweichen soll, während die Volatilitätsindikatoren im Überkauf-Überverkauf-Bereich liegen. Dies kann einige falsche Durchbruchsignale filtern und die Genauigkeit des Eintritts verbessern.
Der Stop-Loss wird durch die Suche nach einem Tiefst- oder Höchststand innerhalb eines bestimmten Zeitraums ([default 20 K-Line]) festgelegt, während der Gewinn durch den Stop-Loss-Prozentsatz multipliziert mit dem Stop-Ratio der Konfiguration ([default 3x]) erzielt wird. Die Position wird basierend auf dem Prozentsatz der Gesamtvermögenswerte des Kontos ([default 3%) und dem Stop-Loss-Wert für die jeweilige Marke berechnet.
Vorteile
- Verwenden Sie die Komprimierungstechnik, um die wichtigsten Handelssignale aus den Preisen zu extrahieren und die Gewinnwahrscheinlichkeit zu erhöhen
- Mehrfache Portfolio-Verifizierung, um falsche Durchbrüche zu vermeiden und die Richtung des Trends zu bestimmen
- Dynamische Stop-Loss-Stillungen, um eine risikobeherrschende Trendverfolgung zu ermöglichen
- Die Verwendung von Volatilitätsindikatoren, um den Handel in einem hochvolatilen Umfeld zu sichern
- Mehrfache Zeitrahmenanalyse zur Steigerung der strategischen Stabilität
Die Gefahr
- Die Wipper-Hunter-Anzeige kann eine Kompressionsverzerrung aufweisen, die zu einem falschen Signal führt.
- Die Hull-Sets werden mit Verzögerungen in der Bahn verbunden sein, was zu einer Zeitverzögerung bei der Preisveränderung führen wird.
- Wenn die Volatilität abnimmt, wird eine Handelschance verpasst oder eine Verlustbewältigung ausgelöst.
Die Lösung:
- Anpassung der Parameter der Kompressionsindikatoren, Ausgleich der Sensitivität der Indikatoren
- Versuchen Sie, Indikatoren wie den EHMA mit einem Moving Average zu ersetzen
- Erhöhung der Anzahl von Beurteilungsindikatoren zur Vermeidung von Schwankungen
Optimierung
Diese Strategie kann in folgenden Bereichen optimiert werden:
-
ParameteroptimierungDie optimale Kombination von Parametern durch Änderung von Indikatorparametern wie Zykluslänge, Kompressionsfaktor usw.
-
Optimierung des ZeitrahmensVerschiedene Zeiträume testen (z. B. 1 Minute, 5 Minuten, 30 Minuten usw.), um die am besten geeignete Handelsphase zu finden.
-
PositionsoptimierungDas Unternehmen hat die Möglichkeit, die Positionsgröße und -proportion für jeden Handel zu ändern, um die optimale Nutzung zu finden.
-
Stop-Loss-OptimierungAnpassung der Stop-Loss-Position an den jeweiligen Handelspartner, um das optimale Risiko-Rendite-Verhältnis zu erreichen
-
Optimierung der Bedingungen: Erhöhung oder Verringerung der Indikatorfilterbedingungen für eine genauere Einstiegszeit
Zusammenfassen
Die Strategie ermöglicht Trend-Tracking-Transaktionen in mehreren Zeitrahmen durch eine Kombination aus drei Indikatoren, dem Leinwandjäger, dem Hull-Set und dem Volatilitätsoscillator, und ist in der Lage, die unerwarteten Preisbewegungen effektiv zu identifizieren. Die Strategie ist für digitale Vermögenswerte mit hoher Volatilität geeignet. Die Strategie ist risikokontrollierbar und kann durch Parameter, Ripple-Bedingungen und Stop-Loss optimiert werden.
- 1