Dual Moving Average Turning Point Strategy

概述
双均线转向点交易策略是一种基于均线交叉的交易策略。它使用两个不同参数设置的移动平均线,根据它们的转向情况来判断入场和出场时机。该策略简单直观,容易实现,适用于中长线交易。
策略原理
该策略使用Price作为价格输入源,分别计算出两条不同参数的均线,SMA1和SMA2。策略使用ROC指标判断均线的转向情况。当SMA1的ROC值超过设定的正阈值时,认为SMA1向上转向,记录SMA1向上信号;当SMA1的ROC值跌破设定的负阈值时,认为SMA1向下转向,记录SMA1向下信号。SMA2的判断逻辑类似。
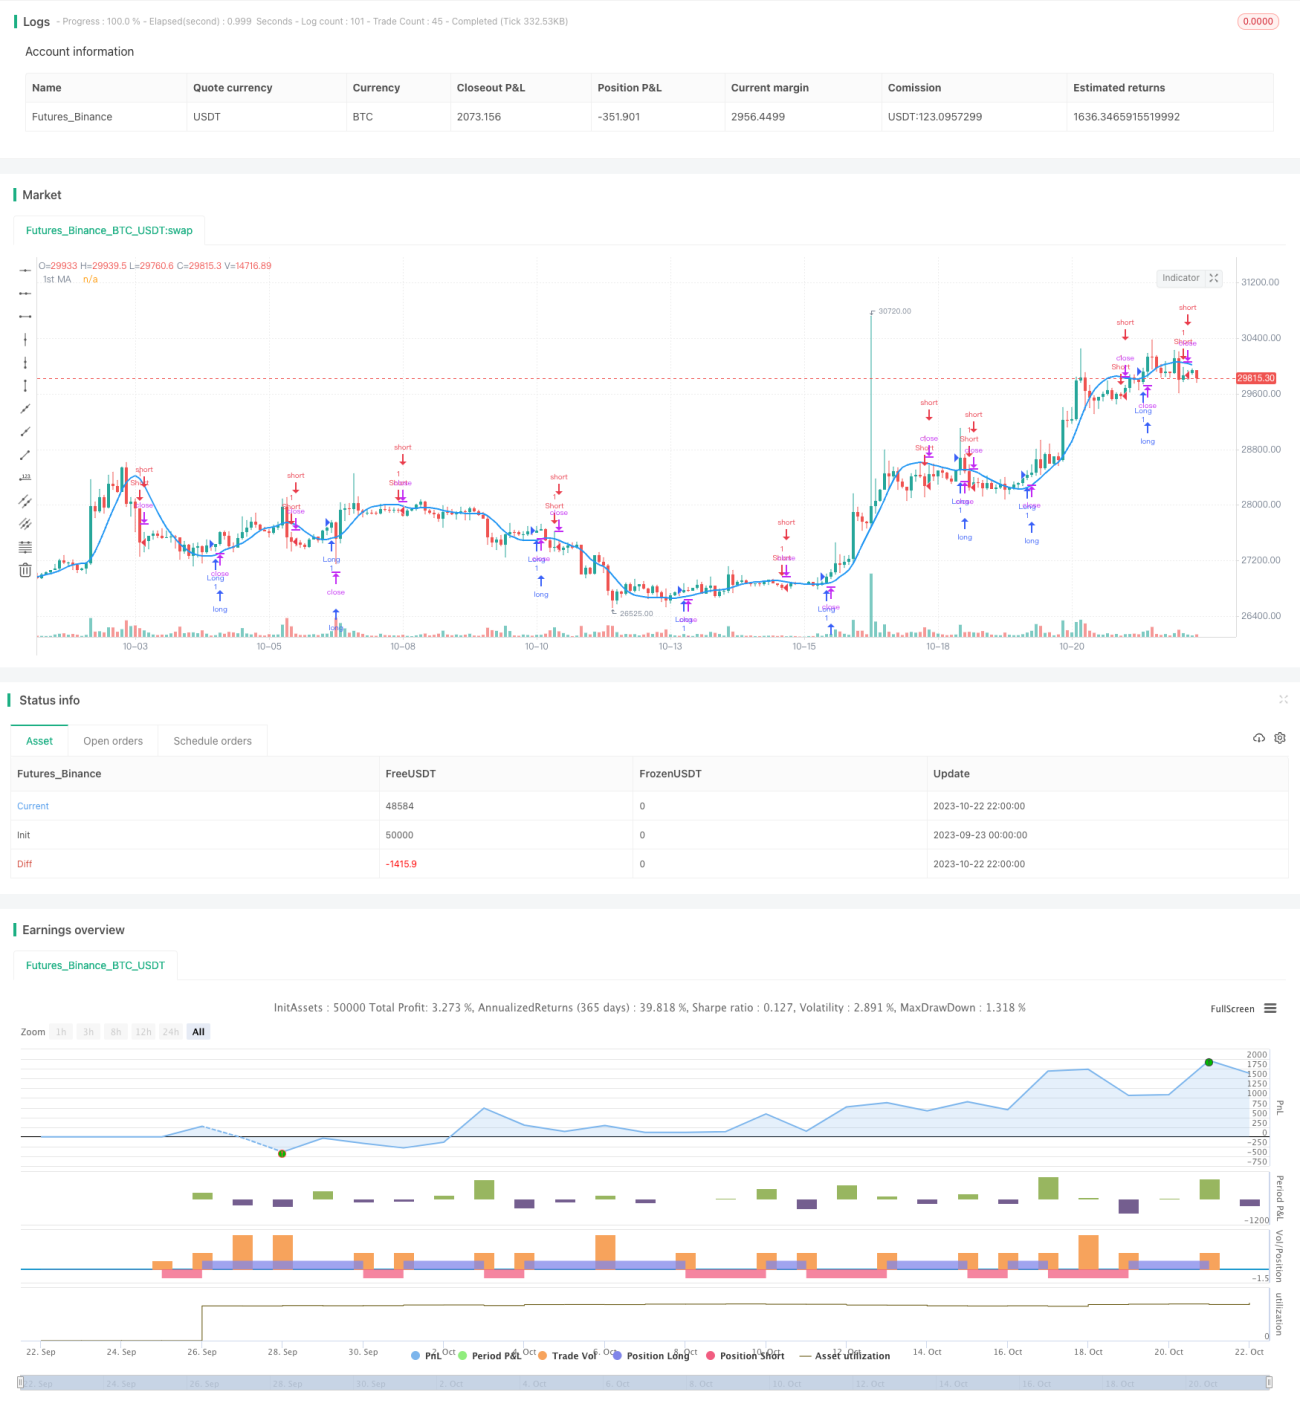
当SMA1向上转向并且上一根K线SMA2向下转向时,产生买入信号,做多;当SMA1向下转向并且上一根K线SMA2向上转向时,产生卖出信号,做空。
该策略使用两个均线的转向确定交易方向,一个均线的转向来确认入场时机,双均线交叉确保入场时刻趋势发生变化,可以有效过滤假突破。
优势分析
-
使用双均线交叉和转向判断,可以有效过滤假突破,提高入场的准确性。
-
均线转向结合ROC指标可以清晰判断转向时机,避免频繁交易。
-
采用中长线双均线,可以跟踪主趋势,获得较大的趋势获利。
-
策略逻辑简单清晰,容易理解实现,适合量化交易初学者。
-
可自定义参数,适应不同市场环境,有较强的适应性。
风险分析
-
双均线交叉在震荡行情中可能产生大量假信号,导致亏损。
-
ROC参数需要精确优化,否则转向识别会有误差,影响策略表现。
-
大周期震荡市可能触发多次止损,可通过扩大止损幅度来避免。
-
仅基于均线指标,对突发事件如重大新闻难以响应,可能导致损失。
-
需注意参数优化过拟合问题,测试周期要足够长,包含不同行情。
优化方向
-
优化移动平均线参数,寻找最佳均线周期组合
-
优化ROC参数,提高转向识别准确率
-
增加止损机制,可采用突破自定义价格级别的动态止损
-
增加附加条件,如交易量指标触发,避免假突破
-
结合其它指标,如MACD、BOLL等,提高决策效果
-
使用机器学习等方法自动优化参数,适应市场变化
总结
双均线转向点策略总体来说是一个简单实用的趋势跟踪策略。它只需要基础的均线指标就可以实现,逻辑清晰易于理解,非常适合量化交易初学者来学习和实践。通过参数优化和止损机制优化,可以大幅提高策略稳定性。与其他辅助指标结合使用可以进一步增强策略效果。该策略可自定义程度高,可以灵活应用在不同市场环境中,是一种值得推荐的双均线交易策略。
Overview
The Dual Moving Average Turning Point strategy is a trend following strategy based on moving average crossovers. It uses two moving averages with different parameter settings and determines entry and exit points according to their turning directions. This strategy is simple and intuitive, easy to implement, and suitable for medium-to-long term trading.
Strategy Logic
The strategy uses Price as the price input source and calculates two moving averages, SMA1 and SMA2, with different parameters. It uses the ROC indicator to determine the turning directions of the moving averages. When SMA1's ROC value exceeds the positive threshold, it is considered an upward turn of SMA1 and an upward signal is recorded. When SMA1's ROC value breaks the negative threshold, it is considered a downward turn of SMA1 and a downward signal is recorded. The judgment logic for SMA2 is similar.
When SMA1 turns upward and the previous bar's SMA2 turns downward, a buy signal is generated to go long. When SMA1 turns downward and the previous bar's SMA2 turns upward, a sell signal is generated to go short.
The strategy uses the turning directions of two moving averages to determine the trading direction and the turning of one moving average to confirm entry timing. The dual moving average crossover ensures the trend has changed when entering the market, which helps avoid false breakouts.
Advantage Analysis
-
Using dual moving average crossover and turning points can effectively filter out false breakouts and improve entry accuracy.
-
Combining moving average turning points with the ROC indicator can clearly identify turning points and avoid frequent trading.
-
Adopting medium-to-long-term dual moving averages can track the main trend and achieve sizable trend profits.
-
The strategy logic is simple and clear, easy to understand and implement, suitable for quant trading beginners.
-
Customizable parameters suit different market environments with strong adaptability.
Risk Analysis
-
Dual moving average crossovers may generate many false signals in ranging markets, leading to losses.
-
The ROC parameters need precise optimization, otherwise turn recognition will have errors, affecting strategy performance.
-
Large periodic ranging markets may trigger stop loss multiple times. Expanding stop loss range can avoid it.
-
Relying solely on moving averages, it's hard to respond to sudden events like major news, which may lead to losses.
-
Note the overfitting problem in parameter optimization. Test period should be long enough to include different market conditions.
Optimization Directions
-
Optimize moving average parameters to find the best moving average period combination.
-
Optimize ROC parameters to improve turning point recognition accuracy.
-
Add stop loss mechanisms such as dynamic stop loss based on breaking customized price levels.
-
Add additional conditions like volume indicators to avoid false breakouts.
-
Incorporate other indicators like MACD, BOLL to improve decision making.
-
Use machine learning etc. to auto optimize parameters and adapt to market changes.
Summary
In summary, the Dual Moving Average Turning Point strategy is a simple and practical trend following strategy. It can be implemented with basic moving average indicators and has clear, easy-to-understand logic, making it very suitable for quant trading beginners to learn and practice. With parameter optimization and stop loss optimization, the strategy stability can be greatly improved. Combining with other auxiliary indicators can further enhance the strategy. The highly customizable strategy can be flexibly applied to different market environments and is a recommended dual moving average trading strategy.
[/trans]
- 1