Estrategia de reversión de mínimos en marcos temporales múltiples

Descripción general
La estrategia utiliza una combinación de varios indicadores de la forma de la base para identificar el momento de una reversión drástica, y adopta una estrategia de seguimiento de tendencias para detener los daños, con el objetivo de obtener ganancias por encima de los daños.
El principio
La estrategia se basa principalmente en los siguientes indicadores para determinar la reversión del fondo:
-
Noro's BottomSensivity: determina si la línea K tiene una forma de fondo específica.
-
Índice de voluntad de determinación (CVI): juzgar que la psicología holística se enfrenta a una transformación.
-
Indicador final ((UCS): para determinar si el exceso de caída está fuera de la línea media.
-
Indicador de rentabilidad (RSI): para determinar si hay sobreventa.
-
Combinación de formas: incluye varias formas de base, como el pico, el pico, etc.
La estrategia utiliza una combinación de varios indicadores de la base y genera una señal de compra cuando se cumple con la cantidad de formas de la base establecida por los parámetros de la estrategia. Para filtrar las brechas falsas, la estrategia también incluye el criterio del indicador RSI, que solo activa la compra cuando se sobreventa.
El usuario puede configurar el uso y los parámetros de los diferentes indicadores de juicio básicos, lo que permite una gran flexibilidad. Al mismo tiempo, la estrategia incluye un filtro de línea media SMA para evitar hacer más por debajo de la tendencia.
Las ventajas
-
Utilizando varios indicadores para mejorar la certeza
-
Parámetros de indicadores personalizables para diferentes variedades
-
El SMA se filtra de forma uniforme y evita el tope.
-
Se puede configurar para que solo se acceda a la línea roja K, reduciendo el riesgo
-
Alarma de ventana de emergente y monitoreo en tiempo real
El riesgo
-
La combinación de varios indicadores podría haber perdido el fondo
-
La forma de la base no tiene por qué ser constante.
-
La necesidad de centrarse en si el volumen de transacciones apoyará la inversión
Dirección de optimización
-
Optimización de la configuración de los parámetros del indicador para adaptarse a las diferentes variedades
-
Aumentar la gestión de las posiciones y reducir los costos a través de la adquisición de las mismas
-
Aumentar las estrategias para detener pérdidas y seguir las tendencias para detener pérdidas
Resumir
La estrategia aprovecha el juicio de múltiples indicadores para mejorar la precisión de la identificación de la base, y el seguimiento de la tendencia para bloquear los ganancias y los pérdidas para controlar el riesgo de manera efectiva. Sin embargo, se debe prestar atención a si el volumen de transacciones puede apoyar la tendencia de reversión.
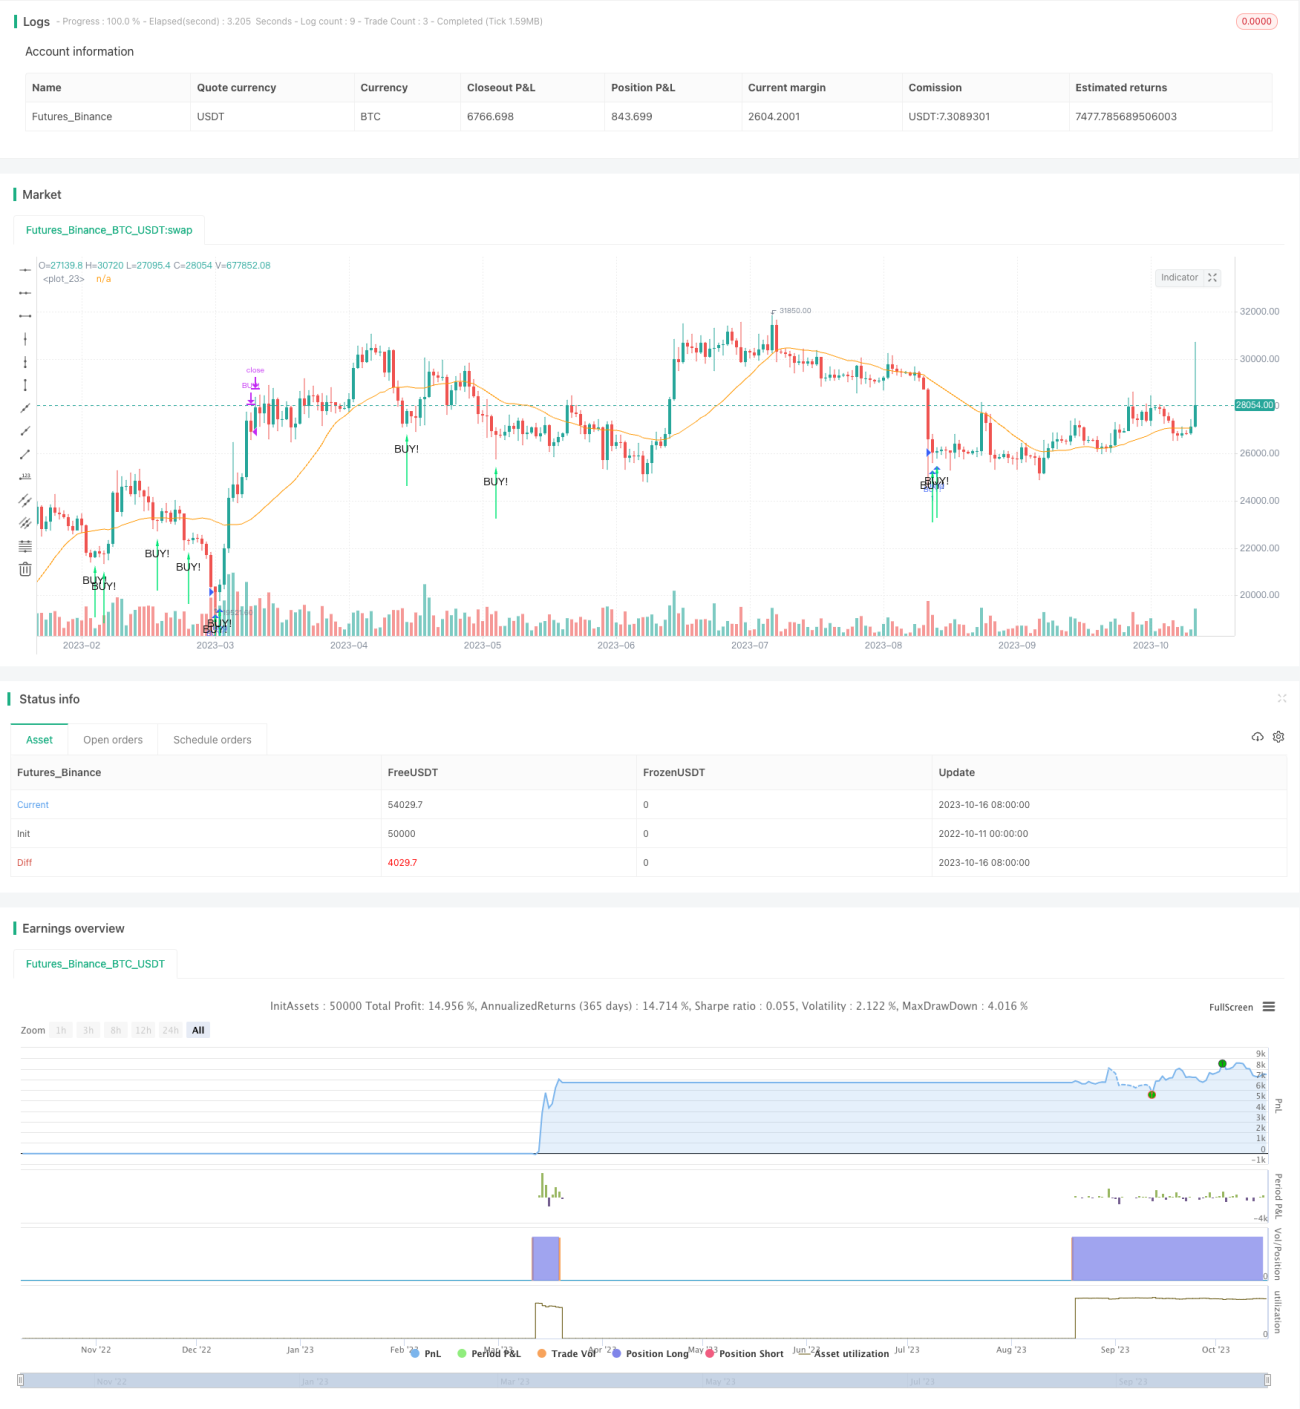
/*backtest
start: 2022-10-11 00:00:00
end: 2023-10-17 00:00:00
period: 1d
basePeriod: 1h
exchanges: [{"eid":"Futures_Binance","currency":"BTC_USDT"}]
*/

// the original indicator is Noro's BottomSensivity v0.6
//@version=4
strategy("Noro's BottomSensivity v0.6 strategy + rsi + Alarm", shorttitle="Bottom 0.6 StRsiAlarm", overlay=true)
- 1