Estrategia de ruptura de medias móviles de alto nivel

Descripción general
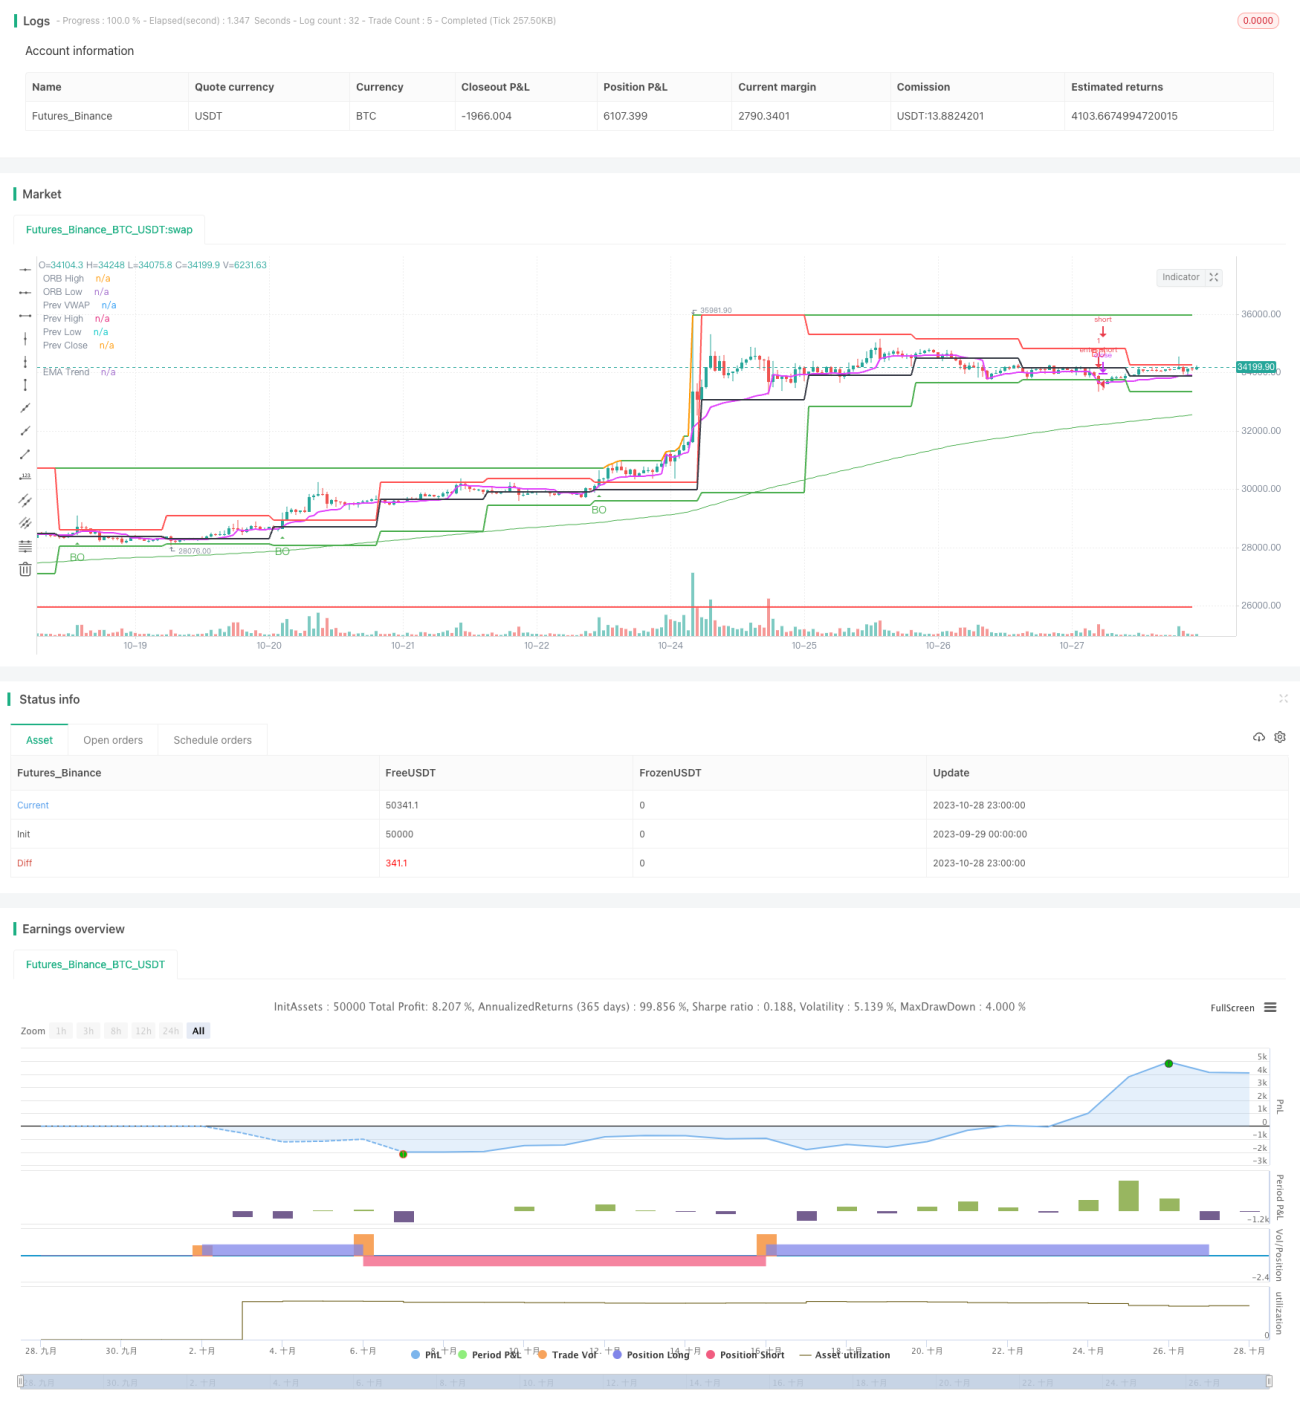
La idea principal de esta estrategia es utilizar las rupturas de la línea media de nivel superior para lograr el comercio de tendencias. En el rango de tiempo de nivel superior, se puede determinar el comienzo de la tendencia cuando los precios rompen la línea media hacia arriba o hacia abajo, y se puede elegir la dirección adecuada para el seguimiento.
Principio de estrategia
La estrategia se desarrolló a través del lenguaje Pine Script y se divide en las siguientes partes:
-
Parámetros de entrada
Se define el parámetro de período de la línea media, con el valor predeterminado de 200; se define el parámetro de período de tiempo de la línea K, con el valor predeterminado de la línea diaria "D" <unk>.
-
Cálculo de la línea media
Utiliza la función ta.ema para calcular el promedio móvil exponencial.
-
El juicio se rompió
Utilice las funciones ta.crossover y ta.crossunder para determinar si el precio ha roto o ha bajado de la línea media.
-
Mapeo de señales
Cuando se produzca una ruptura, se traza una flecha hacia arriba o hacia abajo en la línea K.
-
El comercio se cierra.
La posición se abre en la dirección elegida en el momento de la ruptura y se cierra después de que se alcance la distancia de doble parada.
La estrategia se basa en la capacidad de determinar tendencias en la línea media de alto nivel y el seguimiento de tendencias a través de operaciones de ruptura simples, que pertenecen a las estrategias de ruptura más tradicionales.
Análisis de las ventajas
La estrategia tiene las siguientes ventajas:
-
El concepto es simple, fácil de entender y dominar.
-
El ajuste de los parámetros es sencillo con sólo un indicador de la línea media.
-
Las operaciones de ruptura son fáciles de hacer tendencia y no se negocian con frecuencia.
-
Los ciclos de alto nivel muestran claramente las tendencias generales y no se ven afectados por las fluctuaciones a corto plazo.
-
Se pueden configurar diferentes combinaciones de períodos de tiempo para diferentes variedades.
-
La mayoría de las especies de la especie son de la misma especie, pero la mayoría de las especies son de la misma especie.
Análisis de riesgos
La estrategia también tiene sus riesgos:
-
Las señales de ruptura pueden ser falsas y no filtrar eficazmente los movimientos del mercado.
-
No se puede aprovechar de manera eficiente las oportunidades de la línea corta para obtener beneficios.
-
Los perjuicios pueden ser más graves cuando la dirección hace un error de juicio.
-
Cuando el ciclo de la línea media no coincide con el ciclo de negociación, se produce un exceso de operaciones o pérdidas.
-
No se puede detener en tiempo real, y es más probable que se amplíen las pérdidas.
Las soluciones para hacer frente al riesgo incluyen: combinación de indicadores de tendencia, aumento de las condiciones de filtración, reducción adecuada del período de tenencia de la posición, ajuste dinámico de la posición de stop loss, etc.
Dirección de optimización
La estrategia puede considerarse para optimizar en los siguientes aspectos:
-
Aumentar la combinación de indicadores de tendencia, como MACD, KD, etc., para aumentar la fiabilidad de las rupturas.
-
Aumentar las condiciones de filtrado, como el volumen de transacciones o el canal de la línea de browsing, para evitar falsas brechas.
-
Optimizar la coincidencia de los ciclos de los parámetros para que los ciclos de tenencia coincidan mejor con los ciclos de tendencia.
-
Aumentar las estrategias de stop loss en tiempo real para controlar las pérdidas individuales mediante el seguimiento de los stops.
-
Considere la optimización dinámica de los parámetros, combinada con la tecnología de aprendizaje automático.
-
La idea es que los inversores de la zona de mercado de la zona de mercado de la zona de mercado de la zona de mercado de la zona de mercado de la zona de mercado de la zona de mercado.
Resumir
En general, la estrategia es sencilla, práctica, fácil de dominar y puede usarse como una de las estrategias de entrada para el comercio cuantitativo. Sin embargo, también hay algunos problemas que requieren mejoras a través de indicadores combinados, parámetros de optimización, parámetros de parada dinámicos, etc., para que la estrategia sea más estable y eficiente. Tiene un gran espacio de optimización y escalabilidad.
- 1