Estrategia de negociación de índices fuertes impulsada por bandas dobles
Fecha de creación:
2023-12-12 17:12:35
Última modificación:
2023-12-12 17:47:33
Copiar:
1
Número de Visitas:
1068
1
Seguir
1750
Seguidores
Descripción general
Esta estrategia combina un indicador de doble banda y un indicador de índice de fuerza para lograr un modelo de negociación de ruptura. Cuando el EMA rápido rompe el canal de la banda de ondas, se combina con la señal de dirección de múltiples espacios del indicador AO para generar señales de compra y venta.
Principio de estrategia
- El uso de la banda de Brin para determinar el canal de precios de la vía media, la vía superior y la vía inferior
- El EMA rápido cruzará la órbita media y se considerará una ruptura de canal.
- El índice de fuerza AO indica la dirección de las cabezas múltiples y las cabezas vacías.
- Cuando el EMA rápido se eleva por la vía media y el AO es positivo, se genera una señal de compra.
- Cuando el EMA rápido desciende a la mitad de la vía y el AO es negativo, se genera una señal de venta.
Análisis de las ventajas
- El indicador de doble banda de onda determina el canal de precios y evita las señales erróneas.
- El indicador AO determina la dirección de la tendencia, lo que hace que las señales de negociación sean más precisas.
- La combinación de este modelo de negociación con la ruptura del canal permite capturar más ganancias en las fases iniciales de la tendencia.
Análisis de riesgos
- Los parámetros incorrectos de la banda de Bryn pueden hacer que el canal sea demasiado ancho o demasiado estrecho.
- La configuración de los parámetros del indicador AO puede afectar la precisión del juicio.
- La señal de ruptura puede ser falsa y se debe asegurar que haya suficiente fuerza de ruptura.
Cómo solucionarlo
- Optimizar los parámetros de la banda de Bryn y el indicador AO para encontrar la combinación óptima.
- Aumentar las condiciones de fuerza de la ruptura para evitar falsas rupturas.
- Se utiliza en combinación con otros indicadores para garantizar la fiabilidad de las señales de negociación.
Dirección de optimización
- Optimizar los parámetros de la banda de Bryn para encontrar el rango de canal más adecuado.
- Optimización de los parámetros de la línea media a largo y corto plazo de los indicadores de AO para mejorar la precisión de los juicios.
- Aumentar el volumen u otros indicadores de filtración para asegurar la fiabilidad de la brecha.
- Optimización de los parámetros de fuerza de ruptura para reducir la tasa de falsa ruptura.
Resumir
Esta estrategia, que tiene en cuenta el canal de precios, la dirección de la tendencia y el patrón de ruptura, es una estrategia de negociación más estable y eficiente. Mediante la optimización de parámetros y el filtrado de indicadores combinados, se puede aumentar aún más la solidez y la rentabilidad de la estrategia. Su patrón de ruptura puede capturar oportunidades tempranas de tendencia y tiene un gran valor práctico.
Código Fuente de la Estrategia
/*backtest
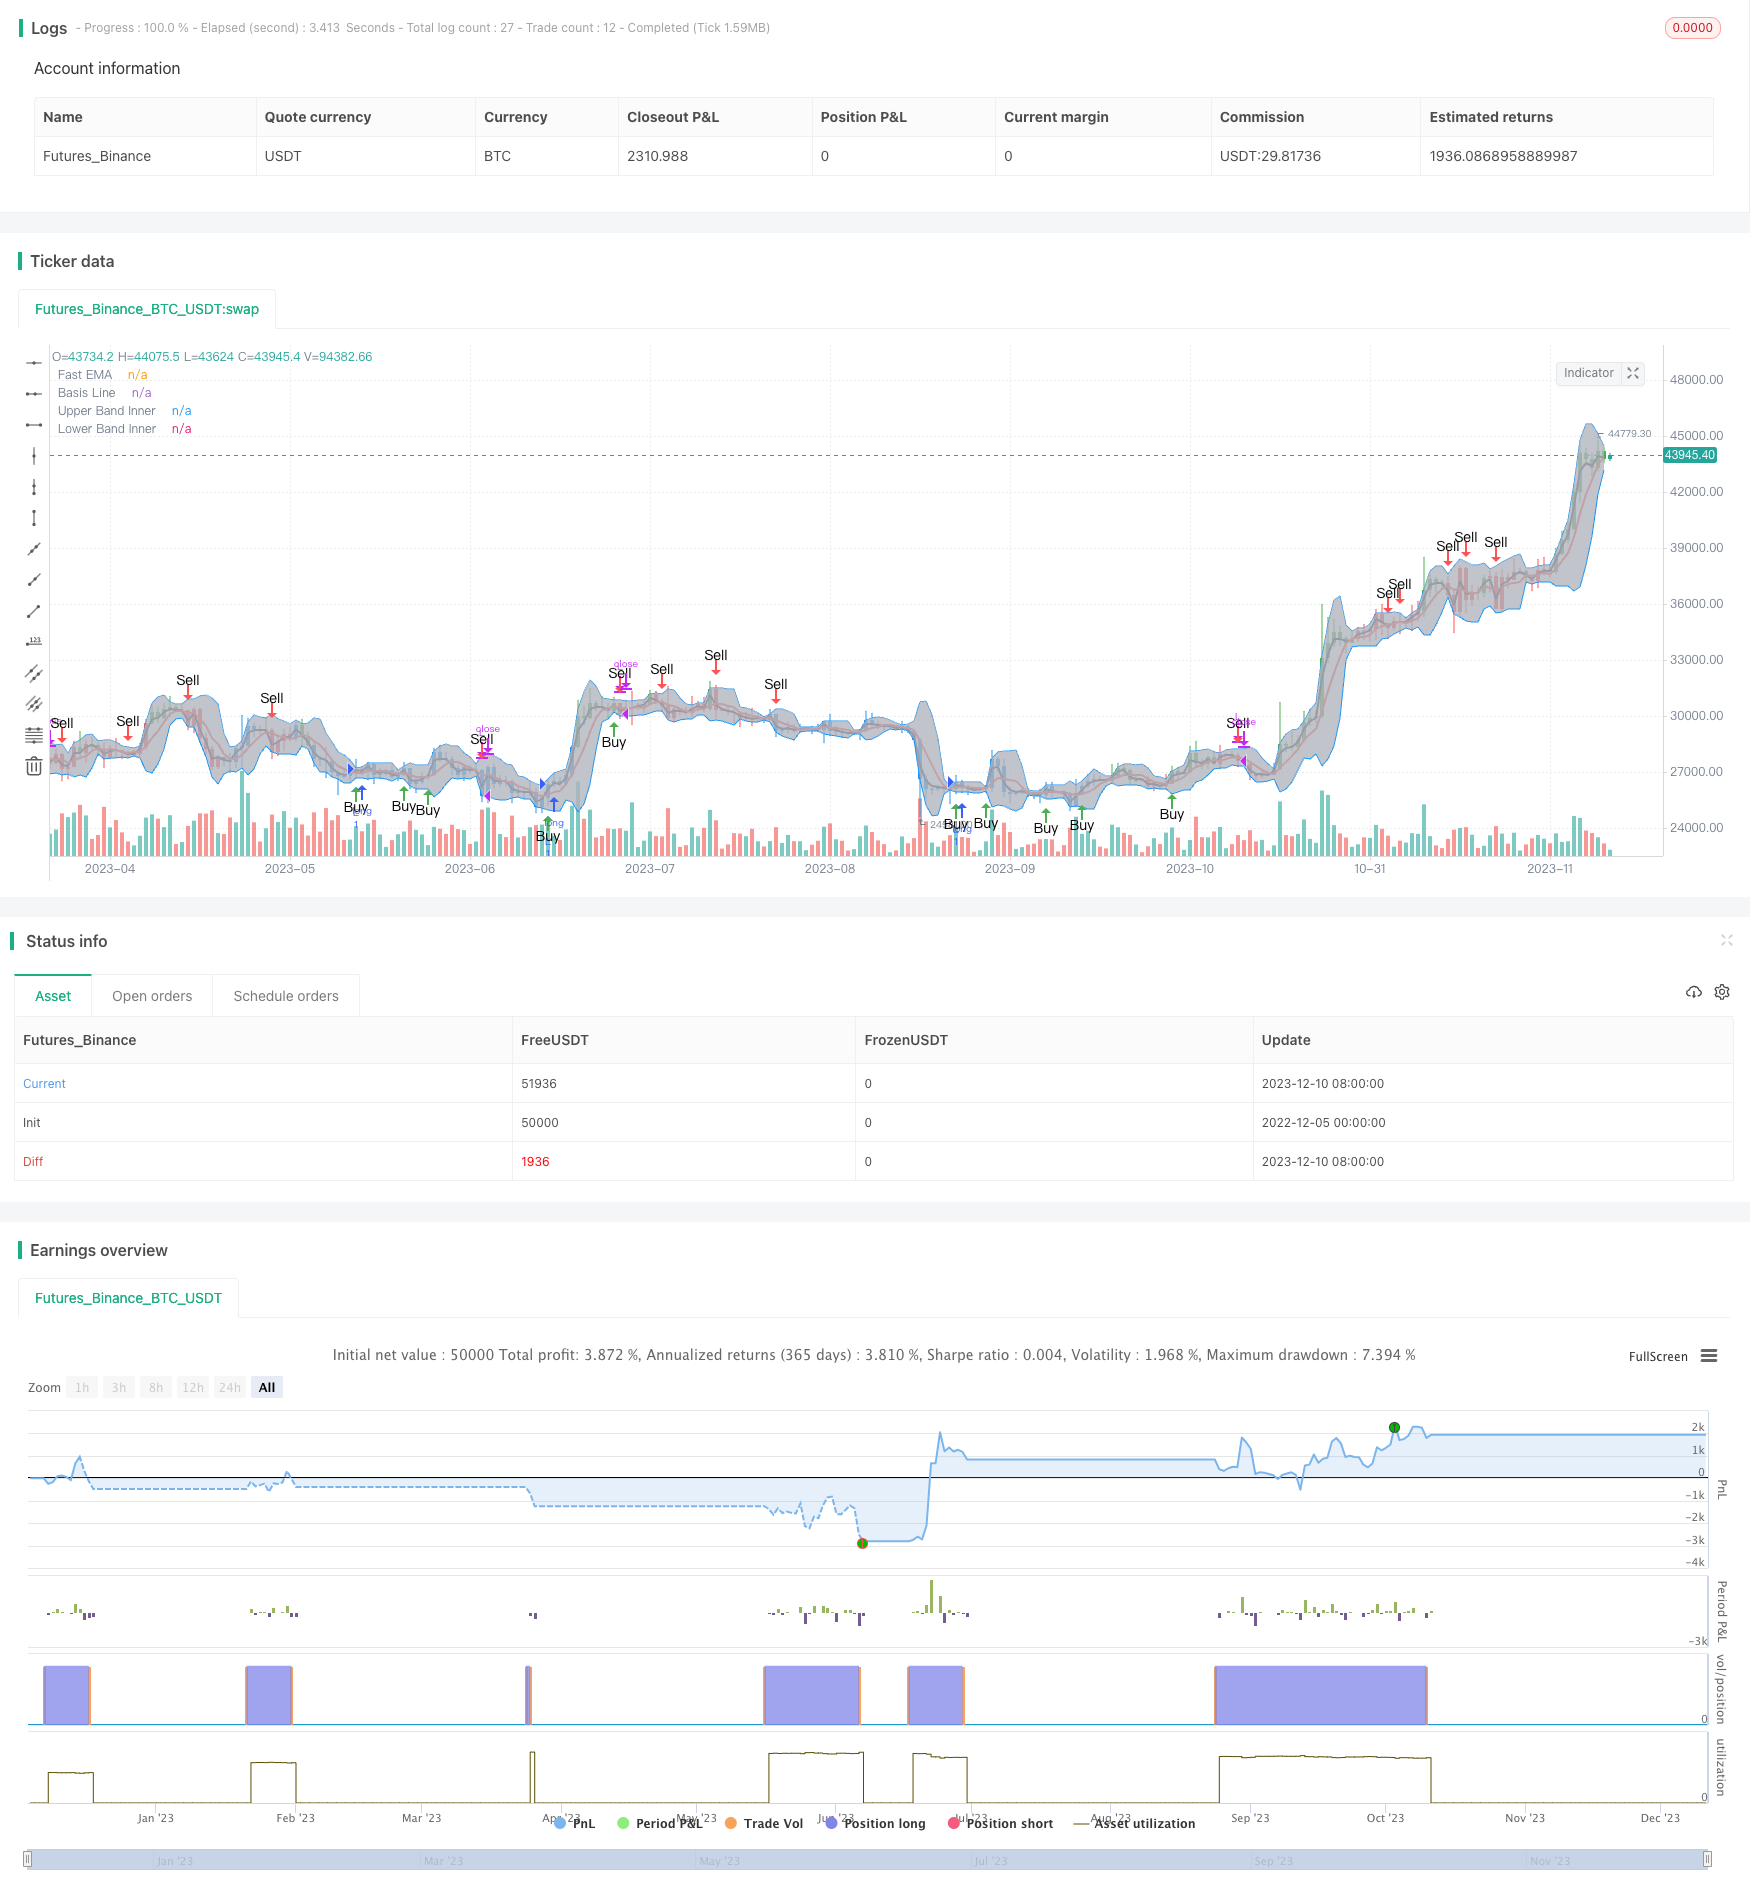
start: 2022-12-05 00:00:00
end: 2023-12-11 00:00:00
period: 1d
basePeriod: 1h
exchanges: [{"eid":"Futures_Binance","currency":"BTC_USDT"}]
*/
//@version=3
strategy(shorttitle="BB+AO STRAT", title="BB+AO STRAT", overlay=true)
// === BACKTEST RANGE ===
FromMonth = input(defval = 6, title = "From Month", minval = 1)
FromDay = input(defval = 1, title = "From Day", minval = 1)
FromYear = input(defval = 2018, title = "From Year", minval = 2014)
ToMonth = input(defval = 1, title = "To Month", minval = 1)
ToDay = input(defval = 1, title = "To Day", minval = 1)
ToYear = input(defval = 9999, title = "To Year", minval = 2014)
// Bollinger Bands Inputs
bb_use_ema = input(false, title="Use EMA for Bollinger Band")
bb_length = input(5, minval=1, title="Bollinger Length")
bb_source = input(close, title="Bollinger Source")
bb_mult = input(2.0, title="Base Multiplier", minval=0.5, maxval=10)
// EMA inputs
fast_ma_len = input(2, title="Fast EMA length", minval=2)
// Awesome Inputs
nLengthSlow = input(34, minval=1, title="Awesome Length Slow")
nLengthFast = input(5, minval=1, title="Awesome Length Fast")
// Breakout Indicator Inputs
bb_basis = bb_use_ema ? ema(bb_source, bb_length) : sma(bb_source, bb_length)
fast_ma = ema(bb_source, fast_ma_len)
// Deviation
dev = stdev(bb_source, bb_length)
bb_dev_inner = bb_mult * dev
// Upper bands
inner_high = bb_basis + bb_dev_inner
// Lower Bands
inner_low = bb_basis - bb_dev_inner
// Calculate Awesome Oscillator
xSMA1_hl2 = sma(hl2, nLengthFast)
xSMA2_hl2 = sma(hl2, nLengthSlow)
xSMA1_SMA2 = xSMA1_hl2 - xSMA2_hl2
// Calculate direction of AO
AO = xSMA1_SMA2>=0? xSMA1_SMA2 > xSMA1_SMA2[1] ? 1 : 2 : xSMA1_SMA2 > xSMA1_SMA2[1] ? -1 : -2
// === PLOTTING ===
// plot BB basis
plot(bb_basis, title="Basis Line", color=red, transp=10, linewidth=2)
// plot BB upper and lower bands
ubi = plot(inner_high, title="Upper Band Inner", color=blue, transp=10, linewidth=1)
lbi = plot(inner_low, title="Lower Band Inner", color=blue, transp=10, linewidth=1)
// center BB channel fill
fill(ubi, lbi, title="Center Channel Fill", color=silver, transp=90)
// plot fast ma
plot(fast_ma, title="Fast EMA", color=black, transp=10, linewidth=2)
// Calc breakouts
break_down = crossunder(fast_ma, bb_basis) and close < bb_basis and abs(AO)==2
break_up = crossover(fast_ma, bb_basis) and close > bb_basis and abs(AO)==1
// Show Break Alerts
plotshape(break_down, title="Breakout Down", style=shape.arrowdown, location=location.abovebar, size=size.auto, text="Sell", color=red, transp=0)
plotshape(break_up, title="Breakout Up", style=shape.arrowup, location=location.belowbar, size=size.auto, text="Buy", color=green, transp=0)
// === ALERTS ===
strategy.entry("L", strategy.long, when=(break_up and (time > timestamp(FromYear, FromMonth, FromDay, 00, 00)) and (time < timestamp(ToYear, ToMonth, ToDay, 23, 59))))
strategy.close("L", when=(break_down and (time < timestamp(ToYear, ToMonth, ToDay, 23, 59))))
// === /PLOTTING ===
barcolor(AO == 2 ? red: AO == 1 ? green : blue )
// eof